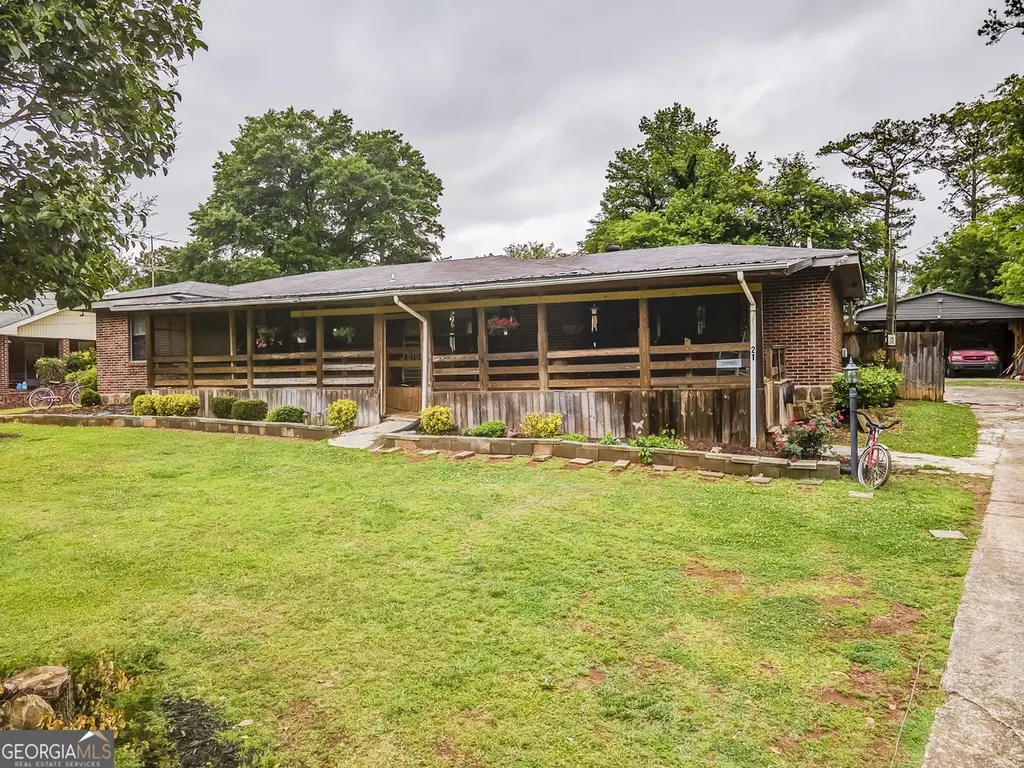
21 Lady Marian Dr NE · Rome, GA
Flood risk 1/10 · Minimal
- FEMA flood zone
- X (unshaded)
- Chance of flooding over 30 yrs
- 0.0%
- Est. flood insurance / yr
- $507 – $1,088
Fire risk 4/10 · Minor
- Est. fire insurance / yr
- $963 – $1,789
Heat risk 6/10 · Moderate
- Hot days now (above 105°F)
- 7 days/yr
- Hot days in 30 yrs
- 18 days/yr
Wind risk 4/10 · Minor
- Chance of severe wind over 30 yrs
- 21.0%
Air-quality risk 3/10 · Minor
- Unhealthy air days now
- 3 days/yr
- Unhealthy air days in 30 yrs
- 4 days/yr
Risk factors via First Street. Map © Google.
Why this score? — see what drove the D grade
The composite is a weighted blend of 9 inputs, each scored 0–100. Each bar is that input's sub-score; the figure is the points it added to the 100-point composite (weight × sub-score).
- Cash flow +13.3/30.0
- ARV discount +10.4/15.0
- Rent growth +4.1/5.0
- DSCR +4.0/10.0
- Schools +3.5/10.0
- Livability +3.2/5.0
- 1% rule +2.8/10.0
- Condition / age +2.5/5.0
- Appreciation +0.0/10.0
$190,000
🖨 Deal sheet (PDF) 📄 Offer letter ✓ Due diligence
Listing remarks
Charming home in a highly sought after location & school district! Offering flexible living space, this property is full of potential for first time buyers, investors, or anyone looking to add personal touches. Features include bonus space (currently used as 3rd bedroom), spacious yard, & an affordable opportunity to own in a prime area. Conveniently located near shopping, dining, parks, & schools! Call to schedule your private showing today! * All information deemed reliable, but buyer to verify. *
Key facts
- Spacious yard
- Bonus space
- School district
Tags
Property features AI
Finance
- Other: Sold/as‑is condition noted in listing
- HOA & community: No HOA
Exterior
- Parking: Carport
- Utilities: Public water; Septic tank; Cable available; Electricity available; Natural gas available; Phone available; Water available
- Home design: Single-family house; Residential resale; Built in 1957
- Construction: Brick construction; Composition roof; Public records list 1501 building area
- Exterior features: Deck; Porch; Screened porch; Fenced yard; Sloped lot; Outbuilding
Interior
- Kitchen: Refrigerator
- Bedrooms: 3 bedrooms on the main level
- Flooring: Hardwood; Laminate; Tile
- Bathrooms: 2 full bathrooms
- Heating & cooling: Natural gas heating; Window unit(s) for cooling
- Interior features: Split bedroom plan; Tile bath; Accessible approach with ramp; One level
- Laundry & utility: Laundry closet
Neighborhood map
What this means for you Summary
Snapshot
- This is a 3-bed/1.0-bath single-family listed at $190k.
Deal economics
- At list price, monthly cash flow is $1 ($8/yr) — positive.
- The deal already cash-flows at list — no discount required.
- To meet the 1% rule (rent ≥ 1% of price), the offer needs to be $149k (21.7% below list).
- Recommended offer: $149k (21.7% below list) — sets the bar for 1% rule.
- Cap rate 6.3% vs local median 3.4% in Rome — top-decile yield for the area; either an underpriced asset or a hidden risk that comps aren't pricing in. Stress-test before assuming the spread holds.
Location & tenants
- Location reads 64/100 on livability (#266 in GA) — a middle-class / working-renter tenant base. Strengths: cost of living A+, housing A+, health & safety A+; Watch: crime F, amenities F, commute F.
- Floyd County (rural): math 41% / reading 40% proficiency, ranked #45 of 174 in GA (top 26%) — families likely to look elsewhere, expect single-tenant / working-renter base with shorter leases.
- Zoned schools: Johnson Elementary (math 69% / reading 60%, grade B, #95 of 1,228 statewide, top 8%, 498 students, 34% FRL); Model Middle School (math 47% / reading 53%, grade C, #68 of 470 statewide, top 15%, 519 students, 41% FRL); Model High (math 36% / reading 43%, grade F, #57 of 424 statewide, top 13%, 912 students, 32% FRL).
- Market conditions: Rents rising fast (+6.3%/yr); 412 active listings in the ZIP; 1 comparable units currently listed for rent nearby; 355 units permitted in Floyd County in 2024 (0 in 5+ unit buildings).
Forward outlook
- Local home prices are declining (-3.0%/yr); year-one equity from $1k of loan paydown is wiped out by about $6k of value loss. Plan a longer hold.
- Floyd County population projected to shrink 6% by 2050 — rents likely to lag national; underwrite the cash flow, not the appreciation.
Negotiation context
- It's been on market 19 days — a 2% lower offer ($187k) is reasonable based on typical stale-listing flexibility.
- 3 sale attempts with the ask held roughly flat each time — persistent listings suggest the price (not the market) is what's stuck; bring a comps-based counter.
Risks & watch-outs
- Watch-outs: built in 1957 — expect roof / HVAC / electrical / plumbing capex.
- Climate carrying-cost: extreme-heat days projected 7→18/yr by 2055 (HVAC capex compounding) — expect insurance premiums to compound above CPI over the hold.
Questions for the listing agent
- Built in 1957 — when were the roof, HVAC, electrical panel, plumbing, and water heater last replaced?
- Is there a deadline driving the sale (1031 exchange, divorce, estate, relocation)? That informs how much negotiation room exists.
- Schools are F-rated, which usually means shorter tenancies and higher turnover. Who's the typical renter profile here, and what's been the actual vacancy rate?
- Crime grade is F in this area — have there been break-ins, vandalism, or insurance claims at this property in the last 3 years? What carrier currently insures it and at what premium?
- The area grade is low — what's the realistic commute time and amenity access for the typical tenant pool here? Any planned neighborhood developments (good or bad) we should know about?
- What's the average days-on-market for RENTAL listings here right now (not sales)? A rising rental-DOM trend means longer vacancies and softer asking-rent achievability than the comps imply.
- What's the recent tenant-quality profile in this submarket — average credit score on applications, eviction rate, late-payment / NSF rate, and stable-employment percentage? A property-management company in the area should have these aggregated.
- How much new for-sale + rental construction is in the pipeline within 1–3 miles? Heavy new supply typically softens prices + rents 12–24 months out; constrained supply supports both.
Investment metrics
- 1% rule
- 0.78% ✗
- Cap rate
- 6.30%
- Cash-on-cash
- 0.01%
- DSCR
- 1.00
- GRM
- 10.6
CMA / ARV
- ARV (median comp)
- $203,050
- List price
- $190,000
- Delta
- -6.43%
- Verdict
- FAIR
- Comps
- 20 within 1.0 mi
Show comp detail 11 sales within ~0.75 mi
| Address | Dist | Beds/Ba | Sqft | Sold | Price | $/sf | Match |
|---|---|---|---|---|---|---|---|
| 6 Nottingham Way NE | 0.18mi | 3/1.0 | 1,429 (-5%) | 4mo | $195,000 | $136 | 80 |
| 16 Barnesdale Way NE | 0.13mi | 3/2.0 | 1,584 (+6%) | 2mo | $248,400 | $157 | 79 |
| 108 Wilshire Rd | 0.22mi | 4/1.0 (+1) | 1,508 (+0%) | 10mo | $200,000 | $133 | 76 |
| 1 Lionel Ct NE | 0.15mi | 3/1.5 | 1,623 (+8%) | 3mo | $210,000 | $129 | 75 |
| 14 Lionel Ln NE | 0.17mi | 3/2.0 | 1,404 (-6%) | 23mo | $128,825 | $92 | 58 |
| 408 Robin Hood Rd NE | 0.27mi | 3/2.0 | 1,693 (+13%) | 14mo | $230,000 | $136 | 50 |
| 118 Dekle Dr NE | 0.46mi | 3/2.0 | 1,720 (+15%) | 7mo | $385,000 | $224 | 44 |
| 17 View Dr SE | 0.68mi | 3/2.0 | 1,440 (-4%) | 23mo | $287,000 | $199 | 38 |
| 8 Berkshire Ln NE | 0.54mi | 3/2.0 | 1,669 (+11%) | 20mo | $260,000 | $156 | 35 |
| 127 Jim Lee Dr | 0.69mi | 3/2.0 | 1,703 (+14%) | 13mo | $145,000 | $85 | 31 |
| 116 Jim Lee Dr NE | 0.75mi | 3/1.0 | 1,352 (-10%) | 22mo | $158,000 | $117 | 30 |
Match score weights: distance 35% · size 25% · config 20% · recency 20%. Top-matched comps best support the ARV.
Projected returns pro-forma
-3.0% appreciation · 6.28% rent growth · sell at horizon
- IRR
- -13.1%
- Equity multiple
- 0.52×
- Total profit
- $-25,736
- Equity at exit
- $28,330
- IRR
- -0.1%
- Equity multiple
- 0.99×
- Total profit
- $-340
- Equity at exit
- $16,428
Cash invested: $53,200 (down + closing). Projections, not guarantees.
Landlord ↔ Tenant lean methodology
- Overall (STATE)
- 90 Strongly Landlord-Friendly
- State Georgia
- 90 Strongly Landlord-Friendly · R+3
- County
- — inherits STATE
- City
- — inherits STATE
ZIP-level market 30161
- Rents YoY
- 6.3%
- Active inventory
- 412
- Price-to-rent
- 10.6×
Monthly cashflow live
- Estimated rent
- $1,488 medium interval (Pro) →
- Mortgage (P&I)
- −$996
- Tax from tax record
- −$100 /mo · $1,194/yr
- Insurance
- −$79
- HOA
- −$0
- Vacancy / Maint / Mgmt
- −$313
- Net cashflow
- $1
Break-even live
Sensitivity live
| Price | -10% $108 | -5% $54 | +0% $1 | +5% $-53 | +10% $-107 |
|---|---|---|---|---|---|
| Rent | -10% $-117 | -5% $-58 | +0% $1 | +5% $59 | +10% $118 |
| Rate | -1.0pp $96 | -0.5pp $49 | base $1 | +0.5pp $-49 | +1.0pp $-99 |
UW: 25.0% down · 7.5% · 30yr · 1.5% tax · 5.0% vac · 8.0% maint · 8.0% mgmt
Financing live
Cash to close
- Down payment
- $47,500
- Closing costs
- $5,700
- Reserves months
- —
- Total cash needed
- —
Loan-product check · same deal, 3 products live
Conventional
25% down · 7.5% · 30yr
- Down + closing
- —
- Monthly P&I
- —
- Monthly cashflow
- —
- DSCR
- —
- Eligible?
- —
Personal DTI + credit; lowest rate.
DSCR
20% down · 8.5% · 30yr
- Down + closing
- —
- Monthly P&I
- —
- Monthly cashflow
- —
- DSCR
- —
- Eligible?
- —
No personal income docs; deal must DSCR.
Hard money
10% down · 12.0% · 12mo
- Down + closing
- —
- Monthly P&I
- —
- Monthly cashflow
- —
- DSCR
- —
- Eligible?
- —
Short-term bridge; refi at stabilization.
Rent comps 1 comps
| Address | Beds | Baths | Sqft | Rent | $/sqft | DOM | Units | Dist |
|---|---|---|---|---|---|---|---|---|
| 424 Wayside Rd NE Rome, GA | 4.0 | 1.5 | 1452 | $1,500 | $1.03 | 45d | 1 | 1.41mi |
Listing history 5 events
-
2026-05-03$190,000 New 515-char remark
-
2026-04-30historical
-
2026-04-30historical
-
2026-03-25$182,000 New
-
2026-03-25$182,000 Active
ⓘ Source: listings_history table (triggers on properties + properties_extension) + one-shot
backfill from property_details.listing_events for pre-trigger history.
Tax reassessment forecast GA · Resets to sale price
- Current annual tax
- $1,194 · $100/mo
- Projected year-2 tax
- $1,748 · $146/mo
- Expected delta
- +$554/yr (+$46/mo · 46.3%)
ⓘ Screening estimate from a state-policy table — verify with the county assessor before closing.
Climate risk First Street
- Flood 1/10 Low FEMA zone X (unshaded) · 0% chance over 30 yrs
- Wildfire 4/10 Moderate
- Heat 6/10 Major 7 d/yr ≥105°F today · 18 d/yr by 30 yrs out
- Wind 4/10 Moderate 21% chance of damaging wind over 30 yrs
- Air quality 3/10 Moderate 3 unhealthy d/yr today · 4 by 30 yrs out
Nearby sold comps map
Loading sold comps map…
Walkable amenities ~0.75 mi
Loading nearby amenities…
Taxation est. · year 1
- Rental income
- $17,859
- − Mortgage interest
- −$10,643
- − Property taxes
- −$1,194
- − Insurance
- −$950
- − Repairs & maintenance
- −$1,429
- − Management
- −$1,429
- − Depreciation
- −$5,527
- Taxable loss
- −$3,313
- Est. tax savings @ 24.0%
- +$795
- After-tax cash flow
- $803/yr
For passive investors: Depreciation is non-cash, so a rental often shows a tax loss while cash-flowing — sheltering income. Rental losses are passive: they offset passive income freely, and up to $25,000/yr can offset ordinary (W-2) income if you actively participate and your MAGI is under $100k (phasing out to $0 by $150k); unused losses carry forward. On sale, claimed depreciation is recaptured at up to 25%, and gains may owe capital-gains tax (a 1031 exchange can defer both). Figures are a year-1 estimate at your 24.0% rate — not tax advice; consult a CPA.
Schools (NCES district)
- District
- Floyd County
- NCES district ID
- 1302190
- Math proficiency
- 41% ▼ -5.00%
- Reading proficiency
- 40% ▼ -4.00%
- Median HH income
- $47,083
- Composite
- 34.64/100
- National rank
- #5143
- State rank
- #45 of 174 in GA
Livability — Rome
- Score
- 64/100
- State rank
- #266
- US rank
- #14459
Category grades
Schools grade is shown separately in the Schools card above.
Census & demographics
- County
- Floyd County · 77,706 people
- City population
- 77,706
- Metro
- Rome, GA
- Population (ZIP)
- 34,705
- Household income
- $61,667
- Rent vs Own
- Severe rent burden
- 1104.0
Population outlook (Floyd County) Hauer SSP2
- Today (2025)
- 96,321 people
- By 2030
- 95,532 · -0.8%
- By 2040
- 93,332 · -3.1%
- By 2050
- 90,850 · -5.7%
- By 2075
- 84,989 · -11.8%
- By 2100
- 76,097 · -21.0%
Race, ethnicity, and origin ACS 2023
- Neighborhood character
- Predominantly White (68%)
- Race & ethnicity
- White 68% Black 20% Hispanic / Latino 7% Two or more races 6% Asian 1%
- Hispanic origin (detail)
- Mexican 2%
- Common ancestry
- Slovak 3% Serbian 2% Italian 2%
- Foreign-born
- 5% · Canada
- Languages at home
- 91% English-only · Spanish 5% Other Indo-European 1%
Political lean MEDSL · Floyd
- 2024 margin
- Solid R (+42.0) · D 28.8% · R 70.7%
- 2008→2024 swing
- -5.6pp toward R · 2008: -36.4pp · 2024: -42.0pp
- All cycles
- 2024: R+42.0 2020: R+41.1 2016: R+43.5 2012: R+39.9 2008: R+36.4
Not yet ingested
- Civics
- —
Market trends
- HPI YoY
- ▼ -186.06%
- Current HPI
- 257.8168
- Rent YoY
- ▲ 6.28%
- Metro
- Rome, GA
- State GDP YoY
- ▲ 2.66%
- F500 in state
- 28
Industry mix (Fortune 500 HQ in GA)
| Industry | F500 HQs | Revenue |
|---|---|---|
| Paper / Packaging | 2 | $29B |
|
||
| Retail | 1 | $160B |
|
||
| Transportation / Logistics | 1 | $91B |
|
||
| Airlines | 1 | $62B |
|
||
| Consumer Goods | 1 | $47B |
|
||
| Utilities | 1 | $25B |
|
||
Price history
+4.4% since first listed6 events — show timeline
- 2026-05-27 Listing Removed — GAMLS
- 2026-05-03 Listed $190,000 GAMLS
- 2026-04-30 Listing Removed — GAMLS
- 2026-04-30 Listing Removed — FMLS
- 2026-03-25 Listed $182,000 GAMLS
- 2026-03-25 Listed $182,000 FMLS
Property tax history
+15.6%/yrLatest (2025): $1,194 · +0.0% YoY. Source: county tax records.
Cash-flow waterfall
monthlySold comps — $/sqft
last 12 mo · ≤1 miLoading sold comps…