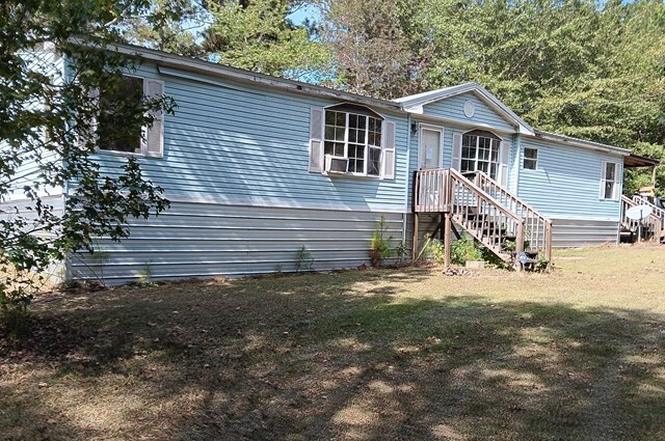
176 Pineland Estates Rd · Cochran, GA
Flood risk 9/10 · Severe
- FEMA flood zone
- X (unshaded)
- Chance of flooding over 30 yrs
- 0.99%
- Est. flood insurance / yr
- $507 – $1,088
Fire risk 7/10 · Major
- Est. fire insurance / yr
- $963 – $1,789
Heat risk 6/10 · Moderate
- Hot days now (above 108°F)
- 7 days/yr
- Hot days in 30 yrs
- 16 days/yr
Wind risk 8/10 · Major
- Chance of severe wind over 30 yrs
- 80.0%
Air-quality risk 2/10 · Minimal
- Unhealthy air days now
- 1 days/yr
- Unhealthy air days in 30 yrs
- 1 days/yr
Risk factors via First Street. Map © Google.
Why this score? — see what drove the B+ grade
The composite is a weighted blend of 9 inputs, each scored 0–100. Each bar is that input's sub-score; the figure is the points it added to the 100-point composite (weight × sub-score).
- Cash flow +30.0/30.0
- 1% rule +10.0/10.0
- DSCR +10.0/10.0
- Appreciation +10.0/10.0
- ARV discount +7.5/15.0
- Schools +3.8/10.0
- Livability +2.9/5.0
- Rent growth +2.5/5.0
- Condition / age +2.5/5.0
$64,900
🖨 Deal sheet (PDF) 📄 Offer letter ✓ Due diligence
Listing remarks
With a little sweat equity this home would be great for 1st time home buyers, someone downsizing or add it to your rental portfolio! 3 BR 2 FB with an open floor plan. There is a separate dining area and laundry room. The yard is 1 acre with several large shade trees. Make this one your own! Call today!
Key facts
- 1 acre lot
- Built 1991
- Listed 78 days
Neighborhood map
What this means for you Summary
Snapshot
- This is a 3-bed/2.0-bath manufactured listed at $65k.
Deal economics
- At list price, monthly cash flow is $631 ($8k/yr) — positive.
- The deal already cash-flows at list — no discount required.
- Meets the 1% rule at list price ($1k rent vs $65k).
- Recommended offer: $61k (6.0% below list) — sets the bar for market timing.
- Cap rate 19.2% vs local median 3.5% in Cochran — top-decile yield for the area; either an underpriced asset or a hidden risk that comps aren't pricing in. Stress-test before assuming the spread holds.
Location & tenants
- Location reads 57/100 on livability (#458 in GA) — a working-class tenant base; expect higher turnover. Strengths: cost of living A+, housing A; Watch: schools D-, amenities F, commute F.
- Bleckley County (rural): math 46% / reading 44% proficiency, ranked #28 of 174 in GA (top 16%) — families likely to look elsewhere, expect single-tenant / working-renter base with shorter leases.
- Market conditions: 64 active listings in the ZIP; 109 units permitted in Bleckley County in 2024 (45 in 5+ unit buildings).
Forward outlook
- In year one you build about $7k of equity ($449 loan paydown + $6k appreciation (10.0% local appreciation)).
- Bleckley County population projected at -11% by 2050 — secular population decline; favor cash flow + early exit over multi-decade hold.
- At projected returns (10.0% appreciation + 3.0% rent growth), your $18k cash investment doubles in ~2 years — after that, you're playing with house money.
- By year 5, paydown + projected appreciation supports a ~$32k cash-out refi (75% LTV) — recoverable capital for the next deal without selling this one.
Negotiation context
- It's been on market 78 days — a 6% lower offer ($61k) is reasonable based on typical stale-listing flexibility.
- 2 sale attempts; this cycle's ask has dropped $25k (28%) from the opening price — seller is motivated, your offer sets the floor, not the list.
Risks & watch-outs
- Watch-outs: flood insurance adds $66/mo.
- Climate carrying-cost: severe flood risk; severe wind risk, 80% chance of damaging wind over 30y; major wildfire risk; extreme-heat days projected 7→16/yr by 2055 (HVAC capex compounding) — expect insurance premiums to compound above CPI over the hold.
Questions for the listing agent
- It's been on market 78 days. Have you received any prior offers? Is the seller open to a 6% concession, seller financing, or rate buy-down credit?
- What's the actual annual flood-insurance premium (NFIP or private), and is the property in a SFHA with mandatory coverage?
- Why hasn't it sold? Are there any deal-killer items the seller is aware of (foundation, flood, title, zoning, code violations)?
- Is there a deadline driving the sale (1031 exchange, divorce, estate, relocation)? That informs how much negotiation room exists.
- Schools are D-rated, which usually means shorter tenancies and higher turnover. Who's the typical renter profile here, and what's been the actual vacancy rate?
- What's the average days-on-market for RENTAL listings here right now (not sales)? A rising rental-DOM trend means longer vacancies and softer asking-rent achievability than the comps imply.
- What's the recent tenant-quality profile in this submarket — average credit score on applications, eviction rate, late-payment / NSF rate, and stable-employment percentage? A property-management company in the area should have these aggregated.
- How much new for-sale + rental construction is in the pipeline within 1–3 miles? Heavy new supply typically softens prices + rents 12–24 months out; constrained supply supports both.
Investment metrics
- 1% rule
- 2.11% ✓
- Cap rate
- 19.19%
- Cash-on-cash
- 46.06%
- DSCR
- 3.05
- GRM
- 3.9
CMA / ARV
No comps found within radius.
Projected returns pro-forma
10.0% appreciation · 3.0% rent growth · sell at horizon
- IRR
- 56.6%
- Equity multiple
- 5.16×
- Total profit
- $75,556
- Equity at exit
- $58,467
- IRR
- 50.1%
- Equity multiple
- 11.51×
- Total profit
- $190,944
- Equity at exit
- $126,086
Cash invested: $18,172 (down + closing). Projections, not guarantees.
Landlord ↔ Tenant lean methodology
- Overall (STATE)
- 90 Strongly Landlord-Friendly
- State Georgia
- 90 Strongly Landlord-Friendly · R+3
- County
- — inherits STATE
- City
- — inherits STATE
ZIP-level market 31014
- Home prices YoY
- 19.6%
- Active inventory
- 64
- Price-to-rent
- 3.9×
Monthly cashflow live
- Estimated rent
- $1,371 medium interval (Pro) →
- Mortgage (P&I)
- −$340
- Tax from tax record
- −$18 /mo · $221/yr
- Insurance
- −$27
- Flood insurance flood zone
- −$66 /mo · $798/yr
- HOA
- −$0
- Vacancy / Maint / Mgmt
- −$288
- Net cashflow
- $631
Break-even live
Sensitivity live
| Price | -10% $668 | -5% $649 | +0% $631 | +5% $613 | +10% $594 |
|---|---|---|---|---|---|
| Rent | -10% $523 | -5% $577 | +0% $631 | +5% $685 | +10% $739 |
| Rate | -1.0pp $664 | -0.5pp $647 | base $631 | +0.5pp $614 | +1.0pp $597 |
UW: 25.0% down · 7.5% · 30yr · 1.5% tax · 5.0% vac · 8.0% maint · 8.0% mgmt
Financing live
Cash to close
- Down payment
- $16,225
- Closing costs
- $1,947
- Reserves months
- —
- Total cash needed
- —
Loan-product check · same deal, 3 products live
Conventional
25% down · 7.5% · 30yr
- Down + closing
- —
- Monthly P&I
- —
- Monthly cashflow
- —
- DSCR
- —
- Eligible?
- —
Personal DTI + credit; lowest rate.
DSCR
20% down · 8.5% · 30yr
- Down + closing
- —
- Monthly P&I
- —
- Monthly cashflow
- —
- DSCR
- —
- Eligible?
- —
No personal income docs; deal must DSCR.
Hard money
10% down · 12.0% · 12mo
- Down + closing
- —
- Monthly P&I
- —
- Monthly cashflow
- —
- DSCR
- —
- Eligible?
- —
Short-term bridge; refi at stabilization.
Listing history 7 events
-
2026-02-03status Under Contract
-
2026-01-29status Pending Offer Approval
-
2026-01-21price $64,900
-
2025-12-23status Back On Market
-
2025-12-22historical
-
2025-12-17price $74,900
-
2025-11-10$89,900 New
ⓘ Source: listings_history table (triggers on properties + properties_extension) + one-shot
backfill from property_details.listing_events for pre-trigger history.
Tax reassessment forecast GA · Resets to sale price
- Current annual tax
- $221 · $18/mo
- Projected year-2 tax
- $597 · $50/mo
- Expected delta
- +$376/yr (+$31/mo · 170.2%)
ⓘ Screening estimate from a state-policy table — verify with the county assessor before closing.
Climate risk First Street
- Flood 9/10 Extreme FEMA zone X (unshaded) · 99% chance over 30 yrs
- Wildfire 7/10 Severe
- Heat 6/10 Major 7 d/yr ≥108°F today · 16 d/yr by 30 yrs out
- Wind 8/10 Severe 80% chance of damaging wind over 30 yrs
- Air quality 2/10 Low 1 unhealthy d/yr today · 1 by 30 yrs out
Nearby sold comps map
Loading sold comps map…
Walkable amenities ~0.75 mi
Loading nearby amenities…
Taxation est. · year 1
- Rental income
- $16,454
- − Mortgage interest
- −$3,635
- − Property taxes
- −$221
- − Insurance
- −$1,122
- − Repairs & maintenance
- −$1,316
- − Management
- −$1,316
- − Depreciation
- −$1,888
- Taxable income
- $6,955
- Est. tax owed @ 24.0%
- −$1,669
- After-tax cash flow
- $5,902/yr
For passive investors: Depreciation is non-cash, so a rental often shows a tax loss while cash-flowing — sheltering income. Rental losses are passive: they offset passive income freely, and up to $25,000/yr can offset ordinary (W-2) income if you actively participate and your MAGI is under $100k (phasing out to $0 by $150k); unused losses carry forward. On sale, claimed depreciation is recaptured at up to 25%, and gains may owe capital-gains tax (a 1031 exchange can defer both). Figures are a year-1 estimate at your 24.0% rate — not tax advice; consult a CPA.
Schools (NCES district)
- District
- Bleckley County
- NCES district ID
- 1300440
- Math proficiency
- 46% ▼ -11.00%
- Reading proficiency
- 44% ▼ -5.00%
- Median HH income
- $38,695
- Composite
- 37.57/100
- National rank
- #4387
- State rank
- #28 of 174 in GA
Livability — Cochran
- Score
- 57/100
- State rank
- #458
- US rank
- #21752
Category grades
Schools grade is shown separately in the Schools card above.
Census & demographics
- Population (ZIP)
- 12,944
Population outlook (Bleckley County) Hauer SSP2
- Today (2025)
- 13,189 people
- By 2030
- 12,901 · -2.2%
- By 2040
- 12,398 · -6.0%
- By 2050
- 11,741 · -11.0%
- By 2075
- 10,444 · -20.8%
- By 2100
- 9,000 · -31.8%
Race, ethnicity, and origin ACS 2023
- Neighborhood character
- Majority White (62%)
- Race & ethnicity
- White 62% Black 33% Hispanic / Latino 3% Two or more races 2%
- Common ancestry
- Slovak 1% Italian 1%
- Foreign-born
- 1% · Canada, China
- Languages at home
- 98% English-only · Spanish 1%
Political lean MEDSL · Bleckley
- 2024 margin
- Solid R (+55.4) · D 22.1% · R 77.5%
- 2008→2024 swing
- -10.5pp toward R · 2008: -44.9pp · 2024: -55.4pp
- All cycles
- 2024: R+55.4 2020: R+52.9 2016: R+53.2 2012: R+47.3 2008: R+44.9
Not yet ingested
- Civics
- —
Market trends
- HPI YoY
- ▲ 38.18%
- Current HPI
- 232.753
- Rent YoY
- —
- Metro
- —
- State GDP YoY
- ▲ 2.66%
- F500 in state
- 28
Industry mix (Fortune 500 HQ in GA)
| Industry | F500 HQs | Revenue |
|---|---|---|
| Paper / Packaging | 2 | $29B |
|
||
| Retail | 1 | $160B |
|
||
| Transportation / Logistics | 1 | $91B |
|
||
| Airlines | 1 | $62B |
|
||
| Consumer Goods | 1 | $47B |
|
||
| Utilities | 1 | $25B |
|
||
Price history
-27.8% since first listed7 events — show timeline
- 2026-02-03 Pending — GAMLS
- 2026-01-29 Pending — GAMLS
- 2026-01-21 Price Changed $64,900 GAMLS
- 2025-12-23 Relisted — GAMLS
- 2025-12-22 Listing Removed — GAMLS
- 2025-12-17 Price Changed $74,900 GAMLS
- 2025-11-10 Listed $89,900 GAMLS
Property tax history
+0.9%/yrLatest (2025): $221 · -0.2% YoY. Source: county tax records.
Cash-flow waterfall
monthlySold comps — $/sqft
last 12 mo · ≤1 miLoading sold comps…