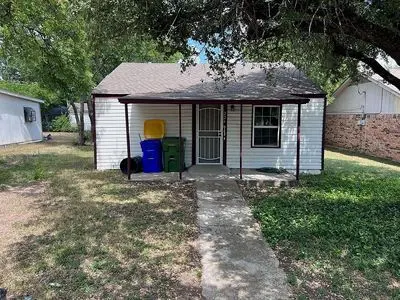
224 West Pl · White Settlement, TX
Flood risk 1/10 · Minimal
- FEMA flood zone
- X (unshaded)
- Chance of flooding over 30 yrs
- 0.0%
- Est. flood insurance / yr
- $507 – $1,088
Fire risk 4/10 · Minor
- Est. fire insurance / yr
- $1,222 – $2,270
Heat risk 7/10 · Major
- Hot days now (above 108°F)
- 7 days/yr
- Hot days in 30 yrs
- 23 days/yr
Wind risk 6/10 · Moderate
- Chance of severe wind over 30 yrs
- 27.0%
Air-quality risk 3/10 · Minor
- Unhealthy air days now
- 3 days/yr
- Unhealthy air days in 30 yrs
- 4 days/yr
Risk factors via First Street. Map © Google.
Why this score? — see what drove the C grade
The composite is a weighted blend of 9 inputs, each scored 0–100. Each bar is that input's sub-score; the figure is the points it added to the 100-point composite (weight × sub-score).
- Cash flow +19.3/30.0
- ARV discount +15.0/15.0
- DSCR +6.1/10.0
- 1% rule +6.0/10.0
- Livability +3.7/5.0
- Schools +3.5/10.0
- Rent growth +2.5/5.0
- Condition / age +2.5/5.0
- Appreciation +0.0/10.0
$99,500
🖨 Deal sheet 📄 Offer letter ✓ Due diligence
Listing remarks
Great opportunity in White Settlement, TX with strong upside. This 1 bedroom / 1 bathroom home at 224 West Pl has had some work already completed and is ready for a buyer to finish out and add value. Ideal for a rental property, first-time buyer looking to customize, or investor seeking a scrape-and-build opportunity & acirc; & euro; & rdquo; newer homes have been built in surrounding areas of the neighborhood. Convenient location with quick access to major roads, shopping, and employment centers. Property is being sold as-is and is priced accordingly. Asking $99,500 OBO and needing to sell quickly. Serious inquiries only. Direct message or contact seller for additional details.
Key facts
- Built 1975
Neighborhood map
What this means for you Summary
Snapshot
- This is a 1-bed/1.0-bath single-family listed at $100k.
Deal economics
- At list price, monthly cash flow is $109 ($1k/yr) — positive.
- The deal already cash-flows at list — no discount required.
- Meets the 1% rule at list price ($1k rent vs $100k).
- Cap rate 7.6% vs local median 4.6% in White Settlement — top-decile yield for the area; either an underpriced asset or a hidden risk that comps aren't pricing in. Stress-test before assuming the spread holds.
Location & tenants
- Location reads 74/100 on livability (#188 in TX, #4,855 nationally) — a middle-class / working-renter tenant base. Strengths: cost of living A+, housing A+, health & safety A+; Watch: schools D+, amenities D+, employment D+.
- White Settlement ISD (rural): math 35% / reading 44% proficiency, ranked #396 of 826 in TX (top 48%) — families likely to look elsewhere, expect single-tenant / working-renter base with shorter leases.
- Market conditions: Rents soft (-0.2%/yr); 548 active listings in the ZIP; 15 comparable units currently listed for rent nearby; rentals at typical pace (median 22d on market — plan ~3-4 weeks tenant-placement turnaround); 47% of comp listings sitting > 30 days — soft ceiling on asking rent; solid renter incomes; 18,938 units permitted in Tarrant County in 2024 (8,336 in 5+ unit buildings).
- This rent is only 16% of the median local income ($80k/yr) — well below the 30% rent-burden line; pricing power to push rent on renewal without tenant pushback.
Forward outlook
- Local home prices are declining (-3.0%/yr); year-one equity from $688 of loan paydown is wiped out by about $3k of value loss. Plan a longer hold.
- Tarrant County population projected at +41% by 2050 — long-run rental-demand tailwind backs the buy-and-hold thesis.
Negotiation context
- Only 0 days on market — expect competitive offers; lowballing is unlikely to land.
Risks & watch-outs
- Climate carrying-cost: major wind risk, 27% chance of damaging wind over 30y; extreme-heat days projected 7→23/yr by 2055 (HVAC capex compounding) — expect insurance premiums to compound above CPI over the hold.
Questions for the listing agent
- Built in 1975 — when were the roof, HVAC, electrical panel, plumbing, and water heater last replaced?
- Is there a deadline driving the sale (1031 exchange, divorce, estate, relocation)? That informs how much negotiation room exists.
- Schools are D-rated, which usually means shorter tenancies and higher turnover. Who's the typical renter profile here, and what's been the actual vacancy rate?
- What's the average days-on-market for RENTAL listings here right now (not sales)? A rising rental-DOM trend means longer vacancies and softer asking-rent achievability than the comps imply.
- What's the recent tenant-quality profile in this submarket — average credit score on applications, eviction rate, late-payment / NSF rate, and stable-employment percentage? A property-management company in the area should have these aggregated.
- How much new for-sale + rental construction is in the pipeline within 1–3 miles? Heavy new supply typically softens prices + rents 12–24 months out; constrained supply supports both.
Investment metrics
- 1% rule
- 1.10% ✓
- Cap rate
- 7.61%
- Cash-on-cash
- 4.71%
- DSCR
- 1.21
- GRM
- 7.6
CMA / ARV
- ARV (on-the-fly)
- $159,000
- Comps found
- 6
Show comp detail 6 sales within ~0.75 mi
| Address | Dist | Beds/Ba | Sqft | Sold | Price | $/sf | Match |
|---|---|---|---|---|---|---|---|
| 8612 Jay St | 0.25mi | 2/1.0 (+1) | 576 (-9%) | 0mo | $129,900 | $226 | 67 |
| 309 Lockwood | 0.14mi | 2/1.0 (+1) | 720 (+13%) | 9mo | $150,000 | $208 | 59 |
| 9112 Rowland Dr | 0.61mi | 2/1.0 (+1) | 664 (+4%) | 14mo | $179,900 | $271 | 48 |
| 9132 N Dodson Dr | 0.71mi | 2/1.0 (+1) | 624 (-2%) | 17mo | $139,800 | $224 | 45 |
| 412 Sands Ct | 0.70mi | 2/1.0 (+1) | 695 (+9%) | 8mo | $173,500 | $250 | 40 |
| 8000 Melrose St E | 0.61mi | 2/1.0 (+1) | 672 (+6%) | 23mo | $220,000 | $327 | 38 |
Match score weights: distance 35% · size 25% · config 20% · recency 20%. Top-matched comps best support the ARV.
Projected returns pro-forma
-3.0% appreciation · 0.0% rent growth · sell at horizon
- IRR
- -12.6%
- Equity multiple
- 0.56×
- Total profit
- $-12,312
- Equity at exit
- $14,836
- IRR
- -9.5%
- Equity multiple
- 0.50×
- Total profit
- $-13,937
- Equity at exit
- $8,603
Cash invested: $27,860 (down + closing). Projections, not guarantees.
Landlord ↔ Tenant lean methodology
- Overall (STATE)
- 87 Strongly Landlord-Friendly
- State Texas
- 87 Strongly Landlord-Friendly · R+5
- County
- — inherits STATE
- City
- — inherits STATE
ZIP-level market 76108
- Home prices YoY
- -32.5%
- Rents YoY
- -0.2%
- Active inventory
- 548
- Price-to-rent
- 7.6×
Monthly cashflow live
- Estimated rent
- $1,098 high interval (Pro) →
- Mortgage (P&I)
- −$522
- Tax from tax record
- −$195 /mo · $2,334/yr
- Insurance
- −$41
- HOA
- −$0
- Vacancy / Maint / Mgmt
- −$231
- Net cashflow
- $109
Break-even live
UW: 25.0% down · 7.5% · 30yr · 1.5% tax · 5.0% vac · 8.0% maint · 8.0% mgmt
Financing live
Cash to close
- Down payment
- $24,875
- Closing costs
- $2,985
- Reserves months
- —
- Total cash needed
- —
Loan-product check · same deal, 3 products live
Conventional
25% down · 7.5% · 30yr
- Down + closing
- —
- Monthly P&I
- —
- Monthly cashflow
- —
- DSCR
- —
- Eligible?
- —
Personal DTI + credit; lowest rate.
DSCR
20% down · 8.5% · 30yr
- Down + closing
- —
- Monthly P&I
- —
- Monthly cashflow
- —
- DSCR
- —
- Eligible?
- —
No personal income docs; deal must DSCR.
Hard money
10% down · 12.0% · 12mo
- Down + closing
- —
- Monthly P&I
- —
- Monthly cashflow
- —
- DSCR
- —
- Eligible?
- —
Short-term bridge; refi at stabilization.
Rent comps 15 comps
| Address | Beds | Baths | Sqft | Rent | $/sqft | DOM | Units | Dist |
|---|---|---|---|---|---|---|---|---|
| 9021 White Settlement Rd Unit D White Settlement, TX | 1.0 | 1.0 | 440 | $950 | $2.16 | 22d | 1 | 0.44mi |
| 9021 White Settlement Rd Unit C White Settlement, TX | 1.0 | 1.0 | 462 | $995 | $2.15 | 22d | 1 | 0.44mi |
| 300 Meadow Park Dr White Settlement, TX | 2.0 | 1.0 | 616 | $1,100 | $1.79 | 19d | 1 | 0.45mi |
| 400 Ralph St Fort Worth, TX | 1.0 | 1.0 | 625 | $1,225 | $1.96 | 44d | 1 | 0.64mi |
| 9020 Moran St Fort Worth, TX | 2.0 | 1.0 | 650 | $1,225 | $1.88 | 44d | 1 | 0.66mi |
| 9211 Dale Lane Ct Fort Worth, TX | 1.0–2.0 | 1.0–2.0 | 719 | $850 | $1.18 | 44d | 1 | 0.93mi |
| 704 Dale Ln Unit 725 White Settlement, TX | 1.0 | 1.0 | 650 | $905 | $1.39 | 13d | 1 | 1.04mi |
| 704 Dale Ln Unit 778 White Settlement, TX | 1.0 | 1.0 | 650 | $900 | $1.38 | 44d | 1 | 1.04mi |
| 704 Dale Ln Unit 725 White Settlement, TX | 1.0 | 1.0 | 650 | $867 | $1.33 | 3d | 1 | 1.04mi |
| 704 Dale Ln Fort Worth, TX | 1.0 | 1.0 | 650 | $859 | $1.32 | 13d | 1 | 1.07mi |
| 1300 N Jim Wright Fwy White Settlement, TX | 1.0 | 1.0 | 650 | $959 | $1.48 | 15d | 1 | 1.23mi |
| 1300 Jim Wright Fwy Unit 1374 White Settlement, TX | 1.0 | 1.0 | 740 | $1,082 | $1.46 | 3d | 1 | 1.25mi |
| 1300 Jim Wright Fwy Unit 1351 White Settlement, TX | 1.0 | 1.0 | 650 | $914 | $1.41 | 44d | 1 | 1.25mi |
| 1823 S Las Vegas Trl Unit 1 White Settlement, TX | 1.0 | 1.0 | 731 | $965 | $1.32 | 44d | 1 | 1.38mi |
| 1808 S Las Vegas Trl Fort Worth, TX | 1.0 | 1.0 | 731 | $965 | $1.32 | 44d | 1 | 1.43mi |
Listing history 2 events
-
2026-06-10remarks 687-char remark
-
2026-06-10$99,500 Under Contract
ⓘ Source: listings_history table (triggers on properties + properties_extension) + one-shot
backfill from property_details.listing_events for pre-trigger history.
Tax reassessment forecast TX · Resets to sale price
- Current annual tax
- $2,334 · $195/mo
- Projected year-2 tax
- $2,334 · $195/mo
- Expected delta
- $0/yr ($0/mo · 0.0%)
ⓘ Screening estimate from a state-policy table — verify with the county assessor before closing.
Climate risk First Street
- Flood 1/10 Low FEMA zone X (unshaded) · 0% chance over 30 yrs
- Wildfire 4/10 Moderate
- Heat 7/10 Severe 7 d/yr ≥108°F today · 23 d/yr by 30 yrs out
- Wind 6/10 Major 27% chance of damaging wind over 30 yrs
- Air quality 3/10 Moderate 3 unhealthy d/yr today · 4 by 30 yrs out
Nearby sold comps map
Loading sold comps map…
Walkable amenities ~0.75 mi
Loading nearby amenities…
Taxation est. · year 1
- Rental income
- $13,173
- − Mortgage interest
- −$5,574
- − Property taxes
- −$2,334
- − Insurance
- −$498
- − Repairs & maintenance
- −$1,054
- − Management
- −$1,054
- − Depreciation
- −$2,895
- Taxable loss
- −$235
- Est. tax savings @ 24.0%
- +$56
- After-tax cash flow
- $1,369/yr
For passive investors: Depreciation is non-cash, so a rental often shows a tax loss while cash-flowing — sheltering income. Rental losses are passive: they offset passive income freely, and up to $25,000/yr can offset ordinary (W-2) income if you actively participate and your MAGI is under $100k (phasing out to $0 by $150k); unused losses carry forward. On sale, claimed depreciation is recaptured at up to 25%, and gains may owe capital-gains tax (a 1031 exchange can defer both). Figures are a year-1 estimate at your 24.0% rate — not tax advice; consult a CPA.
Schools (NCES district)
- District
- White Settlement ISD
- NCES district ID
- 4845540
- Math proficiency
- 35% ▼ -10.00%
- Reading proficiency
- 44% ▼ -4.00%
- Median HH income
- $56,055
- Composite
- 34.63/100
- National rank
- #5151
- State rank
- #396 of 826 in TX
Livability — White Settlement
- Score
- 74/100
- State rank
- #188
- US rank
- #4855
Category grades
Schools grade is shown separately in the Schools card above.
Census & demographics
- Census place
- White Settlement, TX
- County
- Tarrant County · 2,033,669 people
- Metro
- Dallas-Fort Worth-Arlington, TX
- Population (ZIP)
- 45,537
- Household income
- $80,412
- Rent vs Own
- Severe rent burden
- 774.0
Population outlook (Tarrant County) Hauer SSP2
- Today (2025)
- 2,380,417 people
- By 2030
- 2,578,900 · +8.3%
- By 2040
- 2,974,995 · +25.0%
- By 2050
- 3,350,489 · +40.8%
- By 2075
- 4,216,909 · +77.2%
- By 2100
- 4,741,527 · +99.2%
Race, ethnicity, and origin ACS 2023
- Neighborhood character
- Diverse neighborhood (Simpson 0.62)
- Race & ethnicity
- White 52% Hispanic / Latino 32% Two or more races 17% Black 8% Asian 3% Native American 1%
- Hispanic origin (detail)
- Mexican 26% Puerto Rican 1%
- Common ancestry
- Slovak 2% Lithuanian 1% Romanian 1%
- Foreign-born
- 11% · Canada, Vietnam
- Languages at home
- 76% English-only · Spanish 21% Vietnamese 1% Tagalog/Filipino 1%
Political lean MEDSL · Tarrant
- 2024 margin
- Lean R (+5.1) · D 46.7% · R 51.9% · Other 1.4%
- 2008→2024 swing
- +6.6pp toward D · 2008: -11.7pp · 2024: -5.1pp
- All cycles
- 2024: R+5.1 2020: D+0.2 2016: R+8.7 2012: R+15.7 2008: R+11.7
Not yet ingested
- Civics
- —
Market trends
- HPI YoY
- ▼ -141.39%
- Current HPI
- 294.2459
- Rent YoY
- ▼ -0.18%
- Metro
- Dallas-Fort Worth-Arlington, TX
- State GDP YoY
- ▲ 3.95%
- F500 in state
- 110
Industry mix (Fortune 500 HQ in TX)
| Industry | F500 HQs | Revenue |
|---|---|---|
| Energy | 16 | $1,198B |
|
||
| Technology | 5 | $198B |
|
||
| Engineering / Construction | 4 | $72B |
|
||
| Energy Services | 3 | $60B |
|
||
| Utilities | 3 | $41B |
|
||
| Healthcare | 2 | $330B |
|
||
Price history
4 events — show timeline
- 2026-06-09 Listed $99,500 FSBO.com
- 2026-04-13 Sold (Public Records) — Public Records
- 2023-06-02 Sold (Public Records) — Public Records
- 2004-05-12 Sold (Public Records) — Public Records
Property tax history
+7.0%/yrLatest (2025): $2,334 · -18.3% YoY. Source: county tax records.
Cash-flow waterfall
monthlySold comps — $/sqft
last 12 mo · ≤1 miLoading sold comps…