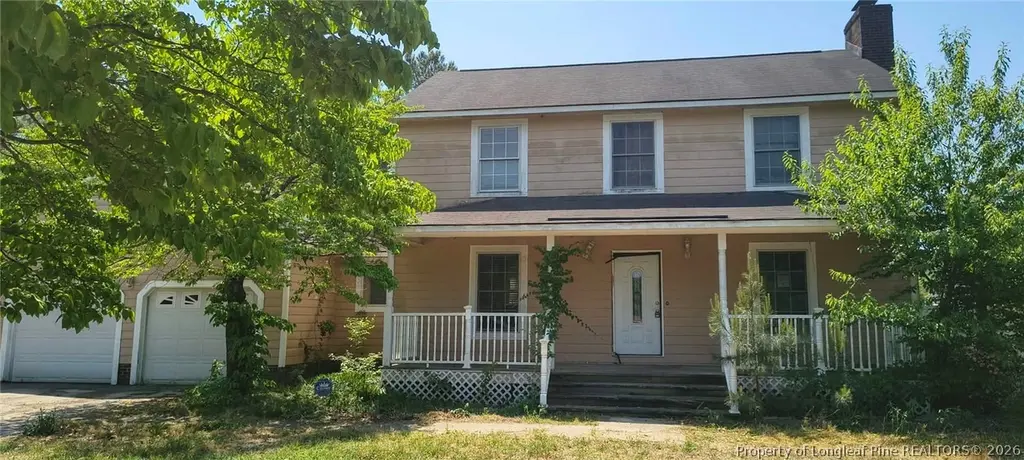
6318 Stoney Point Loop · Hope Mills, NC
Flood risk 1/10 · Minimal
- FEMA flood zone
- X (unshaded)
- Chance of flooding over 30 yrs
- 0.0%
- Est. flood insurance / yr
- $507 – $1,088
Fire risk 6/10 · Moderate
- Est. fire insurance / yr
- $906 – $1,684
Heat risk 7/10 · Major
- Hot days now (above 106°F)
- 7 days/yr
- Hot days in 30 yrs
- 16 days/yr
Wind risk 7/10 · Major
- Chance of severe wind over 30 yrs
- 78.0%
Air-quality risk 1/10 · Minimal
- Unhealthy air days now
- 0 days/yr
- Unhealthy air days in 30 yrs
- 0 days/yr
Risk factors via First Street. Map © Google.
Why this score? — see what drove the B- grade
The composite is a weighted blend of 9 inputs, each scored 0–100. Each bar is that input's sub-score; the figure is the points it added to the 100-point composite (weight × sub-score).
- Cash flow +25.0/30.0
- ARV discount +15.0/15.0
- DSCR +8.2/10.0
- 1% rule +6.3/10.0
- Livability +3.4/5.0
- Schools +3.1/10.0
- Rent growth +2.7/5.0
- Condition / age +2.5/5.0
- Appreciation +0.0/10.0
$170,877
🖨 Deal sheet 📄 Offer letter ✓ Due diligence
Listing remarks MLS
-Amazing home! Hardwood floor throughout, Corrian counters, remodeled kitchen, new pella windows, spacious laundry room, formal dining, large inground pool, new HVAC, fenced in yard, wood burning fireplace,ss appliances, recessed light and crown molding -Amazing home! Hardwood floor throughout, Corrian counters, remodeled kitchen, new pella windows, laundry room, formal dining, lrg inground pool, new HVAC, fenced yard, wood burning fireplace,ss appliances, recessed light and crown molding
Key facts
- In-ground pool
- 4 garage spots
- Pool
Tags
Property features AI
Finance
- Other: Located in the STONEY PT subdivision
Exterior
- Parking: Attached garage; Detached garage; Garage with door opener; 4 covered parking spaces; 4 garage spaces; Has carport
- Utilities: Public water; Public sewer
- Home design: Single-family residence; Two stories
- Construction: Masonite exterior
- Exterior features: In-ground pool; Cleared, level lot; Lot is cleared and level
Interior
- Kitchen: Built-in electric oven; Built-in electric range; Downdraft; Microwave
- Bedrooms: 7 total rooms (includes all bedrooms and living spaces)
- Flooring: Laminate flooring; Tile flooring
- Bathrooms: 2 full bathrooms; 1 half bathroom
- Heating & cooling: Heat pump heating
- Interior features: Eat-in kitchen; Living room fireplace
Neighborhood map
What this means for you Summary
Snapshot
- This is a 3-bed/3.0-bath single-family listed at $171k.
Deal economics
- At list price, monthly cash flow is $374 ($4k/yr) — positive.
- The deal already cash-flows at list — no discount required.
- Meets the 1% rule at list price ($2k rent vs $171k).
- Recommended offer: $168k (1.5% below list) — sets the bar for market timing.
- Cap rate 8.9% vs local median 4.8% in Hope Mills — top-decile yield for the area; either an underpriced asset or a hidden risk that comps aren't pricing in. Stress-test before assuming the spread holds.
Location & tenants
- Location reads 67/100 on livability (#234 in NC) — a middle-class / working-renter tenant base. Strengths: cost of living A+, housing A+, health & safety B+; Watch: crime D-, amenities F, commute F.
- Cumberland County Schools (urban): math 32% / reading 41% proficiency, ranked #126 of 178 in NC (top 71%) — families likely to look elsewhere, expect single-tenant / working-renter base with shorter leases.
- Zoned schools: John R Griffin Middle (math 43% / reading 53%, grade C-, #134 of 475 statewide, top 29%, 1,091 students, 40% FRL); Jack Britt High (math 58% / reading 72%, grade B, #161 of 535 statewide, top 30%, 1,890 students, 38% FRL) — zoned schools average 39% FRL vs 55% district-wide (16 pts lower); this property's tenant base skews higher-income than the district average.
- Zoned-school proficiency averages 56% at this address vs 36% district-wide (+20 pts) — the actual schools serving this property are materially stronger than the Cumberland County Schools average implies; a family-tenant draw the district grade alone would hide.
- Market conditions: Rents flat; 401 active listings in the ZIP; 12 comparable units currently listed for rent nearby; rentals leasing fast (median 14d on market — plan ~1-2 weeks tenant-placement turnaround); 1,125 units permitted in Cumberland County in 2024 (104 in 5+ unit buildings).
- This rent runs 34% of the median local income ($68k/yr) — at the standard rent-burdened threshold; future hikes will face affordability resistance.
Forward outlook
- Local home prices are declining (-3.0%/yr); year-one equity from $1k of loan paydown is wiped out by about $5k of value loss. Plan a longer hold.
Negotiation context
- It's been on market 15 days — a 2% lower offer ($168k) is reasonable based on typical stale-listing flexibility.
- 2 sale attempts since 17y ago; this cycle's ask has dropped $9k (5%) from the opening price — seller is motivated, your offer sets the floor, not the list.
Risks & watch-outs
- Climate carrying-cost: major wind risk, 78% chance of damaging wind over 30y; major wildfire risk; extreme-heat days projected 7→16/yr by 2055 (HVAC capex compounding) — expect insurance premiums to compound above CPI over the hold.
Questions for the listing agent
- Built in 1979 — when were the roof, HVAC, electrical panel, plumbing, and water heater last replaced?
- Is there a deadline driving the sale (1031 exchange, divorce, estate, relocation)? That informs how much negotiation room exists.
- Schools are D-rated, which usually means shorter tenancies and higher turnover. Who's the typical renter profile here, and what's been the actual vacancy rate?
- Crime grade is D in this area — have there been break-ins, vandalism, or insurance claims at this property in the last 3 years? What carrier currently insures it and at what premium?
- What's the average days-on-market for RENTAL listings here right now (not sales)? A rising rental-DOM trend means longer vacancies and softer asking-rent achievability than the comps imply.
- What's the recent tenant-quality profile in this submarket — average credit score on applications, eviction rate, late-payment / NSF rate, and stable-employment percentage? A property-management company in the area should have these aggregated.
- How much new for-sale + rental construction is in the pipeline within 1–3 miles? Heavy new supply typically softens prices + rents 12–24 months out; constrained supply supports both.
Investment metrics
- 1% rule
- 1.13% ✓
- Cap rate
- 8.92%
- Cash-on-cash
- 9.37%
- DSCR
- 1.42
- GRM
- 7.4
CMA / ARV
- ARV (on-the-fly)
- $260,224
- Comps found
- 12
Show comp detail 12 sales within ~0.75 mi
| Address | Dist | Beds/Ba | Sqft | Sold | Price | $/sf | Match |
|---|---|---|---|---|---|---|---|
| 6324 Stoney Point Loop | 0.06mi | 3/2.0 | 1,627 (-5%) | 2mo | $165,000 | $101 | 83 |
| 6229 Stoney Point Loop | 0.21mi | 3/2.0 | 1,649 (-4%) | 4mo | $250,000 | $152 | 77 |
| 6261 Stoney Point Loop | 0.29mi | 3/2.5 | 1,802 (+5%) | 5mo | $235,000 | $130 | 72 |
| 6204 Maple Leaf Ct | 0.24mi | 3/2.5 | 1,746 (+2%) | 18mo | $249,900 | $143 | 69 |
| 6236 Stoney Point Loop | 0.26mi | 3/2.5 | 1,814 (+6%) | 11mo | $263,000 | $145 | 66 |
| 3217 Rouse Dr | 0.24mi | 3/2.5 | 1,510 (-12%) | 2mo | $245,000 | $162 | 66 |
| 6224 Stoney Point Loop | 0.23mi | 3/2.0 | 1,616 (-6%) | 13mo | $245,000 | $152 | 65 |
| 3005 Thornhill Rd | 0.18mi | 4/2.5 (+1) | 1,870 (+9%) | 10mo | $285,000 | $152 | 61 |
| 3402 Wipperwill Dr | 0.48mi | 3/2.0 | 1,652 (-4%) | 10mo | $255,000 | $154 | 60 |
| 6237 Stoney Point Loop | 0.23mi | 3/2.0 | 1,562 (-9%) | 18mo | $245,000 | $157 | 56 |
| 6714 Camden Rd | 0.49mi | 3/1.5 | 1,661 (-3%) | 13mo | $205,000 | $123 | 55 |
| 6263 Stoney Point Loop | 0.28mi | 3/2.0 | 1,469 (-14%) | 11mo | $255,000 | $174 | 50 |
Match score weights: distance 35% · size 25% · config 20% · recency 20%. Top-matched comps best support the ARV.
Projected returns pro-forma
-3.0% appreciation · 0.9% rent growth · sell at horizon
- IRR
- -4.5%
- Equity multiple
- 0.84×
- Total profit
- $-7,865
- Equity at exit
- $25,478
- IRR
- 2.6%
- Equity multiple
- 1.17×
- Total profit
- $8,146
- Equity at exit
- $14,774
Cash invested: $47,846 (down + closing). Projections, not guarantees.
Landlord ↔ Tenant lean methodology
- Overall (STATE)
- 85 Strongly Landlord-Friendly
- State North Carolina
- 85 Strongly Landlord-Friendly · R+3
- County
- — inherits STATE
- City
- — inherits STATE
ZIP-level market 28306
- Home prices YoY
- -17.7%
- Rents YoY
- 0.9%
- Active inventory
- 401
- Price-to-rent
- 7.4×
Monthly cashflow live
- Estimated rent
- $1,928 high interval (Pro) →
- Mortgage (P&I)
- −$896
- Tax from tax record
- −$182 /mo · $2,184/yr
- Insurance
- −$71
- HOA
- −$0
- Vacancy / Maint / Mgmt
- −$405
- Net cashflow
- $374
Break-even live
UW: 25.0% down · 7.5% · 30yr · 1.5% tax · 5.0% vac · 8.0% maint · 8.0% mgmt
Financing live
Cash to close
- Down payment
- $42,719
- Closing costs
- $5,126
- Reserves months
- —
- Total cash needed
- —
Loan-product check · same deal, 3 products live
Conventional
25% down · 7.5% · 30yr
- Down + closing
- —
- Monthly P&I
- —
- Monthly cashflow
- —
- DSCR
- —
- Eligible?
- —
Personal DTI + credit; lowest rate.
DSCR
20% down · 8.5% · 30yr
- Down + closing
- —
- Monthly P&I
- —
- Monthly cashflow
- —
- DSCR
- —
- Eligible?
- —
No personal income docs; deal must DSCR.
Hard money
10% down · 12.0% · 12mo
- Down + closing
- —
- Monthly P&I
- —
- Monthly cashflow
- —
- DSCR
- —
- Eligible?
- —
Short-term bridge; refi at stabilization.
Rent comps 12 comps
| Address | Beds | Baths | Sqft | Rent | $/sqft | DOM | Units | Dist |
|---|---|---|---|---|---|---|---|---|
| 6258 Stoney Point Loop Fayetteville, NC | 3.0 | 2.5 | 1799 | $2,300 | $1.28 | 13d | 1 | 0.33mi |
| 3462 Marty Cir Hope Mills, NC | 3.0 | 2.0 | 1120 | $1,250 | $1.12 | 23d | 1 | 0.62mi |
| 3511 Birchfield Ct Fayetteville, NC | 2.0–3.0 | 2.0 | 1270 | $1,685 | $1.33 | 13d | 5 | 0.78mi |
| 5959 Rehoboth Rd Hope Mills, NC | 3.0 | 2.0 | 1667 | $1,795 | $1.08 | 13d | 1 | 1.00mi |
| 3011 Wetherby Ct Fayetteville, NC | 2.0 | 2.0 | 1601 | $1,800 | $1.12 | 13d | 1 | 1.05mi |
| 2935 Chillingworth Dr Fayetteville, NC | 3.0 | 2.0 | 1403 | $1,750 | $1.25 | 13d | 1 | 1.21mi |
| 3541 Rittenour Dr Hope Mills, NC | 3.0 | 2.0 | 1552 | $1,825 | $1.18 | 13d | 1 | 1.26mi |
| 3831 Queen Anne Loop Fayetteville, NC | 2.0–3.0 | 2.0 | 1274 | $1,743 | $1.37 | 13d | 7 | 1.27mi |
| 2900 Brookcrossing Dr Fayetteville, NC | 3.0 | 3.0 | 1894 | $2,000 | $1.06 | 13d | 1 | 1.29mi |
| 4032 Newgate St Fayetteville, NC | 4.0 | 2.5 | 2209 | $2,750 | $1.24 | 23d | 1 | 1.31mi |
| 3506 Shipstone Pl Hope Mills, NC | 2.0 | 2.0 | 1280 | $1,380 | $1.08 | 13d | 3 | 1.31mi |
| 2920 Cosmo Dr Fayetteville, NC | 1.0–3.0 | 1.0–2.0 | 918 | $1,505 | $1.64 | 13d | 9 | 1.48mi |
Listing history 10 events
-
2026-05-15price $162,750
-
2026-05-11status Pending
-
2026-05-08price $170,877
-
2026-04-24$180,000 Active
-
2009-08-27soldstatus $163,500
-
2009-08-24soldstatus $163,500 493-char remark
Show marketing remark (493 chars)
-Amazing home! Hardwood floor throughout, Corrian counters, remodeled kitchen, new pella windows, spacious laundry room, formal dining, large inground pool, new HVAC, fenced in yard, wood burning fireplace,ss appliances, recessed light and crown molding -Amazing home! Hardwood floor throughout, Corrian counters, remodeled kitchen, new pella windows, laundry room, formal dining, lrg inground pool, new HVAC, fenced yard, wood burning fireplace,ss appliances, recessed light and crown molding
-
2009-07-04$165,900 493-char remark
Show marketing remark (493 chars)
-Amazing home! Hardwood floor throughout, Corrian counters, remodeled kitchen, new pella windows, spacious laundry room, formal dining, large inground pool, new HVAC, fenced in yard, wood burning fireplace,ss appliances, recessed light and crown molding -Amazing home! Hardwood floor throughout, Corrian counters, remodeled kitchen, new pella windows, laundry room, formal dining, lrg inground pool, new HVAC, fenced yard, wood burning fireplace,ss appliances, recessed light and crown molding
-
2003-10-03soldstatus $92,000
-
1992-09-11soldstatus $65,500
-
1988-09-01soldstatus $73,750
ⓘ Source: listings_history table (triggers on properties + properties_extension) + one-shot
backfill from property_details.listing_events for pre-trigger history.
Tax reassessment forecast NC · Resets to sale price
- Current annual tax
- $2,184 · $182/mo
- Projected year-2 tax
- $2,184 · $182/mo
- Expected delta
- $0/yr ($0/mo · 0.0%)
ⓘ Screening estimate from a state-policy table — verify with the county assessor before closing.
Climate risk First Street
- Flood 1/10 Low FEMA zone X (unshaded) · 0% chance over 30 yrs
- Wildfire 6/10 Major
- Heat 7/10 Severe 7 d/yr ≥106°F today · 16 d/yr by 30 yrs out
- Wind 7/10 Severe 78% chance of damaging wind over 30 yrs
- Air quality 1/10 Low 0 unhealthy d/yr today · 0 by 30 yrs out
Nearby sold comps map
Loading sold comps map…
Walkable amenities ~0.75 mi
Loading nearby amenities…
Taxation est. · year 1
- Rental income
- $23,135
- − Mortgage interest
- −$9,572
- − Property taxes
- −$2,184
- − Insurance
- −$854
- − Repairs & maintenance
- −$1,851
- − Management
- −$1,851
- − Depreciation
- −$4,971
- Taxable income
- $1,852
- Est. tax owed @ 24.0%
- −$445
- After-tax cash flow
- $4,041/yr
For passive investors: Depreciation is non-cash, so a rental often shows a tax loss while cash-flowing — sheltering income. Rental losses are passive: they offset passive income freely, and up to $25,000/yr can offset ordinary (W-2) income if you actively participate and your MAGI is under $100k (phasing out to $0 by $150k); unused losses carry forward. On sale, claimed depreciation is recaptured at up to 25%, and gains may owe capital-gains tax (a 1031 exchange can defer both). Figures are a year-1 estimate at your 24.0% rate — not tax advice; consult a CPA.
Schools (NCES district)
- District
- Cumberland County Schools
- NCES district ID
- 3700011
- Math proficiency
- 32% ▼ -2.00%
- Reading proficiency
- 41% ▼ -1.00%
- Median HH income
- $44,168
- Composite
- 31.0/100
- National rank
- #6096
- State rank
- #126 of 178 in NC
Livability — Hope Mills
- Score
- 67/100
- State rank
- #234
- US rank
- #10761
Category grades
Schools grade is shown separately in the Schools card above.
Census & demographics
- County
- Cumberland County · 265,314 people
- City population
- 39,196
- Metro
- Fayetteville, NC
- Population (ZIP)
- 43,042
- Household income
- $67,544
- Rent vs Own
- Severe rent burden
- 1386.0
Population outlook (Cumberland County) Hauer SSP2
- Today (2025)
- 330,855 people
- By 2030
- 333,523 · +0.8%
- By 2040
- 335,583 · +1.4%
- By 2050
- 335,325 · +1.4%
- By 2075
- 342,853 · +3.6%
- By 2100
- 340,698 · +3.0%
Race, ethnicity, and origin ACS 2023
- Neighborhood character
- Diverse neighborhood (Simpson 0.68)
- Race & ethnicity
- White 44% Black 33% Hispanic / Latino 13% Two or more races 8% Asian 4% Native American 2%
- Hispanic origin (detail)
- Mexican 5% Puerto Rican 5%
- Common ancestry
- Italian 2% Slovak 1% Serbian 1%
- Foreign-born
- 8% · Canada, South Korea, Jamaica
- Languages at home
- 87% English-only · Spanish 9% Other Indo-European 1% French/Haitian/Cajun 1%
Political lean MEDSL · Cumberland
- 2024 margin
- D (+13.4) · D 56.1% · R 42.7% · Other 1.2%
- 2008→2024 swing
- -4.3pp toward R · 2008: 17.7pp · 2024: 13.4pp
- All cycles
- 2024: D+13.4 2020: D+16.6 2016: D+16.0 2012: D+19.7 2008: D+17.7
Not yet ingested
- Civics
- —
Market trends
- HPI YoY
- ▼ -51.69%
- Current HPI
- 239.7281
- Rent YoY
- ▲ 0.90%
- Metro
- Fayetteville, NC
- State GDP YoY
- ▲ 3.28%
- F500 in state
- 26
Industry mix (Fortune 500 HQ in NC)
| Industry | F500 HQs | Revenue |
|---|---|---|
| Financial Services | 2 | $213B |
|
||
| Retail | 2 | $95B |
|
||
| Industrial Conglomerate | 1 | $38B |
|
||
| Metals / Steel | 1 | $35B |
|
||
| Utilities | 1 | $30B |
|
||
| Industrial Machinery | 1 | $19B |
|
||
Price history
+120.7% since first listed10 events — show timeline
- 2026-05-15 Price Changed $162,750 LPRMLS
- 2026-05-11 Pending — LPRMLS
- 2026-05-08 Price Changed $170,877 LPRMLS
- 2026-04-24 Listed $180,000 LPRMLS
- 2009-08-27 Sold (Public Records) $163,500 Public Records
- 2009-08-24 Sold (MLS) $163,500 TMLS
- 2009-07-04 Listed $165,900 TMLS
- 2003-10-03 Sold (Public Records) $92,000 Public Records
- 1992-09-11 Sold (Public Records) $65,500 Public Records
- 1988-09-01 Sold (Public Records) $73,750 Public Records
Property tax history
+4.4%/yrLatest (2025): $2,184 · +30.6% YoY. Source: county tax records.
Cash-flow waterfall
monthlySold comps — $/sqft
last 12 mo · ≤1 miLoading sold comps…