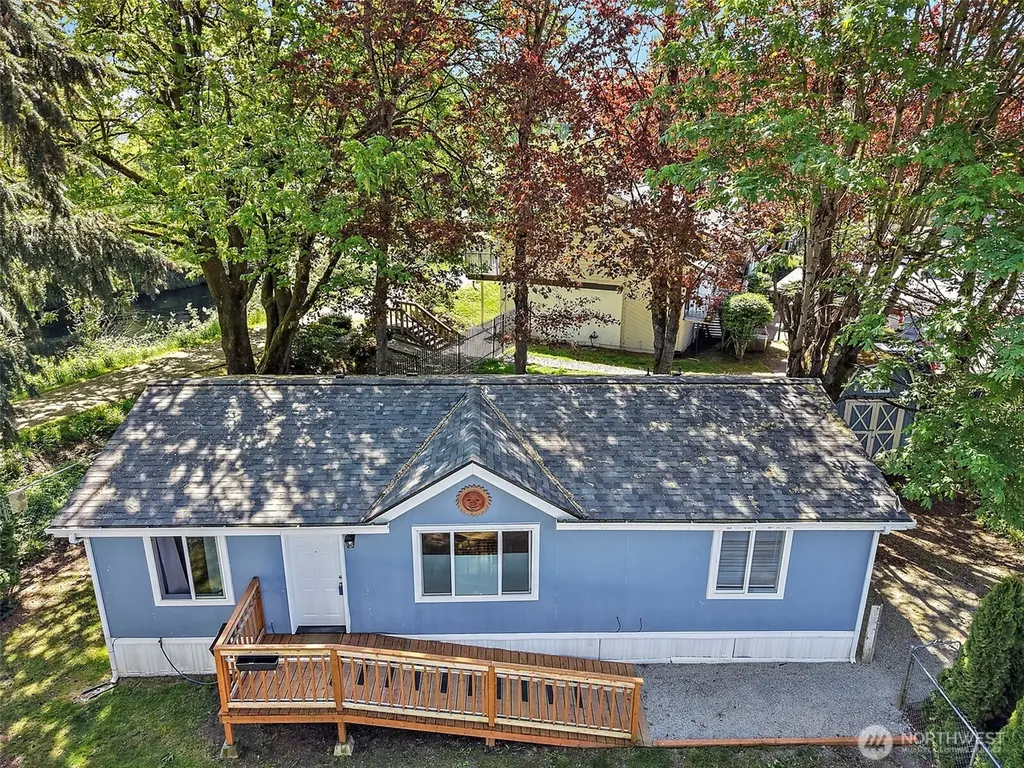
1720 Maple Lane Ct #22 · Kent, WA
Flood risk 5/10 · Moderate
- FEMA flood zone
- X
- Chance of flooding over 30 yrs
- 0.24%
- Est. flood insurance / yr
- $507 – $1,088
Fire risk 1/10 · Minimal
- Est. fire insurance / yr
- $604 – $1,122
Heat risk 3/10 · Minor
- Hot days now (above 88°F)
- 7 days/yr
- Hot days in 30 yrs
- 15 days/yr
Wind risk 1/10 · Minimal
- Chance of severe wind over 30 yrs
- —
Air-quality risk 8/10 · Major
- Unhealthy air days now
- 12 days/yr
- Unhealthy air days in 30 yrs
- 12 days/yr
Risk factors via First Street. Map © Google.
Why this score? — see what drove the B grade
The composite is a weighted blend of 9 inputs, each scored 0–100. Each bar is that input's sub-score; the figure is the points it added to the 100-point composite (weight × sub-score).
- Cash flow +30.0/30.0
- 1% rule +10.0/10.0
- DSCR +10.0/10.0
- ARV discount +7.5/15.0
- Schools +4.8/10.0
- Livability +4.0/5.0
- Rent growth +3.4/5.0
- Condition / age +2.5/5.0
- Appreciation +0.0/10.0
$134,900
🖨 Deal sheet 📄 Offer letter ✓ Due diligence
Listing remarks
Welcome home! Enjoy privacy and space in this well-maintained home on a desirable corner lot with direct trail access in a quiet All-Ages community with affordable park rent. Built by Champion Homes of Oregon, this residence features quality 2x6 exterior wall construction and durable cement siding, plus a newer roof (2020) for added peace of mind. Inside, you’ll find a spacious kitchen with vaulted ceilings, a full laundry area with included washer & dryer, and 3 bedrooms including the primary suite with walk-in closet and private bath The fully fenced yard, two outbuildings, and ample parking provide flexibility for storage, hobbies, and outdoor living. Move-in ready as is&mdas
Key facts
- 9,120 sq ft lot
- 2 parking spots
- Built 2008
Property features AI
Finance
- Other: MLS status: Active; Buyer brokerage compensation: 3%
- Financial info: Listing terms: Cash or Conventional
- HOA & community: Park name: Maple Lane Community; Park approved for sale; Pets allowed per remarks; Senior exemption not indicated; Land lease in effect ($1,200)
Exterior
- Parking: Uncovered parking; 2 open parking spaces
- Utilities: Public water (City of Kent/park); Public sewer (City of Kent/park); Electric power (PSE); Electric energy source
- Home design: Manufactured double-wide home (Champion, model SLDIS5443R); One level; Tie down foundation
- Construction: Cement plank and wood construction; Composition roof; Manufactured after 6/15/1976
- Exterior features: Cement planked exterior; Wood products; Corner lot; Curbs; Paved; Secluded; Common area and trails in the park; Has view
Interior
- Kitchen: Dishwasher; Microwave; Refrigerator; Stove/Range
- Bedrooms: 3 bedrooms
- Flooring: Vinyl; Vinyl plank; Carpet
- Bathrooms: 2 full bathrooms; 2 bathtubs; 2 showers
- Heating & cooling: Forced air heating; No central cooling; Double pane windows
- Interior features: Water heater; Vaulted ceilings; Ceiling fan(s); Drapes; Walk-in closet; Bath off primary
- Laundry & utility: Washer; Dryer; Laundry room with electric water heater
Neighborhood map
What this means for you Summary
Snapshot
- This is a 3-bed/2.0-bath manufactured listed at $135k.
Deal economics
- At list price, monthly cash flow is $749 ($9k/yr) — positive.
- The deal already cash-flows at list — no discount required.
- Meets the 1% rule at list price ($2k rent vs $135k).
- Recommended offer: $133k (1.5% below list) — sets the bar for market timing.
- Cap rate 13.0% vs local median 2.7% in Kent — top-decile yield for the area; either an underpriced asset or a hidden risk that comps aren't pricing in. Stress-test before assuming the spread holds.
Location & tenants
- Location reads 79/100 on livability (#109 in WA, #2,154 nationally) — a middle-class / working-renter tenant base. Strengths: amenities A+, commute A+, housing A+; Watch: schools C-, crime F, cost of living F.
- Kent School District (urban): math 47% / reading 57% proficiency, ranked #109 of 291 in WA (top 38%) — acceptable for families but not a draw, mixed tenant base, ~2y average lease.
- Market conditions: Rents rising (+3.7%/yr); 171 active listings in the ZIP; 29 comparable units currently listed for rent nearby; rentals at typical pace (median 18d on market — plan ~3-4 weeks tenant-placement turnaround); solid renter incomes; 10,555 units permitted in King County in 2024 (7,119 in 5+ unit buildings).
Forward outlook
- Local home prices are declining (-3.0%/yr); year-one equity from $933 of loan paydown is wiped out by about $4k of value loss. Plan a longer hold.
- King County population projected at +44% by 2050 — long-run rental-demand tailwind backs the buy-and-hold thesis.
- At projected returns (-3.0% appreciation + 3.7% rent growth), your $38k cash investment doubles in ~5 years — after that, you're playing with house money.
Negotiation context
- It's been on market 22 days — a 2% lower offer ($133k) is reasonable based on typical stale-listing flexibility.
- 3 sale attempts since 12y ago with the ask held roughly flat each time — persistent listings suggest the price (not the market) is what's stuck; bring a comps-based counter.
- Current owner paid $110k; 23% above their basis — modest negotiation headroom, anchor on the comps not their cost.
Risks & watch-outs
- Climate carrying-cost: moderate flood risk — expect insurance premiums to compound above CPI over the hold.
Questions for the listing agent
- Is there a deadline driving the sale (1031 exchange, divorce, estate, relocation)? That informs how much negotiation room exists.
- Crime grade is F in this area — have there been break-ins, vandalism, or insurance claims at this property in the last 3 years? What carrier currently insures it and at what premium?
- What's the average days-on-market for RENTAL listings here right now (not sales)? A rising rental-DOM trend means longer vacancies and softer asking-rent achievability than the comps imply.
- What's the recent tenant-quality profile in this submarket — average credit score on applications, eviction rate, late-payment / NSF rate, and stable-employment percentage? A property-management company in the area should have these aggregated.
- How much new for-sale + rental construction is in the pipeline within 1–3 miles? Heavy new supply typically softens prices + rents 12–24 months out; constrained supply supports both.
Investment metrics
- 1% rule
- 1.58% ✓
- Cap rate
- 12.96%
- Cash-on-cash
- 23.81%
- DSCR
- 2.06
- GRM
- 5.3
CMA / ARV
- ARV (median comp)
- $89,710
- List price
- $134,900
- Delta
- 50.37%
- Verdict
- OVERPRICED
- Comps
- 2 within 1.0 mi
Show comp detail 2 sales within ~0.75 mi
| Address | Dist | Beds/Ba | Sqft | Sold | Price | $/sf | Match |
|---|---|---|---|---|---|---|---|
| 1510 Maple Ln #16 | 0.16mi | 2/2.0 (-1) | 1,150 (+12%) | 10mo | $103,000 | $90 | 60 |
| 856 Central Ave S #87 | 0.53mi | 2/1.0 (-1) | 900 (-12%) | 3mo | $76,000 | $84 | 43 |
Match score weights: distance 35% · size 25% · config 20% · recency 20%. Top-matched comps best support the ARV.
Projected returns pro-forma
-3.0% appreciation · 3.72% rent growth · sell at horizon
- IRR
- 17.8%
- Equity multiple
- 1.73×
- Total profit
- $27,455
- Equity at exit
- $20,114
- IRR
- 26.8%
- Equity multiple
- 3.43×
- Total profit
- $91,964
- Equity at exit
- $11,664
Cash invested: $37,772 (down + closing). Projections, not guarantees.
Landlord ↔ Tenant lean methodology
- Overall (STATE)
- 28 Tenant-Leaning
- State Washington
- 28 Tenant-Leaning · D+8
- County
- — inherits STATE
- City
- — inherits STATE
ZIP-level market 98030
- Rents YoY
- 3.7%
- Active inventory
- 171
- Price-to-rent
- 5.3×
Monthly cashflow live
- Estimated rent
- $2,129 high interval (Pro) →
- Mortgage (P&I)
- −$707
- Tax est. 1.5%
- −$169 /mo · $2,024/yr
- Insurance
- −$56
- HOA
- −$0
- Vacancy / Maint / Mgmt
- −$447
- Net cashflow
- $749
Break-even live
UW: 25.0% down · 7.5% · 30yr · 1.5% tax · 5.0% vac · 8.0% maint · 8.0% mgmt
Financing live
Cash to close
- Down payment
- $33,725
- Closing costs
- $4,047
- Reserves months
- —
- Total cash needed
- —
Loan-product check · same deal, 3 products live
Conventional
25% down · 7.5% · 30yr
- Down + closing
- —
- Monthly P&I
- —
- Monthly cashflow
- —
- DSCR
- —
- Eligible?
- —
Personal DTI + credit; lowest rate.
DSCR
20% down · 8.5% · 30yr
- Down + closing
- —
- Monthly P&I
- —
- Monthly cashflow
- —
- DSCR
- —
- Eligible?
- —
No personal income docs; deal must DSCR.
Hard money
10% down · 12.0% · 12mo
- Down + closing
- —
- Monthly P&I
- —
- Monthly cashflow
- —
- DSCR
- —
- Eligible?
- —
Short-term bridge; refi at stabilization.
Rent comps 29 comps
| Address | Beds | Baths | Sqft | Rent | $/sqft | DOM | Units | Dist |
|---|---|---|---|---|---|---|---|---|
| 1605 Maple Ln Apt 2 Kent, WA | 2.0 | 1.0 | 930 | $1,850 | $1.99 | 5d | 1 | 0.11mi |
| 724 2nd Ave S Kent, WA | 2.0 | 1.0 | 875 | $1,699 | $1.94 | 43d | 1 | 0.80mi |
| 713 3rd Ave S Kent, WA | 3.0 | 2.5 | 1350 | $2,795 | $2.07 | 43d | 1 | 0.87mi |
| 702 5th Ave S Kent, WA | 2.0–3.0 | 1.5 | 1150 | $2,400 | $2.09 | 5d | 3 | 0.92mi |
| 707 6th Ave S Unit F103 Kent, WA | 2.0 | 1.5 | 979 | $1,700 | $1.74 | 43d | 1 | 0.96mi |
| 4750 Auburn Way N Auburn, WA | 1.0–4.0 | 1.0–2.0 | 1011 | $2,417 | $2.39 | 1d | 10 | 1.00mi |
| 622 6th Ave S Kent, WA | 3.0 | 2.0 | 1114 | $2,999 | $2.69 | 43d | 1 | 1.02mi |
| 25426 97th Pl S Unit 2 Kent, WA | 2.0 | 1.0 | 820 | $1,995 | $2.43 | 24d | 1 | 1.02mi |
| 25426 97th Pl S Unit 2 Kent, WA | 2.0 | 1.0 | 800 | $2,095 | $2.62 | 43d | 1 | 1.02mi |
| 25426 98th Ave S Kent, WA | 3.0 | 1.0 | 690 | $2,576 | $3.73 | 5d | 18 | 1.03mi |
| 10031 SE 258th Pl Kent, WA | 3.0 | 2.0–2.5 | 1454 | $2,968 | $2.04 | 3d | 3 | 1.03mi |
| 401 3rd Ave S Unit Up L Kent, WA | 2.0 | 1.0 | 700 | $1,700 | $2.43 | 43d | 1 | 1.09mi |
| 9626 S 252nd St Kent, WA | 2.0 | 1.0 | 880 | $1,675 | $1.90 | 2d | 4 | 1.15mi |
| 802 45th St NE Auburn, WA | 1.0–3.0 | 1.0–2.0 | 895 | $1,999 | $2.23 | 1d | 11 | 1.18mi |
| 9045 Canyon Dr Apt 1 Kent, WA | 2.0 | 1.0 | 750 | $1,295 | $1.73 | 18d | 1 | 1.21mi |
| 25035 98th Pl S Kent, WA | 2.0 | 1.0 | 900 | $2,200 | $2.44 | 43d | 1 | 1.22mi |
| 106 Kensington Ave S #102 Kent, WA | 3.0 | 1.0 | 881 | $1,650 | $1.87 | 24d | 1 | 1.23mi |
| 106 Kensington Ave S Unit 104 Kent, WA | 3.0 | 1.0 | 881 | $1,695 | $1.92 | 43d | 1 | 1.23mi |
| 1254 Weiland St Kent, WA | 2.0 | 1.0 | 974 | $1,550 | $1.59 | 43d | 1 | 1.23mi |
| 9803 S 248th St Kent, WA | 1.0–2.0 | 1.0 | 754 | $1,790 | $2.37 | 12d | 1 | 1.33mi |
| 24802 99th Pl S Kent, WA | 1.0–2.0 | 1.0–2.0 | 817 | $2,419 | $2.96 | 2d | 9 | 1.36mi |
| 420 W Smith St Kent, WA | 2.0 | 1.0–2.0 | 704 | $2,321 | $3.30 | 2d | 8 | 1.36mi |
| 625 W Meeker St Kent, WA | 1.0–2.0 | 1.0 | 633 | $1,787 | $2.82 | 2d | 15 | 1.36mi |
| 10433 SE Kent Kangley Rd Kent, WA | 1.0–2.0 | 1.0–2.0 | 776 | $1,845 | $2.38 | 5d | 7 | 1.39mi |
| 24808 100th Pl SE Kent, WA | 1.0–2.0 | 1.0–2.0 | 812 | $2,461 | $3.03 | 2d | 12 | 1.41mi |
| 24928 103rd Ave SE Apt D302 Kent, WA | 2.0 | 2.0 | 886 | $2,095 | $2.36 | 22d | 1 | 1.44mi |
| 443 Ramsay Way Kent, WA | 1.0–2.0 | 1.0–2.0 | 728 | $2,249 | $3.09 | 2d | 13 | 1.48mi |
| 10215 SE 248th St Kent, WA | 3.0 | 2.0 | 1250 | $2,895 | $2.32 | 20d | 1 | 1.50mi |
| 10215 SE 248th St Kent, WA | 2.0–3.0 | 2.0 | 1240 | $2,895 | $2.33 | 43d | 3 | 1.50mi |
Listing history 7 events
-
2026-04-30$134,900 Active
-
2023-09-27soldstatus $110,000 Closed
-
2023-09-14status Pending - Backup Offer Requested
-
2023-09-07$110,000 Active
-
2014-09-15soldstatus $44,500 Sold
-
2014-08-13status Pending
-
2014-07-11$45,000 Active
ⓘ Source: listings_history table (triggers on properties + properties_extension) + one-shot
backfill from property_details.listing_events for pre-trigger history.
Climate risk First Street
- Flood 5/10 Major FEMA zone X · 24% chance over 30 yrs
- Wildfire 1/10 Low
- Heat 3/10 Moderate 7 d/yr ≥88°F today · 15 d/yr by 30 yrs out
- Wind 1/10 Low
- Air quality 8/10 Severe 12 unhealthy d/yr today · 12 by 30 yrs out
Nearby sold comps map
Loading sold comps map…
Walkable amenities ~0.75 mi
Loading nearby amenities…
Taxation est. · year 1
- Rental income
- $25,544
- − Mortgage interest
- −$7,556
- − Property taxes
- −$2,024
- − Insurance
- −$674
- − Repairs & maintenance
- −$2,044
- − Management
- −$2,044
- − Depreciation
- −$3,924
- Taxable income
- $7,278
- Est. tax owed @ 24.0%
- −$1,747
- After-tax cash flow
- $7,246/yr
For passive investors: Depreciation is non-cash, so a rental often shows a tax loss while cash-flowing — sheltering income. Rental losses are passive: they offset passive income freely, and up to $25,000/yr can offset ordinary (W-2) income if you actively participate and your MAGI is under $100k (phasing out to $0 by $150k); unused losses carry forward. On sale, claimed depreciation is recaptured at up to 25%, and gains may owe capital-gains tax (a 1031 exchange can defer both). Figures are a year-1 estimate at your 24.0% rate — not tax advice; consult a CPA.
Schools (NCES district)
- District
- Kent School District
- NCES district ID
- 5303960
- Math proficiency
- 47% ▼ -1.00%
- Reading proficiency
- 57% ▼ -1.00%
- Median HH income
- $69,823
- Composite
- 48.25/100
- National rank
- #4714
- State rank
- #109 of 291 in WA
Livability — Kent
- Score
- 79/100
- State rank
- #109
- US rank
- #2154
Category grades
Schools grade is shown separately in the Schools card above.
Census & demographics
- Census place
- Kent, WA
- County
- King County · 2,251,916 people
- City population
- 119,479
- Metro
- Seattle-Tacoma-Bellevue, WA
- Population (ZIP)
- 38,523
- Household income
- $91,761
- Rent vs Own
- Severe rent burden
- 1415.0
Population outlook (King County) Hauer SSP2
- Today (2025)
- 2,576,485 people
- By 2030
- 2,803,316 · +8.8%
- By 2040
- 3,255,921 · +26.4%
- By 2050
- 3,706,444 · +43.9%
- By 2075
- 4,746,063 · +84.2%
- By 2100
- 5,407,730 · +109.9%
Race, ethnicity, and origin ACS 2023
- Neighborhood character
- Highly diverse neighborhood (Simpson 0.74)
- Race & ethnicity
- White 41% Asian 24% Hispanic / Latino 15% Black 11% Two or more races 9% Pacific Islander 3%
- Hispanic origin (detail)
- Mexican 12%
- Common ancestry
- Subsaharan African 6% Italian 4% Portuguese 2%
- Foreign-born
- 36% · Canada, Vietnam, Philippines
- Languages at home
- 53% English-only · Spanish 10% Other Indo-European 9% Other Asian/Pacific 8%
Political lean MEDSL · King
- 2024 margin
- Solid D (+51.7) · D 74.2% · R 22.5% · Other 3.4%
- 2008→2024 swing
- +9.6pp toward D · 2008: 42.1pp · 2024: 51.7pp
- All cycles
- 2024: D+51.7 2020: D+52.7 2016: D+50.4 2012: D+39.9 2008: D+42.1
Not yet ingested
- Civics
- —
Market trends
- HPI YoY
- ▼ -494.18%
- Current HPI
- 315.2007
- Rent YoY
- ▲ 3.72%
- Metro
- Seattle-Tacoma-Bellevue, WA
- State GDP YoY
- ▲ 4.65%
- F500 in state
- 22
Industry mix (Fortune 500 HQ in WA)
| Industry | F500 HQs | Revenue |
|---|---|---|
| Retail | 2 | $269B |
|
||
| Technology / Retail | 1 | $638B |
|
||
| Technology | 1 | $245B |
|
||
| Telecommunications | 1 | $38B |
|
||
| Food / Beverage | 1 | $36B |
|
||
| Automotive / Trucks | 1 | $34B |
|
||
Price history
+199.8% since first listed8 events — show timeline
- 2026-05-23 Pending — NWMLS as Distributed by MLS Grid
- 2026-04-30 Listed $134,900 NWMLS as Distributed by MLS Grid
- 2023-09-27 Sold (MLS) $110,000 NWMLS as Distributed by MLS Grid
- 2023-09-14 Pending — NWMLS as Distributed by MLS Grid
- 2023-09-07 Listed $110,000 NWMLS as Distributed by MLS Grid
- 2014-09-15 Sold (MLS) $44,500 NWMLS as Distributed by MLS Grid
- 2014-08-13 Pending — NWMLS as Distributed by MLS Grid
- 2014-07-11 Listed $45,000 NWMLS as Distributed by MLS Grid
Cash-flow waterfall
monthlySold comps — $/sqft
last 12 mo · ≤1 miLoading sold comps…