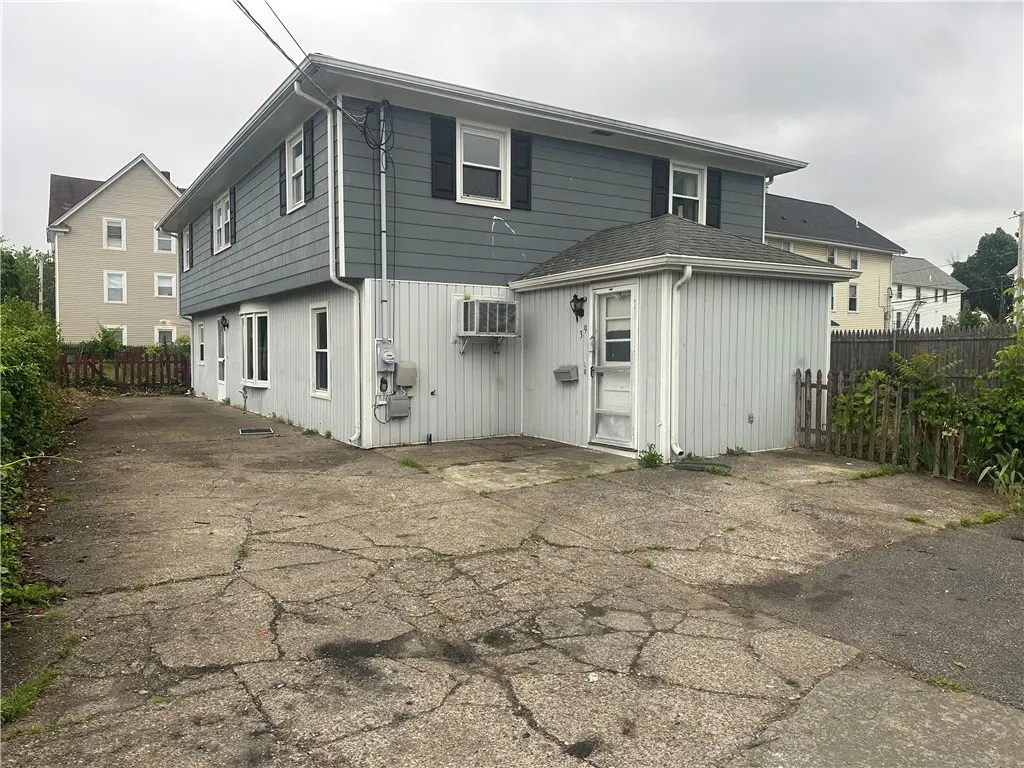
39 Locust St · Pawtucket, RI
Flood risk No data
- FEMA flood zone
- —
- Chance of flooding over 30 yrs
- —
- Est. flood insurance / yr
- —
Fire risk No data
- Est. fire insurance / yr
- —
Heat risk No data
- Hot days now (above threshold)
- —
- Hot days in 30 yrs
- —
Wind risk No data
- Chance of severe wind over 30 yrs
- —
Air-quality risk No data
- Unhealthy air days now
- —
- Unhealthy air days in 30 yrs
- —
Risk factors via First Street. Map © Google.
Why this score? — see what drove the F grade
The composite is a weighted blend of 9 inputs, each scored 0–100. Each bar is that input's sub-score; the figure is the points it added to the 100-point composite (weight × sub-score).
- ARV discount +11.5/15.0
- Cash flow +8.1/30.0
- Livability +3.6/5.0
- Rent growth +3.4/5.0
- Condition / age +2.5/5.0
- 1% rule +2.3/10.0
- DSCR +2.1/10.0
- Schools +1.1/10.0
- Appreciation +0.0/10.0
$315,000
🖨 Deal sheet 📄 Offer letter ✓ Due diligence
Listing remarks
Vinyl siding, roof, and heating system all appear in great working order. In need of cosmetic updates throughout. Great opportunity
Key facts
- 4,792 sq ft lot
- 4 parking spots
- Built 1969
Property features AI
Exterior
- Parking: No garage; Space for 4 vehicles (total parking)
- Utilities: Sewer connected; Water connected; 200+ amp electrical service
- Home design: Single-story appearance (listed as 1 story); Above-grade finished living area reported
- Construction: Drywall and plaster interior walls; Vinyl siding exterior; Concrete perimeter foundation
- Exterior features: Lot approximately 0.11 acres
Interior
- Kitchen: Kitchen on the first level
- Bedrooms: Four bedrooms (all on the second level)
- Flooring: Carpet; Ceramic tile; Laminate
- Bathrooms: Two full bathrooms (one on the first level, one on the second level)
- Heating & cooling: Gas heating; Hot water heating
- Interior features: Unfinished basement; Carpet flooring; Ceramic tile flooring; Laminate flooring; Gas water heater
- Laundry & utility: Laundry room on the first level
Neighborhood map
What this means for you Summary
Snapshot
- This is a 4-bed/2.0-bath single-family listed at $315k.
Deal economics
- At list price, monthly cash flow is $-314 ($-4k/yr) — negative.
- To cash-flow at today's rent, offer at most $260k (17.6% below list).
- To meet the 1% rule (rent ≥ 1% of price), the offer needs to be $229k (27.4% below list).
- Recommended offer: $229k (27.4% below list) — sets the bar for 1% rule.
- Cap rate 5.1% vs local median 3.8% in Pawtucket — top-decile yield for the area; either an underpriced asset or a hidden risk that comps aren't pricing in. Stress-test before assuming the spread holds.
Location & tenants
- Location reads 71/100 on livability (#16 in RI) — a middle-class / working-renter tenant base. Strengths: housing A+, health & safety A+, cost of living B+; Watch: employment C-, schools D, amenities F.
- Pawtucket (suburban): math 7% / reading 19% proficiency, ranked #33 of 39 in RI (top 85%) — low school quality limits family demand, transient renter base, plan for 1-2y turnover; 67% free/reduced lunch — lower-income household profile, screen leases tightly.
- Market conditions: Rents rising (+3.5%/yr); 123 active listings in the ZIP; 17 comparable units currently listed for rent nearby; rentals at typical pace (median 19d on market — plan ~3-4 weeks tenant-placement turnaround); 776 units permitted in Providence County in 2024 (229 in 5+ unit buildings).
- This rent runs 45% of the median local income ($62k/yr) — at the standard rent-burdened threshold; future hikes will face affordability resistance.
Forward outlook
- Local home prices are declining (-3.0%/yr); year-one equity from $2k of loan paydown is wiped out by about $9k of value loss. Plan a longer hold.
- Providence County population projected at +5% by 2050 — modest demand growth; plan on rents tracking national, not racing it.
Negotiation context
- Only 3 days on market — expect competitive offers; lowballing is unlikely to land.
Questions for the listing agent
- What do current leases actually rent for vs. the listed asking? Can we see a recent rent roll and the last 12 months of T-12 income?
- Built in 1969 — when were the roof, HVAC, electrical panel, plumbing, and water heater last replaced?
- Is there a deadline driving the sale (1031 exchange, divorce, estate, relocation)? That informs how much negotiation room exists.
- Schools are D-rated, which usually means shorter tenancies and higher turnover. Who's the typical renter profile here, and what's been the actual vacancy rate?
- The area grade is low — what's the realistic commute time and amenity access for the typical tenant pool here? Any planned neighborhood developments (good or bad) we should know about?
- What's the average days-on-market for RENTAL listings here right now (not sales)? A rising rental-DOM trend means longer vacancies and softer asking-rent achievability than the comps imply.
- What's the recent tenant-quality profile in this submarket — average credit score on applications, eviction rate, late-payment / NSF rate, and stable-employment percentage? A property-management company in the area should have these aggregated.
- How much new for-sale + rental construction is in the pipeline within 1–3 miles? Heavy new supply typically softens prices + rents 12–24 months out; constrained supply supports both.
Investment metrics
- 1% rule
- 0.73% ✗
- Cap rate
- 5.10%
- Cash-on-cash
- -4.27%
- DSCR
- 0.81
- GRM
- 11.5
CMA / ARV
- ARV (on-the-fly)
- $345,708
- Comps found
- 8
Show comp detail 8 sales within ~0.75 mi
| Address | Dist | Beds/Ba | Sqft | Sold | Price | $/sf | Match |
|---|---|---|---|---|---|---|---|
| 20 Webster St | 0.19mi | 3/1.5 (-1) | 1,279 (+8%) | 16mo | $345,000 | $270 | 58 |
| 22 Clark Ave | 0.28mi | 4/1.0 | 1,128 (-5%) | 22mo | $350,000 | $310 | 56 |
| 40 Dickens St | 0.49mi | 3/1.5 (-1) | 1,177 (-1%) | 17mo | $365,000 | $310 | 54 |
| 30 Japonica St | 0.27mi | 3/1.0 (-1) | 1,056 (-11%) | 8mo | $295,000 | $279 | 54 |
| 30 Columbine Ave | 0.39mi | 3/1.0 (-1) | 1,210 (+2%) | 21mo | $370,000 | $306 | 52 |
| 22 Borden St | 0.66mi | 3/2.0 (-1) | 1,200 (+1%) | 18mo | $330,000 | $275 | 47 |
| 27 Aiken St | 0.56mi | 3/2.0 (-1) | 1,066 (-10%) | 6mo | $310,000 | $291 | 47 |
| 56 Arthur St | 0.62mi | 3/1.0 (-1) | 1,260 (+6%) | 8mo | $335,000 | $266 | 46 |
Match score weights: distance 35% · size 25% · config 20% · recency 20%. Top-matched comps best support the ARV.
Projected returns pro-forma
-3.0% appreciation · 3.47% rent growth · sell at horizon
- IRR
- -23.0%
- Equity multiple
- 0.21×
- Total profit
- $-69,953
- Equity at exit
- $46,968
- IRR
- -16.4%
- Equity multiple
- 0.07×
- Total profit
- $-82,158
- Equity at exit
- $27,235
Cash invested: $88,200 (down + closing). Projections, not guarantees.
Landlord ↔ Tenant lean methodology
- Overall (STATE)
- 31 Tenant-Leaning
- State Rhode Island
- 31 Tenant-Leaning · D+8
- County
- — inherits STATE
- City
- — inherits STATE
ZIP-level market 02860
- Rents YoY
- 3.5%
- Active inventory
- 123
- Price-to-rent
- 11.5×
Monthly cashflow live
- Estimated rent
- $2,288 high interval (Pro) →
- Mortgage (P&I)
- −$1,652
- Tax from tax record
- −$338 /mo · $4,058/yr
- Insurance
- −$131
- HOA
- −$0
- Vacancy / Maint / Mgmt
- −$480
- Net cashflow
- $-314
Break-even live
UW: 25.0% down · 7.5% · 30yr · 1.5% tax · 5.0% vac · 8.0% maint · 8.0% mgmt
Financing live
Cash to close
- Down payment
- $78,750
- Closing costs
- $9,450
- Reserves months
- —
- Total cash needed
- —
Loan-product check · same deal, 3 products live
Conventional
25% down · 7.5% · 30yr
- Down + closing
- —
- Monthly P&I
- —
- Monthly cashflow
- —
- DSCR
- —
- Eligible?
- —
Personal DTI + credit; lowest rate.
DSCR
20% down · 8.5% · 30yr
- Down + closing
- —
- Monthly P&I
- —
- Monthly cashflow
- —
- DSCR
- —
- Eligible?
- —
No personal income docs; deal must DSCR.
Hard money
10% down · 12.0% · 12mo
- Down + closing
- —
- Monthly P&I
- —
- Monthly cashflow
- —
- DSCR
- —
- Eligible?
- —
Short-term bridge; refi at stabilization.
Rent comps 17 comps
| Address | Beds | Baths | Sqft | Rent | $/sqft | DOM | Units | Dist |
|---|---|---|---|---|---|---|---|---|
| 65 Cole St Unit 2 Pawtucket, RI | 3.0 | 1.0 | 1000 | $1,800 | $1.80 | 4d | 1 | 0.23mi |
| 71 Daniels St Unit 3rd floor Pawtucket, RI | 4.0 | 1.0 | 1200 | $2,400 | $2.00 | 43d | 1 | 0.26mi |
| 56 Greene St Unit 2 Pawtucket, RI | 3.0 | 1.0 | 1200 | $2,200 | $1.83 | 43d | 1 | 0.30mi |
| 41 Benefit St Unit 2 Pawtucket, RI | 3.0 | 1.0 | 1100 | $2,100 | $1.91 | 43d | 1 | 0.35mi |
| 41 Benefit St Pawtucket, RI | 3.0 | 1.0 | 1100 | $2,000 | $1.82 | 15d | 1 | 0.35mi |
| 171 N Bend St Unit 1 Pawtucket, RI | 3.0 | 2.0 | 1352 | $2,450 | $1.81 | 1d | 1 | 0.49mi |
| 413 Central Ave Pawtucket, RI | 1.0–3.0 | 1.0–2.0 | 1285 | $2,920 | $2.27 | 1d | 9 | 0.58mi |
| 14 Courtland St Unit 3 Central Falls, RI | 4.0 | 1.0 | 1240 | $1,950 | $1.57 | 10d | 1 | 0.75mi |
| 14 Courtland St Unit 2 Central Falls, RI | 3.0 | 1.0 | 1240 | $1,850 | $1.49 | 10d | 1 | 0.75mi |
| 53 Chaplin St Pawtucket, RI | 3.0 | 1.0 | 1100 | $2,100 | $1.91 | 43d | 1 | 0.77mi |
| 63 W Carpenter St Unit 2F Attleboro, MA | 3.0 | 1.0 | 1000 | $2,500 | $2.50 | 1d | 1 | 0.80mi |
| 53 S Bend St Unit 3 Pawtucket, RI | 3.0 | 1.0 | 922 | $1,900 | $2.06 | 23d | 1 | 0.88mi |
| 14 Carpenter St Unit 1 Cumberland, RI | 4.0 | 1.0 | 1467 | $2,850 | $1.94 | 1d | 1 | 0.89mi |
| 137 Hunts Ave Pawtucket, RI | 3.0 | 1.0 | 1134 | $1,900 | $1.68 | 23d | 1 | 0.91mi |
| 31 Potter St Unit 1 Pawtucket, RI | 3.0 | 1.0 | 1100 | $2,000 | $1.82 | 43d | 1 | 0.96mi |
| 96 Shawmut Ave Unit 98 Central Falls, RI | 4.0 | 1.5 | 1398 | $2,700 | $1.93 | 19d | 1 | 1.11mi |
| 53 Calder St Unit 2 Pawtucket, RI | 3.0 | 1.0 | 1316 | $2,250 | $1.71 | 43d | 1 | 1.14mi |
Listing history 4 events
-
2026-06-07statusdays on market $315,000 Pending 3 DOM
-
2026-06-05days on market $315,000 Active 2 DOM
-
2026-06-02remarks 131-char remark
-
2026-06-02$315,000 Active 1 DOM
ⓘ Source: listings_history table (triggers on properties + properties_extension) + one-shot
backfill from property_details.listing_events for pre-trigger history.
Tax reassessment forecast RI · Partial reset (capped growth)
- Current annual tax
- $4,058 · $338/mo
- Projected year-2 tax
- $4,596 · $383/mo
- Expected delta
- +$538/yr (+$45/mo · 13.3%)
ⓘ Screening estimate from a state-policy table — verify with the county assessor before closing.
Nearby sold comps map
Loading sold comps map…
Walkable amenities ~0.75 mi
Loading nearby amenities…
Taxation est. · year 1
- Rental income
- $27,453
- − Mortgage interest
- −$17,645
- − Property taxes
- −$4,058
- − Insurance
- −$1,575
- − Repairs & maintenance
- −$2,196
- − Management
- −$2,196
- − Depreciation
- −$9,164
- Taxable loss
- −$9,381
- Est. tax savings @ 24.0%
- +$2,251
- After-tax cash flow
- $-1,516/yr
For passive investors: Depreciation is non-cash, so a rental often shows a tax loss while cash-flowing — sheltering income. Rental losses are passive: they offset passive income freely, and up to $25,000/yr can offset ordinary (W-2) income if you actively participate and your MAGI is under $100k (phasing out to $0 by $150k); unused losses carry forward. On sale, claimed depreciation is recaptured at up to 25%, and gains may owe capital-gains tax (a 1031 exchange can defer both). Figures are a year-1 estimate at your 24.0% rate — not tax advice; consult a CPA.
Schools (NCES district)
- District
- Pawtucket
- NCES district ID
- 4400840
- Math proficiency
- 7% ▼ -10.00%
- Reading proficiency
- 19% ▼ -5.00%
- Median HH income
- $41,838
- Composite
- 11.29/100
- National rank
- #9718
- State rank
- #33 of 39 in RI
Livability — Pawtucket
- Score
- 71/100
- State rank
- #16
- US rank
- #7037
Category grades
Schools grade is shown separately in the Schools card above.
Census & demographics
- Census place
- Pawtucket, RI
- County
- Providence County · 548,917 people
- City population
- 75,942
- Metro
- Providence-Warwick, RI-MA
- Population (ZIP)
- 47,818
- Household income
- $61,539
- Rent vs Own
- Severe rent burden
- 2528.0
Population outlook (Providence County) Hauer SSP2
- Today (2025)
- 653,469 people
- By 2030
- 660,819 · +1.1%
- By 2040
- 672,747 · +3.0%
- By 2050
- 683,741 · +4.6%
- By 2075
- 720,435 · +10.2%
- By 2100
- 741,582 · +13.5%
Race, ethnicity, and origin ACS 2023
- Neighborhood character
- Highly diverse neighborhood (Simpson 0.74)
- Race & ethnicity
- White 40% Hispanic / Latino 29% Two or more races 22% Black 14% Asian 1%
- Hispanic origin (detail)
- Mexican 2% Puerto Rican 9% Dominican 6%
- Common ancestry
- Russian 9% Lithuanian 4% Romanian 2%
- Foreign-born
- 28% · Canada, Jamaica
- Languages at home
- 57% English-only · Spanish 22% Other Indo-European 9% French/Haitian/Cajun 9%
Political lean MEDSL · Providence
- 2024 margin
- D (+14.4) · D 56.1% · R 41.7% · Other 2.2%
- 2008→2024 swing
- -20.0pp toward R · 2008: 34.4pp · 2024: 14.4pp
- All cycles
- 2024: D+14.4 2020: D+22.9 2016: D+21.2 2012: D+34.9 2008: D+34.4
Not yet ingested
- Civics
- —
Market trends
- HPI YoY
- ▼ -215.00%
- Current HPI
- 355.0152
- Rent YoY
- ▲ 3.47%
- Metro
- Providence-Warwick, RI-MA
- State GDP YoY
- ▲ 2.25%
- F500 in state
- 10
Industry mix (Fortune 500 HQ in RI)
| Industry | F500 HQs | Revenue |
|---|---|---|
| Healthcare | 1 | $373B |
|
||
| Food Distribution | 1 | $31B |
|
||
| Aerospace / Defense | 1 | $14B |
|
||
| Financial Services | 1 | $8B |
|
||
| Consumer Goods | 1 | $4B |
|
||
Price history
1 event — show timeline
- 2026-06-02 Listed $315,000 RIS
Property tax history
+1.7%/yrLatest (2025): $4,058 · +6.6% YoY. Source: county tax records.
Cash-flow waterfall
monthlySold comps — $/sqft
last 12 mo · ≤1 miLoading sold comps…