801 W Elkcam Cir Unit C6 · Marco Island, FL
Flood risk 8/10 · Major
- FEMA flood zone
- AE
- Chance of flooding over 30 yrs
- 0.97%
- Est. flood insurance / yr
- $1,737 – $8,500
Fire risk 3/10 · Minor
- Est. fire insurance / yr
- $947 – $1,759
Heat risk 10/10 · Severe
- Hot days now (above 108°F)
- 7 days/yr
- Hot days in 30 yrs
- 31 days/yr
Wind risk 10/10 · Severe
- Chance of severe wind over 30 yrs
- 99.0%
Air-quality risk 3/10 · Minor
- Unhealthy air days now
- 3 days/yr
- Unhealthy air days in 30 yrs
- 3 days/yr
Risk factors via First Street. Map © Google.
Why this score? — see what drove the C+ grade
The composite is a weighted blend of 9 inputs, each scored 0–100. Each bar is that input's sub-score; the figure is the points it added to the 100-point composite (weight × sub-score).
- Cash flow +22.9/30.0
- 1% rule +8.6/10.0
- ARV discount +7.5/15.0
- DSCR +7.4/10.0
- Schools +5.0/10.0
- Rent growth +4.1/5.0
- Livability +3.6/5.0
- Condition / age +2.5/5.0
- Appreciation +0.0/10.0
$375,000
🖨 Deal sheet (PDF) 📄 Offer letter ✓ Due diligence
Listing remarks MLS
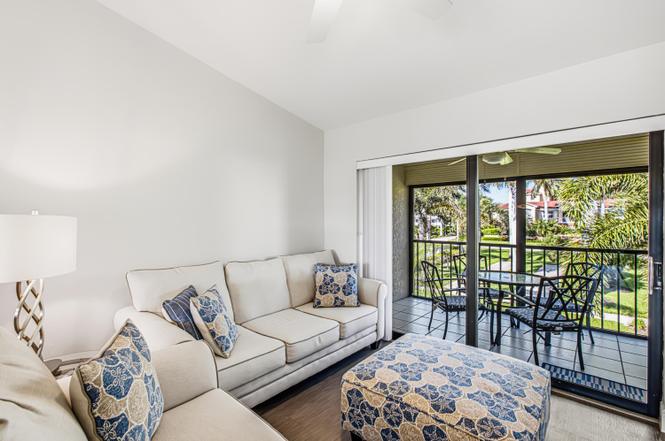
Peek of the bay from this 2 bedroom, 2 bath condo close to shops and dining at the nearby Esplanade and restaurants. Both bathrooms have been completely updated. New laminate flooring in the living area. Newer a/c, washer, dryer and microwave.
Key facts
- Stylish vinyl floors
- Garden view lanai
- Impact glass
Tags
Property features AI
Finance
- HOA & community: Community pool; Cabana; Barbecue area; Shuffleboard court; Car wash area
Exterior
- Parking: Detached carport (1 carport space); No attached garage
- Security: No security features
- Home design: Two levels
- Construction: Shingle roof
- Exterior features: Lanai; Impact windows and doors; Window coverings; City lot; Cul-de-sac location; Not waterfront
Interior
- Kitchen: Dishwasher; Range; Microwave; Refrigerator; Disposal
- Bedrooms: 2 bedrooms
- Flooring: Carpet; Laminate
- Bathrooms: 2 full bathrooms
- Heating & cooling: Central heating; Central air; Ceiling fan(s)
- Interior features: Vaulted ceilings; Walk-in closet(s)
- Laundry & utility: Washer; Dryer
Neighborhood map
What this means for you Summary
Snapshot
- This is a 2-bed/2.0-bath condo listed at $375k.
Deal economics
- At list price, monthly cash flow is $233 ($3k/yr) — positive.
- The deal already cash-flows at list — no discount required.
- Meets the 1% rule at list price ($5k rent vs $375k).
Location & tenants
- Location reads 71/100 on livability (#404 in FL) — a middle-class / working-renter tenant base. Strengths: crime A+, employment A+, health & safety A+; Watch: amenities F, commute F, cost of living F.
- Collier (suburban): math 60% / reading 56% proficiency, ranked #16 of 73 in FL (top 22%) — acceptable for families but not a draw, mixed tenant base, ~2y average lease.
- Market conditions: Rents rising fast (+6.6%/yr); 690 active listings in the ZIP; 25 comparable units currently listed for rent nearby; rentals at typical pace (median 25d on market — plan ~3-4 weeks tenant-placement turnaround); solid renter incomes; 3,520 units permitted in Collier County in 2024 (959 in 5+ unit buildings).
- At $5,086/mo this rent would consume 60% of the median local household income ($102k/yr) (locally 314% of renters already pay >50% of income on rent) — very limited rent-growth headroom before tenants either downsize or default.
Forward outlook
- Local home prices are declining (-3.0%/yr); year-one equity from $3k of loan paydown is wiped out by about $11k of value loss. Plan a longer hold.
- Collier County population projected at +30% by 2050 — long-run rental-demand tailwind backs the buy-and-hold thesis.
- At projected returns (-3.0% appreciation + 6.6% rent growth), your $105k cash investment doubles in ~10 years — after that, you're playing with house money.
Negotiation context
- Only 4 days on market — expect competitive offers; lowballing is unlikely to land.
- 3 sale attempts since 6y ago with the ask held roughly flat each time — persistent listings suggest the price (not the market) is what's stuck; bring a comps-based counter.
- Current owner paid $245k; list at $375k implies a 53% gain — meaningful room to come down on a strong offer.
Risks & watch-outs
- Watch-outs: flood insurance adds $427/mo; HOA is 20% of rent.
- Climate carrying-cost: in FEMA flood zone AE (mandatory federal flood insurance); severe wind risk, 99% chance of damaging wind over 30y; extreme-heat days projected 7→31/yr by 2055 (HVAC capex compounding) — expect insurance premiums to compound above CPI over the hold.
Questions for the listing agent
- What's the actual annual flood-insurance premium (NFIP or private), and is the property in a SFHA with mandatory coverage?
- What does the HOA fee cover, when was the last increase, and are there any pending special assessments or reserve-fund shortfalls?
- Any open or pending special assessments — roof, HVAC, plumbing, elevator, façade? What's the per-unit balance and payoff schedule, and is the seller paying it off at close or rolling it to the buyer?
- Is there a deadline driving the sale (1031 exchange, divorce, estate, relocation)? That informs how much negotiation room exists.
- Schools are A-rated — typically a magnet for longer-tenancy family renters. What's the average tenant stay here, and is there a school-zone premium baked into asking?
- What's the average days-on-market for RENTAL listings here right now (not sales)? A rising rental-DOM trend means longer vacancies and softer asking-rent achievability than the comps imply.
- What's the recent tenant-quality profile in this submarket — average credit score on applications, eviction rate, late-payment / NSF rate, and stable-employment percentage? A property-management company in the area should have these aggregated.
- How much new apartment / multifamily construction is in the pipeline within 1–3 miles? Heavy new supply (>2% of stock underway) typically softens rents 12–24 months out; light construction supports rent growth.
Investment metrics
- 1% rule
- 1.36% ✓
- Cap rate
- 8.40%
- Cash-on-cash
- 7.54%
- DSCR
- 1.34
- GRM
- 6.1
CMA / ARV
No comps found within radius.
Projected returns pro-forma
-3.0% appreciation · 6.59% rent growth · sell at horizon
- IRR
- -6.4%
- Equity multiple
- 0.75×
- Total profit
- $-26,077
- Equity at exit
- $55,914
- IRR
- 8.5%
- Equity multiple
- 1.80×
- Total profit
- $83,792
- Equity at exit
- $32,423
Cash invested: $105,000 (down + closing). Projections, not guarantees.
Landlord ↔ Tenant lean methodology
- Overall (STATE)
- 87 Strongly Landlord-Friendly
- State Florida
- 87 Strongly Landlord-Friendly · R+3
- County
- — inherits STATE
- City
- — inherits STATE
ZIP-level market 34145
- Rents YoY
- 6.6%
- Active inventory
- 690
- Price-to-rent
- 6.1×
Monthly cashflow live
- Estimated rent
- $5,086 high interval (Pro) →
- Mortgage (P&I)
- −$1,967
- Tax from tax record
- −$217 /mo · $2,608/yr
- Insurance
- −$156
- Flood insurance flood zone
- −$427 /mo · $5,118/yr
- HOA
- −$1,018
- Vacancy / Maint / Mgmt
- −$1,068
- Net cashflow
- $233
Break-even live
Sensitivity live
| Price | -10% $445 | -5% $339 | +0% $233 | +5% $127 | +10% $21 |
|---|---|---|---|---|---|
| Rent | -10% $-169 | -5% $32 | +0% $233 | +5% $434 | +10% $635 |
| Rate | -1.0pp $422 | -0.5pp $328 | base $233 | +0.5pp $136 | +1.0pp $37 |
UW: 25.0% down · 7.5% · 30yr · 1.5% tax · 5.0% vac · 8.0% maint · 8.0% mgmt
Financing live
Cash to close
- Down payment
- $93,750
- Closing costs
- $11,250
- Reserves months
- —
- Total cash needed
- —
Loan-product check · same deal, 3 products live
Conventional
25% down · 7.5% · 30yr
- Down + closing
- —
- Monthly P&I
- —
- Monthly cashflow
- —
- DSCR
- —
- Eligible?
- —
Personal DTI + credit; lowest rate.
DSCR
20% down · 8.5% · 30yr
- Down + closing
- —
- Monthly P&I
- —
- Monthly cashflow
- —
- DSCR
- —
- Eligible?
- —
No personal income docs; deal must DSCR.
Hard money
10% down · 12.0% · 12mo
- Down + closing
- —
- Monthly P&I
- —
- Monthly cashflow
- —
- DSCR
- —
- Eligible?
- —
Short-term bridge; refi at stabilization.
Rent comps 25 comps
| Address | Beds | Baths | Sqft | Rent | $/sqft | DOM | Units | Dist |
|---|---|---|---|---|---|---|---|---|
| 750 W Elkcam Cir #315 Marco Island, FL | 2.0 | 2.0 | 990 | $5,600 | $5.66 | 24d | 1 | 0.04mi |
| 761 W Elkcam Cir Unit B110 Marco Island, FL | 2.0 | 2.5 | 1066 | $3,500 | $3.28 | 24d | 1 | 0.07mi |
| 731 W Elkcam Cir Unit A109 Marco Island, FL | 2.0 | 2.5 | 1066 | $2,500 | $2.35 | 24d | 1 | 0.11mi |
| 694 W Elkcam Cir #1123 Marco Island, FL | 2.0 | 2.0 | 945 | $2,530 | $2.68 | 24d | 1 | 0.16mi |
| 651 W Elkcam Cir #815 Marco Island, FL | 2.0 | 2.0 | 813 | $4,700 | $5.78 | 24d | 1 | 0.17mi |
| 457 Tallwood St #106 Marco Island, FL | 1.0 | 1.0 | 539 | $1,600 | $2.97 | 24d | 1 | 0.74mi |
| 591 Seaview Ct Unit A306 Marco Island, FL | 2.0 | 2.0 | 964 | $6,000 | $6.22 | 24d | 1 | 0.95mi |
| 601 Seaview Ct Unit C106 Marco Island, FL | 2.0 | 2.0 | 964 | $5,700 | $5.91 | 24d | 1 | 1.01mi |
| 651 Seaview Ct Unit B207 Marco Island, FL | 2.0 | 2.0 | 1075 | $6,000 | $5.58 | 24d | 1 | 1.02mi |
| 1215 Edington Pl Unit A6 Marco Island, FL | 1.0 | 1.0 | 570 | $4,500 | $7.89 | 22d | 1 | 1.07mi |
| 440 Seaview Ct #912 Marco Island, FL | 2.0 | 2.0 | 1099 | $6,500 | $5.91 | 14d | 1 | 1.10mi |
| 380 Seaview Ct #305 Marco Island, FL | 2.0 | 2.0 | 1100 | $6,000 | $5.45 | 14d | 1 | 1.11mi |
| 260 Seaview Ct #604 Marco Island, FL | 2.0 | 2.0 | 1070 | $8,000 | $7.48 | 14d | 1 | 1.17mi |
| 240 Seaview Ct #413 Marco Island, FL | 1.0 | 1.0 | 750 | $6,500 | $8.67 | 24d | 1 | 1.19mi |
| 240 Seaview Ct #211 Marco Island, FL | 2.0 | 2.0 | 1075 | $11,000 | $10.23 | 22d | 1 | 1.21mi |
| 167 N Collier Blvd Marco Island, FL | 2.0 | 1.0 | 555 | $2,100 | $3.78 | 14d | 2 | 1.22mi |
| 130 N Collier Blvd Unit A6 Marco Island, FL | 2.0 | 1.0 | 704 | $1,900 | $2.70 | 24d | 1 | 1.28mi |
| 180 Seaview Ct Marco Island, FL | 1.0–2.0 | 1.5–2.0 | 721 | $4,500 | $6.24 | 24d | 2 | 1.31mi |
| 140 Seaview Ct Unit 902S Marco Island, FL | 2.0 | 2.0 | 837 | $9,000 | $10.75 | 24d | 1 | 1.32mi |
| 140 Seaview Ct #1504 Marco Island, FL | 1.0 | 1.5 | 610 | $2,200 | $3.61 | 24d | 1 | 1.32mi |
| 60 Pelican St W Naples, FL | 1.0 | 1.0 | 941 | $2,875 | $3.06 | 24d | 2 | 1.33mi |
| 87 N Collier Blvd Unit J16 Marco Island, FL | 2.0 | 1.5 | 787 | $5,550 | $7.05 | 14d | 1 | 1.36mi |
| 87 N Collier Blvd Marco Island, FL | 1.0–2.0 | 1.0–1.5 | 663 | $5,550 | $8.36 | 24d | 3 | 1.38mi |
| 58 N Collier Blvd Marco Island, FL | 2.0 | 2.0 | 1071 | $9,750 | $9.10 | 24d | 2 | 1.46mi |
| 762 San Marco Rd Unit 4-108 Marco Island, FL | 2.0 | 2.0 | 814 | $4,500 | $5.53 | 24d | 1 | 1.47mi |
HOA detail condo
- Monthly dues
- $1,018 · $12,216/yr
- Assessments
- None detected in remarks — confirm with the listing agent.
Listing history 5 events
-
2026-06-21days on market $375,000 Active 4 DOM
-
2026-06-17days on market $375,000 Active 1 DOM
-
2026-06-17days on market $375,000 Active 2 DOM
-
2026-06-15remarks 691-char remark
-
2026-06-15$375,000 Active 1 DOM
ⓘ Source: listings_history table (triggers on properties + properties_extension) + one-shot
backfill from property_details.listing_events for pre-trigger history.
Tax reassessment forecast FL · Resets to sale price
- Current annual tax
- $2,608 · $217/mo
- Projected year-2 tax
- $3,112 · $259/mo
- Expected delta
- +$504/yr (+$42/mo · 19.3%)
ⓘ Screening estimate from a state-policy table — verify with the county assessor before closing.
Climate risk First Street
- Flood 8/10 Severe FEMA zone AE · 97% chance over 30 yrs
- Wildfire 3/10 Moderate
- Heat 10/10 Extreme 7 d/yr ≥108°F today · 31 d/yr by 30 yrs out
- Wind 10/10 Extreme 99% chance of damaging wind over 30 yrs
- Air quality 3/10 Moderate 3 unhealthy d/yr today · 3 by 30 yrs out
Nearby sold comps map
Loading sold comps map…
Walkable amenities ~0.75 mi
Loading nearby amenities…
Taxation est. · year 1
- Rental income
- $61,030
- − Mortgage interest
- −$21,006
- − Property taxes
- −$2,608
- − Insurance
- −$6,994
- − Repairs & maintenance
- −$4,882
- − Management
- −$4,882
- − HOA
- −$12,216
- − Depreciation
- −$10,909
- Taxable loss
- −$2,468
- Est. tax savings @ 24.0%
- +$592
- After-tax cash flow
- $3,390/yr
For passive investors: Depreciation is non-cash, so a rental often shows a tax loss while cash-flowing — sheltering income. Rental losses are passive: they offset passive income freely, and up to $25,000/yr can offset ordinary (W-2) income if you actively participate and your MAGI is under $100k (phasing out to $0 by $150k); unused losses carry forward. On sale, claimed depreciation is recaptured at up to 25%, and gains may owe capital-gains tax (a 1031 exchange can defer both). Figures are a year-1 estimate at your 24.0% rate — not tax advice; consult a CPA.
Schools (NCES district)
- District
- Collier
- NCES district ID
- 1200330
- Math proficiency
- 60% ▼ -4.00%
- Reading proficiency
- 56% ▼ -2.00%
- Median HH income
- $58,275
- Composite
- 50.23/100
- National rank
- #1892
- State rank
- #16 of 73 in FL
Livability — Marco Island
- Score
- 71/100
- State rank
- #404
- US rank
- #7149
Category grades
Schools grade is shown separately in the Schools card above.
Census & demographics
- Census place
- Marco Island, FL
- County
- Collier County · 396,295 people
- City population
- 16,205
- Metro
- Naples-Marco Island, FL
- Population (ZIP)
- 16,205
- Household income
- $101,523
- Rent vs Own
- Severe rent burden
- 314.0
Population outlook (Collier County) Hauer SSP2
- Today (2025)
- 420,858 people
- By 2030
- 450,054 · +6.9%
- By 2040
- 502,232 · +19.3%
- By 2050
- 544,932 · +29.5%
- By 2075
- 627,203 · +49.0%
- By 2100
- 659,015 · +56.6%
Race, ethnicity, and origin ACS 2023
- Neighborhood character
- Predominantly White (90%)
- Race & ethnicity
- White 90% Hispanic / Latino 7% Two or more races 6%
- Hispanic origin (detail)
- Mexican 1% Puerto Rican 1% Cuban 2%
- Common ancestry
- Romanian 5% Lithuanian 2% Slovak 2%
- Foreign-born
- 9% · Canada
- Languages at home
- 90% English-only · Spanish 5% Other Indo-European 1% German/W. Germanic 1%
Political lean MEDSL · Collier
- 2024 margin
- Solid R (+33.1) · D 33.1% · R 66.2%
- 2008→2024 swing
- -10.6pp toward R · 2008: -22.5pp · 2024: -33.1pp
- All cycles
- 2024: R+33.1 2020: R+24.7 2016: R+26.0 2012: R+30.1 2008: R+22.5
Not yet ingested
- Civics
- —
Market trends
- HPI YoY
- ▼ -374.55%
- Current HPI
- 284.7538
- Rent YoY
- ▲ 6.59%
- Metro
- Naples-Marco Island, FL
- State GDP YoY
- ▲ 3.28%
- F500 in state
- 36
Industry mix (Fortune 500 HQ in FL)
| Industry | F500 HQs | Revenue |
|---|---|---|
| Industrial Technology | 2 | $29B |
|
||
| Insurance | 2 | $17B |
|
||
| Retail | 1 | $60B |
|
||
| Technology Distribution | 1 | $58B |
|
||
| Homebuilding | 1 | $35B |
|
||
| Technology Manufacturing | 1 | $35B |
|
||
Price history
+298.9% since first listed9 events — show timeline
- 2026-06-15 Listed $375,000 MIML
- 2021-01-14 Sold (Public Records) $245,000 Public Records
- 2020-12-17 Sold (MLS) $245,000 MIML
- 2020-12-17 Sold (MLS) $245,000 NAPLESMLS
- 2020-10-25 Pending — NAPLESMLS
- 2020-10-07 Listed $260,000 NAPLESMLS
- 2020-09-15 Listed $260,000 MIML
- 2000-09-12 Sold (Public Records) $139,000 Public Records
- 1990-12-01 Sold (Public Records) $94,000 Public Records
Property tax history
+4.4%/yrLatest (2025): $2,608 · -1.7% YoY. Source: county tax records.
Cash-flow waterfall
monthlySold comps — $/sqft
last 12 mo · ≤1 miLoading sold comps…