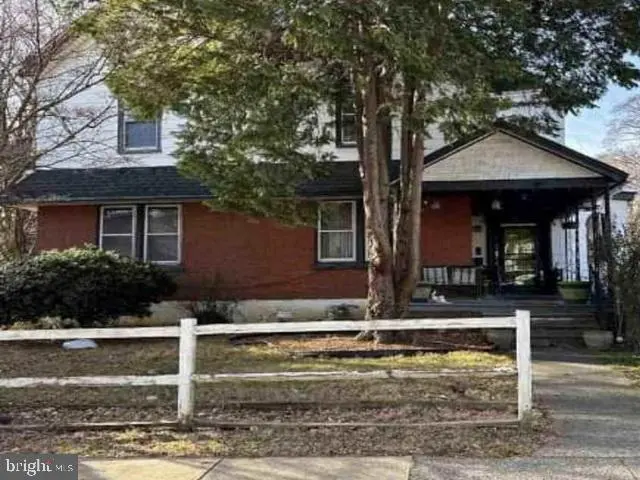
622 Yeadon Ave · Yeadon, PA
Flood risk 5/10 · Moderate
- FEMA flood zone
- X (unshaded)
- Chance of flooding over 30 yrs
- 0.49%
- Est. flood insurance / yr
- $473 – $860
Fire risk 1/10 · Minimal
- Est. fire insurance / yr
- $511 – $949
Heat risk 6/10 · Moderate
- Hot days now (above 103°F)
- 7 days/yr
- Hot days in 30 yrs
- 15 days/yr
Wind risk 6/10 · Moderate
- Chance of severe wind over 30 yrs
- 27.0%
Air-quality risk 4/10 · Minor
- Unhealthy air days now
- 3 days/yr
- Unhealthy air days in 30 yrs
- 6 days/yr
Risk factors via First Street. Map © Google.
Why this score? — see what drove the C grade
The composite is a weighted blend of 9 inputs, each scored 0–100. Each bar is that input's sub-score; the figure is the points it added to the 100-point composite (weight × sub-score).
- Cash flow +22.4/30.0
- ARV discount +7.5/15.0
- DSCR +7.2/10.0
- 1% rule +5.9/10.0
- Rent growth +4.7/5.0
- Livability +3.9/5.0
- Condition / age +2.5/5.0
- Schools +1.7/10.0
- Appreciation +0.0/10.0
$197,700
🖨 Deal sheet 📄 Offer letter ✓ Due diligence
Listing remarks MLS
Built in 1907 and located in the Cobbs Creek neighborhood, this three story home offers approximately 4229 finished square feet, six bedrooms, three full and one half bath, fireplace, full finished basement and sits on an approximate 18295 sqft lot.
Key facts
- 18295 sqft lot
- Three story home
- Fireplace
Tags
Neighborhood map
What this means for you Summary
Snapshot
- This is a 6-bed/3.5-bath single-family listed at $198k.
Deal economics
- At list price, monthly cash flow is $328 ($4k/yr) — positive.
- The deal already cash-flows at list — no discount required.
- Meets the 1% rule at list price ($2k rent vs $198k).
- Recommended offer: $174k (12.0% below list) — sets the bar for market timing.
- Cap rate 8.3% vs local median 2.5% in Yeadon — top-decile yield for the area; either an underpriced asset or a hidden risk that comps aren't pricing in. Stress-test before assuming the spread holds.
Location & tenants
- Location reads 77/100 on livability (#364 in PA, #3,181 nationally) — a middle-class / working-renter tenant base. Strengths: commute A+, cost of living A+, housing A; Watch: schools D+, amenities D+.
- William Penn SD (suburban): math 11% / reading 28% proficiency, ranked #491 of 539 in PA (top 91%) — low school quality limits family demand, transient renter base, plan for 1-2y turnover; 69% free/reduced lunch — lower-income household profile, screen leases tightly.
- Market conditions: Rents rising fast (+8.9%/yr); 94 active listings in the ZIP; 299 units permitted in Delaware County in 2024 (5 in 5+ unit buildings).
- This rent runs 42% of the median local income ($61k/yr) — at the standard rent-burdened threshold; future hikes will face affordability resistance.
Forward outlook
- Local home prices are declining (-3.0%/yr); year-one equity from $1k of loan paydown is wiped out by about $6k of value loss. Plan a longer hold.
- At projected returns (-3.0% appreciation + 8.0% rent growth), your $55k cash investment doubles in ~9 years — after that, you're playing with house money.
Negotiation context
- It's been on market 146 days — a 12% lower offer ($174k) is reasonable based on typical stale-listing flexibility.
- 6 sale attempts since 29y ago; this cycle's ask has dropped $189k (49%) from the opening price — seller is motivated, your offer sets the floor, not the list.
- Current owner paid $114k; list at $198k implies a 74% gain — meaningful room to come down on a strong offer.
Risks & watch-outs
- Watch-outs: built in 1907 — expect roof / HVAC / electrical / plumbing capex.
- Climate carrying-cost: moderate flood risk; major wind risk, 27% chance of damaging wind over 30y; extreme-heat days projected 7→15/yr by 2055 (HVAC capex compounding) — expect insurance premiums to compound above CPI over the hold.
Questions for the listing agent
- It's been on market 146 days. Have you received any prior offers? Is the seller open to a 12% concession, seller financing, or rate buy-down credit?
- Built in 1907 — when were the roof, HVAC, electrical panel, plumbing, and water heater last replaced?
- Why hasn't it sold? Are there any deal-killer items the seller is aware of (foundation, flood, title, zoning, code violations)?
- Is there a deadline driving the sale (1031 exchange, divorce, estate, relocation)? That informs how much negotiation room exists.
- Schools are D-rated, which usually means shorter tenancies and higher turnover. Who's the typical renter profile here, and what's been the actual vacancy rate?
- What's the average days-on-market for RENTAL listings here right now (not sales)? A rising rental-DOM trend means longer vacancies and softer asking-rent achievability than the comps imply.
- What's the recent tenant-quality profile in this submarket — average credit score on applications, eviction rate, late-payment / NSF rate, and stable-employment percentage? A property-management company in the area should have these aggregated.
- How much new for-sale + rental construction is in the pipeline within 1–3 miles? Heavy new supply typically softens prices + rents 12–24 months out; constrained supply supports both.
Investment metrics
- 1% rule
- 1.09% ✓
- Cap rate
- 8.29%
- Cash-on-cash
- 7.12%
- DSCR
- 1.32
- GRM
- 7.7
CMA / ARV
- ARV (median comp)
- $465,540
- List price
- $197,700
- Delta
- -57.53%
- Verdict
- UNDERPRICED
- Comps
- 8 within 1.0 mi
Show comp detail 1 sale within ~0.75 mi
| Address | Dist | Beds/Ba | Sqft | Sold | Price | $/sf | Match |
|---|---|---|---|---|---|---|---|
| 901 Longacre Blvd | 0.27mi | 5/3.0 (-1) | 3,708 (-12%) | 12mo | $549,000 | $148 | 50 |
Match score weights: distance 35% · size 25% · config 20% · recency 20%. Top-matched comps best support the ARV.
Projected returns pro-forma
-3.0% appreciation · 8.0% rent growth · sell at horizon
- IRR
- 0.1%
- Equity multiple
- 1.00×
- Total profit
- $248
- Equity at exit
- $29,478
- IRR
- 14.3%
- Equity multiple
- 2.42×
- Total profit
- $78,877
- Equity at exit
- $17,093
Cash invested: $55,356 (down + closing). Projections, not guarantees.
Landlord ↔ Tenant lean methodology
- Overall (STATE)
- 62 Landlord-Friendly
- State Pennsylvania
- 62 Landlord-Friendly · EVEN
- County
- — inherits STATE
- City
- — inherits STATE
ZIP-level market 19050
- Rents YoY
- 8.9%
- Active inventory
- 94
- Price-to-rent
- 7.7×
Monthly cashflow live
- Estimated rent
- $2,145 medium interval (Pro) →
- Mortgage (P&I)
- −$1,037
- Tax est. 1.5%
- −$247 /mo · $2,966/yr
- Insurance
- −$82
- HOA
- −$0
- Vacancy / Maint / Mgmt
- −$450
- Net cashflow
- $328
Break-even live
UW: 25.0% down · 7.5% · 30yr · 1.5% tax · 5.0% vac · 8.0% maint · 8.0% mgmt
Financing live
Cash to close
- Down payment
- $49,425
- Closing costs
- $5,931
- Reserves months
- —
- Total cash needed
- —
Loan-product check · same deal, 3 products live
Conventional
25% down · 7.5% · 30yr
- Down + closing
- —
- Monthly P&I
- —
- Monthly cashflow
- —
- DSCR
- —
- Eligible?
- —
Personal DTI + credit; lowest rate.
DSCR
20% down · 8.5% · 30yr
- Down + closing
- —
- Monthly P&I
- —
- Monthly cashflow
- —
- DSCR
- —
- Eligible?
- —
No personal income docs; deal must DSCR.
Hard money
10% down · 12.0% · 12mo
- Down + closing
- —
- Monthly P&I
- —
- Monthly cashflow
- —
- DSCR
- —
- Eligible?
- —
Short-term bridge; refi at stabilization.
Listing history 25 events
-
2026-05-14price $197,700 249-char remark
Show marketing remark (249 chars)
Built in 1907 and located in the Cobbs Creek neighborhood, this three story home offers approximately 4229 finished square feet, six bedrooms, three full and one half bath, fireplace, full finished basement and sits on an approximate 18295 sqft lot.
-
2026-04-29price $209,100 249-char remark
Show marketing remark (249 chars)
Built in 1907 and located in the Cobbs Creek neighborhood, this three story home offers approximately 4229 finished square feet, six bedrooms, three full and one half bath, fireplace, full finished basement and sits on an approximate 18295 sqft lot.
-
2026-04-14price $224,000 249-char remark
Show marketing remark (249 chars)
Built in 1907 and located in the Cobbs Creek neighborhood, this three story home offers approximately 4229 finished square feet, six bedrooms, three full and one half bath, fireplace, full finished basement and sits on an approximate 18295 sqft lot.
-
2026-03-30price $253,600 249-char remark
Show marketing remark (249 chars)
Built in 1907 and located in the Cobbs Creek neighborhood, this three story home offers approximately 4229 finished square feet, six bedrooms, three full and one half bath, fireplace, full finished basement and sits on an approximate 18295 sqft lot.
-
2026-03-13price $293,000 249-char remark
Show marketing remark (249 chars)
Built in 1907 and located in the Cobbs Creek neighborhood, this three story home offers approximately 4229 finished square feet, six bedrooms, three full and one half bath, fireplace, full finished basement and sits on an approximate 18295 sqft lot.
-
2026-02-25price $328,800 249-char remark
Show marketing remark (249 chars)
Built in 1907 and located in the Cobbs Creek neighborhood, this three story home offers approximately 4229 finished square feet, six bedrooms, three full and one half bath, fireplace, full finished basement and sits on an approximate 18295 sqft lot.
-
2026-02-05price $347,200 249-char remark
Show marketing remark (249 chars)
Built in 1907 and located in the Cobbs Creek neighborhood, this three story home offers approximately 4229 finished square feet, six bedrooms, three full and one half bath, fireplace, full finished basement and sits on an approximate 18295 sqft lot.
-
2026-01-20price $363,400 249-char remark
Show marketing remark (249 chars)
Built in 1907 and located in the Cobbs Creek neighborhood, this three story home offers approximately 4229 finished square feet, six bedrooms, three full and one half bath, fireplace, full finished basement and sits on an approximate 18295 sqft lot.
-
2025-12-31$386,900 Active 249-char remark
Show marketing remark (249 chars)
Built in 1907 and located in the Cobbs Creek neighborhood, this three story home offers approximately 4229 finished square feet, six bedrooms, three full and one half bath, fireplace, full finished basement and sits on an approximate 18295 sqft lot.
-
2021-08-30historical
-
2021-07-22$305,000 Active
-
2005-02-04soldstatus $113,500
-
2005-01-24soldstatus $113,500
-
2005-01-24soldstatus $113,500
-
2004-11-10historical
-
2004-11-10historical
-
2004-10-14$113,500
-
2004-10-14$113,500
-
1998-07-15soldstatus $146,400
-
1998-07-10soldstatus $146,400
-
1998-04-10historical
-
1997-07-14$146,400
-
1997-07-14historical
-
1997-07-14$155,000
-
1985-07-02soldstatus $66,900
ⓘ Source: listings_history table (triggers on properties + properties_extension) + one-shot
backfill from property_details.listing_events for pre-trigger history.
Climate risk First Street
- Flood 5/10 Major FEMA zone X (unshaded) · 49% chance over 30 yrs
- Wildfire 1/10 Low
- Heat 6/10 Major 7 d/yr ≥103°F today · 15 d/yr by 30 yrs out
- Wind 6/10 Major 27% chance of damaging wind over 30 yrs
- Air quality 4/10 Moderate 3 unhealthy d/yr today · 6 by 30 yrs out
Nearby sold comps map
Loading sold comps map…
Walkable amenities ~0.75 mi
Loading nearby amenities…
Taxation est. · year 1
- Rental income
- $25,742
- − Mortgage interest
- −$11,074
- − Property taxes
- −$2,966
- − Insurance
- −$988
- − Repairs & maintenance
- −$2,059
- − Management
- −$2,059
- − Depreciation
- −$5,751
- Taxable income
- $843
- Est. tax owed @ 24.0%
- −$202
- After-tax cash flow
- $3,738/yr
For passive investors: Depreciation is non-cash, so a rental often shows a tax loss while cash-flowing — sheltering income. Rental losses are passive: they offset passive income freely, and up to $25,000/yr can offset ordinary (W-2) income if you actively participate and your MAGI is under $100k (phasing out to $0 by $150k); unused losses carry forward. On sale, claimed depreciation is recaptured at up to 25%, and gains may owe capital-gains tax (a 1031 exchange can defer both). Figures are a year-1 estimate at your 24.0% rate — not tax advice; consult a CPA.
Schools (NCES district)
- District
- William Penn SD
- NCES district ID
- 4226390
- Math proficiency
- 11% ▼ -3.00%
- Reading proficiency
- 28% ▼ -7.00%
- Median HH income
- $48,543
- Composite
- 17.29/100
- National rank
- #9086
- State rank
- #491 of 539 in PA
Livability — Yeadon
- Score
- 77/100
- State rank
- #364
- US rank
- #3181
Category grades
Schools grade is shown separately in the Schools card above.
Census & demographics
- Census place
- Yeadon, PA
- County
- Delaware County · 399,863 people
- Metro
- Philadelphia-Camden-Wilmington, PA-NJ-DE-MD
- Population (ZIP)
- 29,373
- Household income
- $60,859
- Rent vs Own
- Severe rent burden
- 1738.0
Population outlook (Delaware County) Hauer SSP2
- Today (2025)
- 577,490 people
- By 2030
- 581,243 · +0.6%
- By 2040
- 584,700 · +1.2%
- By 2050
- 586,581 · +1.6%
- By 2075
- 598,706 · +3.7%
- By 2100
- 590,823 · +2.3%
Race, ethnicity, and origin ACS 2023
- Neighborhood character
- Predominantly Black (67%)
- Race & ethnicity
- Black 67% White 22% Two or more races 5% Hispanic / Latino 5% Asian 2%
- Common ancestry
- Swiss 4% Hispanic 3% Lithuanian 1%
- Foreign-born
- 17% · Canada, United Kingdom, Vietnam
- Languages at home
- 84% English-only · French/Haitian/Cajun 5% Spanish 3% Other Indo-European 1%
Political lean MEDSL · Delaware
- 2024 margin
- Strong D (+23.7) · D 61.4% · R 37.6% · Other 1.0%
- 2008→2024 swing
- +2.3pp toward D · 2008: 21.4pp · 2024: 23.7pp
- All cycles
- 2024: D+23.7 2020: D+26.7 2016: D+22.0 2012: D+21.8 2008: D+21.4
Not yet ingested
- Civics
- —
Market trends
- HPI YoY
- ▼ -202.83%
- Current HPI
- 287.6419
- Rent YoY
- ▲ 8.87%
- Metro
- Philadelphia-Camden-Wilmington, PA-NJ-DE-MD
- State GDP YoY
- ▲ 1.68%
- F500 in state
- 34
Industry mix (Fortune 500 HQ in PA)
| Industry | F500 HQs | Revenue |
|---|---|---|
| Healthcare | 2 | $309B |
|
||
| Insurance | 2 | $27B |
|
||
| Telecommunications / Media | 1 | $124B |
|
||
| Industrial Distribution | 1 | $22B |
|
||
| Financial Services | 1 | $20B |
|
||
| Chemicals / Materials | 1 | $18B |
|
||
Price history
+195.5% since first listed25 events — show timeline
- 2026-05-14 Price Changed $197,700 BRIGHT MLS
- 2026-04-29 Price Changed $209,100 BRIGHT MLS
- 2026-04-14 Price Changed $224,000 BRIGHT MLS
- 2026-03-30 Price Changed $253,600 BRIGHT MLS
- 2026-03-13 Price Changed $293,000 BRIGHT MLS
- 2026-02-25 Price Changed $328,800 BRIGHT MLS
- 2026-02-05 Price Changed $347,200 BRIGHT MLS
- 2026-01-20 Price Changed $363,400 BRIGHT MLS
- 2025-12-31 Listed $386,900 BRIGHT MLS
- 2021-08-30 Listing Removed — BRIGHT MLS
- 2021-07-22 Listed $305,000 BRIGHT MLS
- 2005-02-04 Sold (Public Records) $113,500 Public Records
- 2005-01-24 Sold (MLS) $113,500 BRIGHT MLS
- 2005-01-24 Sold (MLS) $113,500 BRIGHT MLS
- 2004-11-10 Listing Removed — BRIGHT MLS
- 2004-11-10 Listing Removed — BRIGHT MLS
- 2004-10-14 Listed $113,500 BRIGHT MLS
- 2004-10-14 Listed $113,500 BRIGHT MLS
- 1998-07-15 Sold (Public Records) $146,400 Public Records
- 1998-07-10 Sold (MLS) $146,400 BRIGHT MLS
- 1998-04-10 Listing Removed — BRIGHT MLS
- 1997-07-14 Listed $155,000 BRIGHT MLS
- 1997-07-14 Listing Removed — BRIGHT MLS
- 1997-07-14 Listed $146,400 BRIGHT MLS
- 1985-07-02 Sold (Public Records) $66,900 Public Records
Property tax history
+7.4%/yrLatest (2026): $23,619 · +92.4% YoY. Source: county tax records.
Cash-flow waterfall
monthlySold comps — $/sqft
last 12 mo · ≤1 miLoading sold comps…