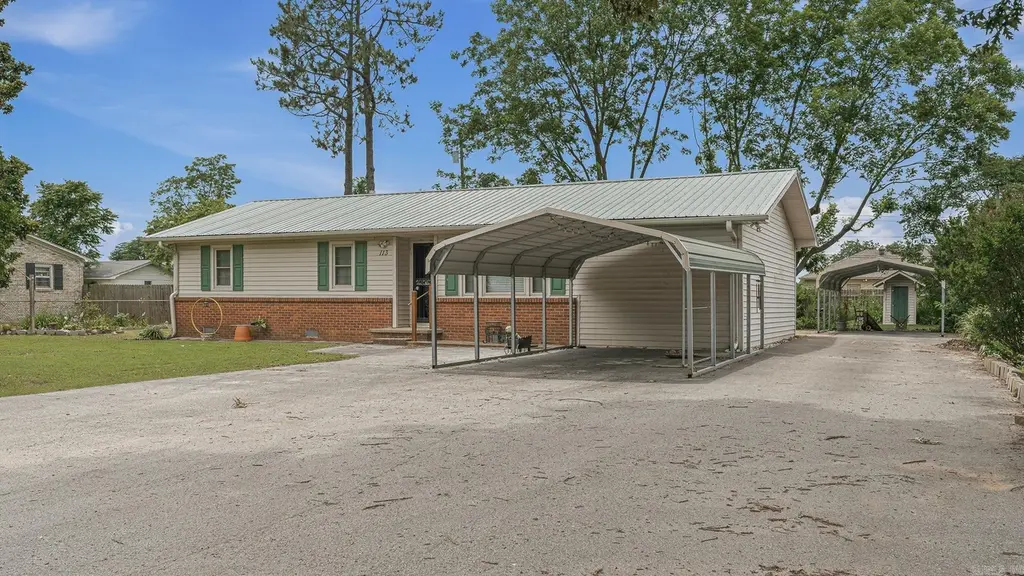
113 Stone · Lake City, AR
Flood risk 1/10 · Minimal
- FEMA flood zone
- X
- Chance of flooding over 30 yrs
- 0.0%
- Est. flood insurance / yr
- $507 – $1,088
Fire risk 1/10 · Minimal
- Est. fire insurance / yr
- $1,499 – $2,785
Heat risk 6/10 · Moderate
- Hot days now (above 109°F)
- 7 days/yr
- Hot days in 30 yrs
- 22 days/yr
Wind risk 4/10 · Minor
- Chance of severe wind over 30 yrs
- 9.0%
Air-quality risk 2/10 · Minimal
- Unhealthy air days now
- 1 days/yr
- Unhealthy air days in 30 yrs
- 1 days/yr
Risk factors via First Street. Map © Google.
Why this score? — see what drove the C grade
The composite is a weighted blend of 9 inputs, each scored 0–100. Each bar is that input's sub-score; the figure is the points it added to the 100-point composite (weight × sub-score).
- ARV discount +15.0/15.0
- Cash flow +13.5/30.0
- Appreciation +10.0/10.0
- DSCR +4.1/10.0
- 1% rule +3.8/10.0
- Livability +3.2/5.0
- Schools +3.1/10.0
- Rent growth +2.5/5.0
- Condition / age +2.5/5.0
$179,000
🖨 Deal sheet 📄 Offer letter ✓ Due diligence
Listing remarks MLS
Just listed 113 Stone, Lake Cit. Spacious Family Home. This charming 4 bedroom 2 full bath home offers 1728' of comfortable living space and sits on a large lot on a quiet dead end street. Perfect for families looking to grow, entertain, and enjoy the outdoors. Features include large kitchen, two living areas, newer Ac(2025), metal roof, storm shelter, shop with garage door, two carports, three sided chain link fence, well for outside sprinklers and gardening, City park at the end of the dead end street and school within walking distance. Schedule your showing today!
Key facts
- Newer ac
- Metal roof
- Large kitchen
Tags
Property features AI
Finance
- Other: Low-E windows and insulated doors/windows for energy efficiency
- Financial info: Financing options include VA, FHA, conventional, cash, rural development, and in-house financing
- HOA & community: Community playground and picnic area; no fee
Exterior
- Parking: Carport for 2 cars
- Utilities: Public sewer; Public water; Municipal electric (Entergy); Internet — wireless
- Home design: Brick, brick & frame combo, and metal/vinyl siding exterior
- Construction: Metal roof; Crawl space and slab foundation
- Exterior features: Patio; Porch; Partial fencing (chain link); Gutters; Storm cellar; Shop/outbuilding; Paved road access; Level lot; Extra landscaping; Inside city limits; Located in a subdivision; Playground and picnic area in community (no fee)
Interior
- Kitchen: Free-standing stove; Dishwasher; Ice maker connection
- Flooring: Carpet; Vinyl
- Bathrooms: 2 full bathrooms
- Heating & cooling: Central heat (gas); Central electric cooling
- Interior features: Washer connection; Dryer connection (electric); Gas water heater; Ceiling fans; Formica kitchen countertops; Gas-log fireplace; Sheetrock walls/ceilings
- Laundry & utility: Washer connection; Dryer connection (electric)
Neighborhood map
What this means for you Summary
Snapshot
- This is a 4-bed/1.5-bath single-family listed at $179k.
Deal economics
- At list price, monthly cash flow is $7 ($87/yr) — positive.
- The deal already cash-flows at list — no discount required.
- To meet the 1% rule (rent ≥ 1% of price), the offer needs to be $158k (12.0% below list).
- Recommended offer: $158k (12.0% below list) — sets the bar for 1% rule.
- Cap rate 6.3% vs local median 5.2% in Lake City — meaningfully above typical; check what's discounted (condition, days-on-market, listing class) to confirm the premium yield is real.
Location & tenants
- Location reads 64/100 on livability (#180 in AR) — a middle-class / working-renter tenant base. Strengths: cost of living A+, housing A+, crime A; Watch: amenities F, commute F, employment D-.
- Riverside School District (rural): math 32% / reading 42% proficiency, ranked #103 of 238 in AR (top 43%) — families likely to look elsewhere, expect single-tenant / working-renter base with shorter leases.
- Zoned schools: Riverside East Elem. School (math 27% / reading 32%, grade F, #305 of 454 statewide, top 71%, 147 students, 75% FRL); Riverside High School (math 27% / reading 40%, grade F, #112 of 292 statewide, top 39%, 331 students, 47% FRL).
- Market conditions: 35 active listings in the ZIP; 1 comparable units currently listed for rent nearby; 926 units permitted in Craighead County in 2024 (69 in 5+ unit buildings).
Forward outlook
- In year one you build about $19k of equity ($1k loan paydown + $18k appreciation (10.0% local appreciation)).
- Craighead County population projected at +38% by 2050 — long-run rental-demand tailwind backs the buy-and-hold thesis.
- At projected returns (10.0% appreciation + 3.0% rent growth), your $50k cash investment doubles in ~3 years — after that, you're playing with house money.
- By year 2, paydown + projected appreciation supports a ~$31k cash-out refi (75% LTV) — recoverable capital for the next deal without selling this one.
Negotiation context
- Only 11 days on market — expect competitive offers; lowballing is unlikely to land.
- 2 sale attempts with the ask held roughly flat each time — persistent listings suggest the price (not the market) is what's stuck; bring a comps-based counter.
Risks & watch-outs
- Climate carrying-cost: extreme-heat days projected 7→22/yr by 2055 (HVAC capex compounding) — expect insurance premiums to compound above CPI over the hold.
Questions for the listing agent
- Is there a deadline driving the sale (1031 exchange, divorce, estate, relocation)? That informs how much negotiation room exists.
- Schools are D-rated, which usually means shorter tenancies and higher turnover. Who's the typical renter profile here, and what's been the actual vacancy rate?
- What's the average days-on-market for RENTAL listings here right now (not sales)? A rising rental-DOM trend means longer vacancies and softer asking-rent achievability than the comps imply.
- What's the recent tenant-quality profile in this submarket — average credit score on applications, eviction rate, late-payment / NSF rate, and stable-employment percentage? A property-management company in the area should have these aggregated.
- How much new for-sale + rental construction is in the pipeline within 1–3 miles? Heavy new supply typically softens prices + rents 12–24 months out; constrained supply supports both.
Investment metrics
- 1% rule
- 0.88% ✗
- Cap rate
- 6.34%
- Cash-on-cash
- 0.17%
- DSCR
- 1.01
- GRM
- 9.5
CMA / ARV
- ARV (on-the-fly)
- $274,752
- Comps found
- 11
Show comp detail 11 sales within ~0.75 mi
| Address | Dist | Beds/Ba | Sqft | Sold | Price | $/sf | Match |
|---|---|---|---|---|---|---|---|
| 119 Cherry | 0.27mi | 4/2.0 | 1,754 (+2%) | 4mo | $98,000 | $56 | 80 |
| 1407 Pamela | 0.34mi | 3/2.0 (-1) | 1,675 (-3%) | 5mo | $277,435 | $166 | 68 |
| 1401 Pamela Dr | 0.34mi | 3/2.0 (-1) | 1,850 (+7%) | 6mo | $299,900 | $162 | 61 |
| 118 Pecan | 0.09mi | 4/2.0 | 1,575 (-9%) | 22mo | $230,000 | $146 | 60 |
| 1404 Pamela Dr | 0.32mi | 3/2.0 (-1) | 1,670 (-3%) | 15mo | $260,000 | $156 | 60 |
| 118 Pecan | 0.10mi | 4/2.0 | 1,575 (-9%) | 22mo | $230,000 | $146 | 60 |
| 1402 Pamela Dr | 0.33mi | 3/2.0 (-1) | 1,600 (-7%) | 13mo | $266,900 | $167 | 54 |
| 1412 Pamela | 0.64mi | 3/2.0 (-1) | 1,650 (-4%) | 12mo | $285,000 | $173 | 46 |
| 1400 Pamela Dr | 0.64mi | 3/2.0 (-1) | 1,850 (+7%) | 8mo | $295,000 | $159 | 45 |
| 1404 Jordan St | 0.65mi | 3/2.0 (-1) | 1,570 (-9%) | 7mo | $249,900 | $159 | 42 |
| 1101 Dealyn St | 0.65mi | 3/1.0 (-1) | 1,524 (-12%) | 4mo | $157,000 | $103 | 40 |
Match score weights: distance 35% · size 25% · config 20% · recency 20%. Top-matched comps best support the ARV.
Projected returns pro-forma
9.97% appreciation · 3.0% rent growth · sell at horizon
- IRR
- 24.3%
- Equity multiple
- 2.95×
- Total profit
- $97,573
- Equity at exit
- $160,833
- IRR
- 21.6%
- Equity multiple
- 6.72×
- Total profit
- $286,913
- Equity at exit
- $346,392
Cash invested: $50,120 (down + closing). Projections, not guarantees.
Landlord ↔ Tenant lean methodology
- Overall (STATE)
- 92 Strongly Landlord-Friendly
- State Arkansas
- 92 Strongly Landlord-Friendly · R+14
- County
- — inherits STATE
- City
- — inherits STATE
ZIP-level market 72437
- Home prices YoY
- 3.5%
- Active inventory
- 35
- Price-to-rent
- 9.5×
Monthly cashflow live
- Estimated rent
- $1,575 medium interval (Pro) →
- Mortgage (P&I)
- −$939
- Tax est. 1.5%
- −$224 /mo · $2,685/yr
- Insurance
- −$75
- HOA
- −$0
- Vacancy / Maint / Mgmt
- −$331
- Net cashflow
- $7
Break-even live
UW: 25.0% down · 7.5% · 30yr · 1.5% tax · 5.0% vac · 8.0% maint · 8.0% mgmt
Financing live
Cash to close
- Down payment
- $44,750
- Closing costs
- $5,370
- Reserves months
- —
- Total cash needed
- —
Loan-product check · same deal, 3 products live
Conventional
25% down · 7.5% · 30yr
- Down + closing
- —
- Monthly P&I
- —
- Monthly cashflow
- —
- DSCR
- —
- Eligible?
- —
Personal DTI + credit; lowest rate.
DSCR
20% down · 8.5% · 30yr
- Down + closing
- —
- Monthly P&I
- —
- Monthly cashflow
- —
- DSCR
- —
- Eligible?
- —
No personal income docs; deal must DSCR.
Hard money
10% down · 12.0% · 12mo
- Down + closing
- —
- Monthly P&I
- —
- Monthly cashflow
- —
- DSCR
- —
- Eligible?
- —
Short-term bridge; refi at stabilization.
Rent comps 1 comps
| Address | Beds | Baths | Sqft | Rent | $/sqft | DOM | Units | Dist |
|---|---|---|---|---|---|---|---|---|
| 1997 Teal Cv Lake City, AR | 3.0 | 2.0 | 1263 | $1,575 | $1.25 | 43d | 1 | 0.08mi |
Listing history 9 events
-
2026-06-17status $179,000 Under Contract 11 DOM
-
2026-06-16days on market $179,000 Active 11 DOM
-
2026-06-15days on market $179,000 Active 10 DOM
-
2026-06-14days on market $179,000 Active 8 DOM
-
2026-06-12statusdays on market $179,000 Active 7 DOM
-
2026-06-09days on market $179,000 New Listing 4 DOM
-
2026-06-08days on market $179,000 New Listing 3 DOM
-
2026-06-07remarks 573-char remark
-
2026-06-07$179,000 New Listing 2 DOM
ⓘ Source: listings_history table (triggers on properties + properties_extension) + one-shot
backfill from property_details.listing_events for pre-trigger history.
Climate risk First Street
- Flood 1/10 Low FEMA zone X · 0% chance over 30 yrs
- Wildfire 1/10 Low
- Heat 6/10 Major 7 d/yr ≥109°F today · 22 d/yr by 30 yrs out
- Wind 4/10 Moderate 9% chance of damaging wind over 30 yrs
- Air quality 2/10 Low 1 unhealthy d/yr today · 1 by 30 yrs out
Nearby sold comps map
Loading sold comps map…
Walkable amenities ~0.75 mi
Loading nearby amenities…
Taxation est. · year 1
- Rental income
- $18,900
- − Mortgage interest
- −$10,027
- − Property taxes
- −$2,685
- − Insurance
- −$895
- − Repairs & maintenance
- −$1,512
- − Management
- −$1,512
- − Depreciation
- −$5,207
- Taxable loss
- −$2,938
- Est. tax savings @ 24.0%
- +$705
- After-tax cash flow
- $792/yr
For passive investors: Depreciation is non-cash, so a rental often shows a tax loss while cash-flowing — sheltering income. Rental losses are passive: they offset passive income freely, and up to $25,000/yr can offset ordinary (W-2) income if you actively participate and your MAGI is under $100k (phasing out to $0 by $150k); unused losses carry forward. On sale, claimed depreciation is recaptured at up to 25%, and gains may owe capital-gains tax (a 1031 exchange can defer both). Figures are a year-1 estimate at your 24.0% rate — not tax advice; consult a CPA.
Schools (NCES district)
- District
- Riverside School District
- NCES district ID
- 0500012
- Math proficiency
- 32% ▼ -14.00%
- Reading proficiency
- 42% ▼ -9.00%
- Median HH income
- $37,959
- Composite
- 30.82/100
- National rank
- #6136
- State rank
- #103 of 238 in AR
Livability — Lake City
- Score
- 64/100
- State rank
- #180
- US rank
- #14568
Category grades
Schools grade is shown separately in the Schools card above.
Census & demographics
- Census place
- Lake City, AR
- Population (ZIP)
- 3,386
Population outlook (Craighead County) Hauer SSP2
- Today (2025)
- 122,235 people
- By 2030
- 131,338 · +7.4%
- By 2040
- 149,862 · +22.6%
- By 2050
- 168,034 · +37.5%
- By 2075
- 208,094 · +70.2%
- By 2100
- 233,251 · +90.8%
Race, ethnicity, and origin ACS 2023
- Neighborhood character
- Predominantly White (94%)
- Race & ethnicity
- White 94% Two or more races 4% Black 1%
- Common ancestry
- Italian 2% Slovak 2% Iranian 1%
- Languages at home
- 99% English-only · Spanish 1%
Political lean MEDSL · Craighead
- 2024 margin
- Solid R (+37.4) · D 30.1% · R 67.5% · Other 2.4%
- 2008→2024 swing
- -12.9pp toward R · 2008: -24.5pp · 2024: -37.4pp
- All cycles
- 2024: R+37.4 2020: R+35.4 2016: R+35.2 2012: R+31.1 2008: R+24.5
Not yet ingested
- Civics
- —
Market trends
- HPI YoY
- ▲ 9.97%
- Current HPI
- 295.1637
- Rent YoY
- —
- Metro
- —
- State GDP YoY
- ▲ 3.80%
- F500 in state
- 10
Industry mix (Fortune 500 HQ in AR)
| Industry | F500 HQs | Revenue |
|---|---|---|
| Retail | 1 | $681B |
|
||
| Food / Agriculture | 1 | $53B |
|
||
| Retail / Energy | 1 | $22B |
|
||
| Transportation / Logistics | 1 | $12B |
|
||
| Energy | 1 | $4B |
|
||
Price history
+0.0% since first listed2 events — show timeline
- 2026-06-04 Listed $179,000 CARMLS
- 2026-06-04 Listed $179,000 NEABOR MLS
Property tax history
-7.9%/yrLatest (2025): $159 · -38.6% YoY. Source: county tax records.
Cash-flow waterfall
monthlySold comps — $/sqft
last 12 mo · ≤1 miLoading sold comps…