1313 Hatfield Ln · Birmingham, AL
Flood risk 1/10 · Minimal
- FEMA flood zone
- X (unshaded)
- Chance of flooding over 30 yrs
- 0.0%
- Est. flood insurance / yr
- $473 – $860
Fire risk 2/10 · Minimal
- Est. fire insurance / yr
- $916 – $1,700
Heat risk 6/10 · Moderate
- Hot days now (above 105°F)
- 7 days/yr
- Hot days in 30 yrs
- 19 days/yr
Wind risk 6/10 · Moderate
- Chance of severe wind over 30 yrs
- 27.0%
Air-quality risk 5/10 · Moderate
- Unhealthy air days now
- 7 days/yr
- Unhealthy air days in 30 yrs
- 9 days/yr
Risk factors via First Street. Map © Google.
Why this score? — see what drove the C grade
The composite is a weighted blend of 9 inputs, each scored 0–100. Each bar is that input's sub-score; the figure is the points it added to the 100-point composite (weight × sub-score).
- Cash flow +21.8/30.0
- ARV discount +15.0/15.0
- DSCR +7.0/10.0
- 1% rule +5.5/10.0
- Livability +3.4/5.0
- Rent growth +3.3/5.0
- Condition / age +2.5/5.0
- Schools +0.9/10.0
- Appreciation +0.0/10.0
$140,000
🖨 Deal sheet 📄 Offer letter ✓ Due diligence
Listing remarks
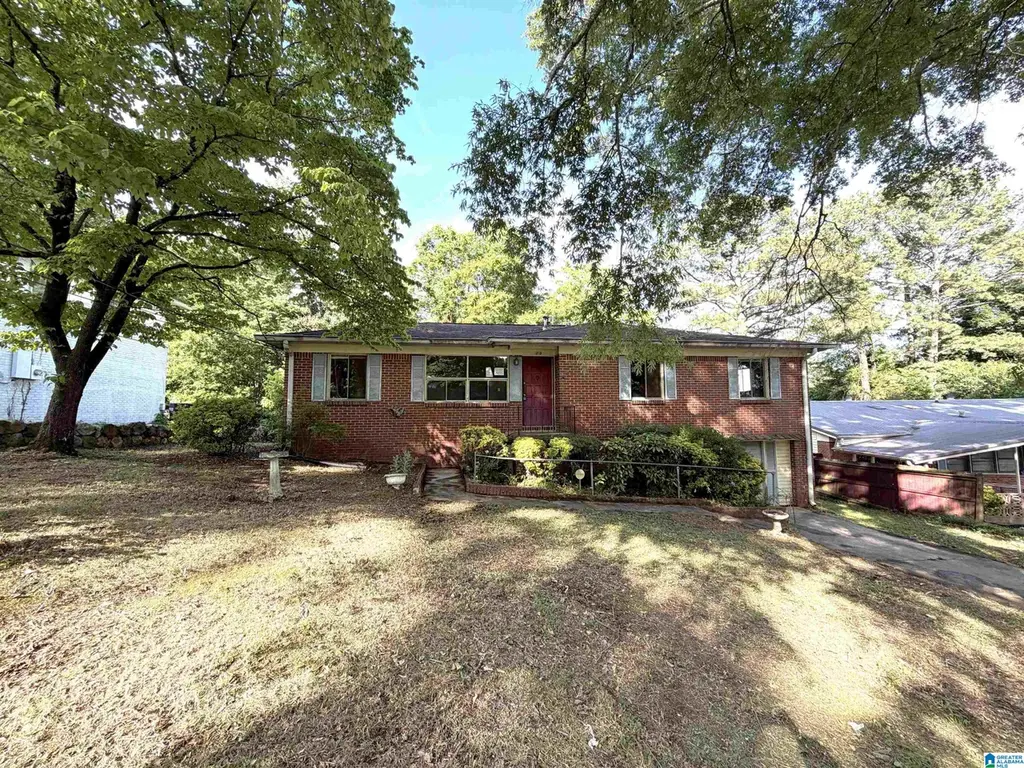
Classic brick split-level home offering strong curb appeal and exceptional potential for the right buyer. Nestled on a spacious lot with mature trees, this property features a timeless exterior, private driveway, and lower-level access. Inside, the home offers a functional layout with generous living spaces, abundant natural light, and a kitchen with ample cabinet storage and workspace. The rear deck overlooks the backyard and provides a great setting for outdoor entertaining or relaxing. The lower level offers additional flexibility for storage, workspace, or future customization. With its solid structure, established neighborhood setting, and opportunity to personalize, this property pres
Key facts
- Private driveway
- Spacious lot
- Lower-level access
Tags
Property features AI
Finance
- Other: Subdivision: EAST HAVEN
- HOA & community: No association fee
Exterior
- Parking: Driveway parking
- Utilities: Public water; Connected sewer; Electric water heater; Internet service availability unknown
- Home design: Existing single-family home; Four-side brick construction
- Construction: Basement foundation; Finished basement
- Exterior features: Open deck; No pool, patio, or garden/patio listed; Not waterfront; Located in flood-free area
Interior
- Kitchen: Laminate countertops; Built-in dishwasher
- Bedrooms: Three bedrooms on main level
- Flooring: Carpet; Vinyl
- Bathrooms: One full bathroom; One half bathroom; Tub/shower combo
- Heating & cooling: Central heating; Central air conditioning; Ceiling fans
- Interior features: Finished full basement with concrete block construction; Ceilings: see remarks; No additional built-in interior features listed
- Laundry & utility: Electric water heater
Neighborhood map
What this means for you Summary
Snapshot
- This is a 3-bed/1.5-bath single-family listed at $140k.
Deal economics
- At list price, monthly cash flow is $217 ($3k/yr) — positive.
- The deal already cash-flows at list — no discount required.
- Meets the 1% rule at list price ($1k rent vs $140k).
- Recommended offer: $136k (3.0% below list) — sets the bar for market timing.
- Cap rate 8.2% vs local median 6.2% in Birmingham — top-decile yield for the area; either an underpriced asset or a hidden risk that comps aren't pricing in. Stress-test before assuming the spread holds.
Location & tenants
- Location reads 67/100 on livability (#78 in AL) — a middle-class / working-renter tenant base. Strengths: commute A+, cost of living A+, housing A+; Watch: amenities C-, crime F, employment F.
- Birmingham City (urban): math 4% / reading 20% proficiency, ranked #116 of 129 in AL (top 90%) — low school quality limits family demand, transient renter base, plan for 1-2y turnover; 82% free/reduced lunch — lower-income household profile, screen leases tightly.
- Zoned schools: Huffman Academy (math 0% / reading 17%, grade F, #594 of 627 statewide, top 95%, 735 students, 79% FRL); Huffman High Schoolmagnet (math 2% / reading 2%, grade F, #291 of 305 statewide, top 100%, 1,147 students, 72% FRL).
- Market conditions: Rents rising (+3.0%/yr); 334 active listings in the ZIP; 12 comparable units currently listed for rent nearby; rentals lingering (median 44d on market — plan ~5-8 weeks vacancy on turnover, expect pricing pressure); 58% of comp listings sitting > 30 days — soft ceiling on asking rent; 2,114 units permitted in Jefferson County in 2024 (556 in 5+ unit buildings).
- This rent runs 33% of the median local income ($53k/yr) — at the standard rent-burdened threshold; future hikes will face affordability resistance.
Forward outlook
- Local home prices are declining (-3.0%/yr); year-one equity from $968 of loan paydown is wiped out by about $4k of value loss. Plan a longer hold.
- Jefferson County population projected to shrink 4% by 2050 — rents likely to lag national; underwrite the cash flow, not the appreciation.
Negotiation context
- It's been on market 44 days — a 3% lower offer ($136k) is reasonable based on typical stale-listing flexibility.
- Current owner paid $87k; list at $140k implies a 60% gain — meaningful room to come down on a strong offer.
Risks & watch-outs
- Watch-outs: built in 1958 — expect roof / HVAC / electrical / plumbing capex.
- Climate carrying-cost: major wind risk, 27% chance of damaging wind over 30y; extreme-heat days projected 7→19/yr by 2055 (HVAC capex compounding) — expect insurance premiums to compound above CPI over the hold.
Questions for the listing agent
- It's been on market 44 days. Have you received any prior offers? Is the seller open to a 3% concession, seller financing, or rate buy-down credit?
- Built in 1958 — when were the roof, HVAC, electrical panel, plumbing, and water heater last replaced?
- Is there a deadline driving the sale (1031 exchange, divorce, estate, relocation)? That informs how much negotiation room exists.
- Schools are F-rated, which usually means shorter tenancies and higher turnover. Who's the typical renter profile here, and what's been the actual vacancy rate?
- Crime grade is F in this area — have there been break-ins, vandalism, or insurance claims at this property in the last 3 years? What carrier currently insures it and at what premium?
- What's the average days-on-market for RENTAL listings here right now (not sales)? A rising rental-DOM trend means longer vacancies and softer asking-rent achievability than the comps imply.
- What's the recent tenant-quality profile in this submarket — average credit score on applications, eviction rate, late-payment / NSF rate, and stable-employment percentage? A property-management company in the area should have these aggregated.
- How much new for-sale + rental construction is in the pipeline within 1–3 miles? Heavy new supply typically softens prices + rents 12–24 months out; constrained supply supports both.
Investment metrics
- 1% rule
- 1.05% ✓
- Cap rate
- 8.16%
- Cash-on-cash
- 6.66%
- DSCR
- 1.30
- GRM
- 7.9
CMA / ARV
- ARV (median comp)
- $171,525
- List price
- $140,000
- Delta
- -18.38%
- Verdict
- UNDERPRICED
- Comps
- 20 within 1.0 mi
Show comp detail 6 sales within ~0.75 mi
| Address | Dist | Beds/Ba | Sqft | Sold | Price | $/sf | Match |
|---|---|---|---|---|---|---|---|
| 1309 Hartford Dr | 0.07mi | 3/2.0 | 2,326 (-5%) | 10mo | $159,900 | $69 | 78 |
| 264 NE 13th Ave | 0.12mi | 3/1.5 | 2,292 (-7%) | 15mo | $85,000 | $37 | 71 |
| 125 13th Ave NE | 0.33mi | 3/2.0 | 2,158 (-12%) | 20mo | $185,000 | $86 | 46 |
| 724 Sunny Lane Dr | 0.60mi | 4/3.0 (+1) | 2,759 (+12%) | 6mo | $235,000 | $85 | 36 |
| 213 16th Ave NW | 0.66mi | 4/2.0 (+1) | 2,578 (+5%) | 22mo | $220,000 | $85 | 35 |
| 100 Nekoma Dr | 0.66mi | 4/2.0 (+1) | 2,190 (-11%) | 14mo | $130,000 | $59 | 32 |
Match score weights: distance 35% · size 25% · config 20% · recency 20%. Top-matched comps best support the ARV.
Projected returns pro-forma
-3.0% appreciation · 3.04% rent growth · sell at horizon
- IRR
- -6.0%
- Equity multiple
- 0.78×
- Total profit
- $-8,770
- Equity at exit
- $20,874
- IRR
- 3.7%
- Equity multiple
- 1.27×
- Total profit
- $10,472
- Equity at exit
- $12,105
Cash invested: $39,200 (down + closing). Projections, not guarantees.
Landlord ↔ Tenant lean methodology
- Overall (STATE)
- 90 Strongly Landlord-Friendly
- State Alabama
- 90 Strongly Landlord-Friendly · R+15
- County
- — inherits STATE
- City
- — inherits STATE
ZIP-level market 35215
- Home prices YoY
- -34.4%
- Rents YoY
- 3.0%
- Active inventory
- 334
- Price-to-rent
- 7.9×
Monthly cashflow live
- Estimated rent
- $1,471 high interval (Pro) →
- Mortgage (P&I)
- −$734
- Tax from tax record
- −$152 /mo · $1,823/yr
- Insurance
- −$58
- HOA
- −$0
- Vacancy / Maint / Mgmt
- −$309
- Net cashflow
- $217
Break-even live
UW: 25.0% down · 7.5% · 30yr · 1.5% tax · 5.0% vac · 8.0% maint · 8.0% mgmt
Financing live
Cash to close
- Down payment
- $35,000
- Closing costs
- $4,200
- Reserves months
- —
- Total cash needed
- —
Loan-product check · same deal, 3 products live
Conventional
25% down · 7.5% · 30yr
- Down + closing
- —
- Monthly P&I
- —
- Monthly cashflow
- —
- DSCR
- —
- Eligible?
- —
Personal DTI + credit; lowest rate.
DSCR
20% down · 8.5% · 30yr
- Down + closing
- —
- Monthly P&I
- —
- Monthly cashflow
- —
- DSCR
- —
- Eligible?
- —
No personal income docs; deal must DSCR.
Hard money
10% down · 12.0% · 12mo
- Down + closing
- —
- Monthly P&I
- —
- Monthly cashflow
- —
- DSCR
- —
- Eligible?
- —
Short-term bridge; refi at stabilization.
Rent comps 12 comps
| Address | Beds | Baths | Sqft | Rent | $/sqft | DOM | Units | Dist |
|---|---|---|---|---|---|---|---|---|
| 1317 Hatfield Ln Birmingham, AL | 3.0 | 1.5 | 2028 | $1,300 | $0.64 | 23d | 1 | 0.03mi |
| 236 E Haven Dr Birmingham, AL | 3.0 | 1.5 | 1926 | $1,495 | $0.78 | 11d | 1 | 0.20mi |
| 1259 Huffman Rd Center Point, AL | 3.0 | 2.0 | 1662 | $1,556 | $0.94 | 43d | 1 | 0.42mi |
| 901 Eldorado Dr Birmingham, AL | 4.0 | 2.0 | 1680 | $1,415 | $0.84 | 14d | 1 | 0.74mi |
| 933 Edwards Lake Rd Birmingham, AL | 3.0 | 2.0 | 1684 | $1,360 | $0.81 | 3d | 1 | 0.81mi |
| 940 Pine Hill Rd Birmingham, AL | 3.0 | 2.0 | 1926 | $1,475 | $0.77 | 43d | 1 | 0.90mi |
| 1409 Medina Ln Birmingham, AL | 3.0 | 2.0 | 2113 | $1,600 | $0.76 | 43d | 1 | 0.99mi |
| 1328 Oak Ter Birmingham, AL | 3.0 | 2.0 | 1772 | $1,581 | $0.89 | 11d | 1 | 0.99mi |
| 1235 Little Brook Ln Birmingham, AL | 3.0 | 2.0 | 1787 | $2,400 | $1.34 | 43d | 1 | 1.12mi |
| 1761 Big Mountain Dr Birmingham, AL | 4.0 | 2.0 | 1632 | $1,575 | $0.97 | 44d | 1 | 1.13mi |
| 1177 Five Mile Rd Birmingham, AL | 3.0 | 2.0 | 1636 | $1,100 | $0.67 | 43d | 1 | 1.15mi |
| 1736 6th St NW Center Point, AL | 4.0 | 2.0 | 1830 | $1,550 | $0.85 | 43d | 1 | 1.39mi |
Listing history 15 events
-
2026-06-18days on market $140,000 Active 44 DOM
-
2026-06-17days on market $140,000 Active 43 DOM
-
2026-06-16days on market $140,000 Active 42 DOM
-
2026-06-15days on market $140,000 Active 41 DOM
-
2026-06-13days on market $140,000 Active 39 DOM
-
2026-06-10days on market $140,000 Active 36 DOM
-
2026-06-09days on market $140,000 Active 35 DOM
-
2026-06-08days on market $140,000 Active 34 DOM
-
2026-06-07days on market $140,000 Active 33 DOM
-
2026-06-03days on market $140,000 Active 29 DOM
-
2026-06-02days on market $140,000 Active 28 DOM
-
2026-06-01days on market $140,000 Active 27 DOM
-
2026-05-31days on market $140,000 Active 26 DOM
-
2026-05-04$140,000 Active 882-char remark
-
2003-03-28soldstatus $87,302
ⓘ Source: listings_history table (triggers on properties + properties_extension) + one-shot
backfill from property_details.listing_events for pre-trigger history.
Tax reassessment forecast AL · Resets to sale price
- Current annual tax
- $1,823 · $152/mo
- Projected year-2 tax
- $1,823 · $152/mo
- Expected delta
- $0/yr ($0/mo · 0.0%)
ⓘ Screening estimate from a state-policy table — verify with the county assessor before closing.
Climate risk First Street
- Flood 1/10 Low FEMA zone X (unshaded) · 0% chance over 30 yrs
- Wildfire 2/10 Low
- Heat 6/10 Major 7 d/yr ≥105°F today · 19 d/yr by 30 yrs out
- Wind 6/10 Major 27% chance of damaging wind over 30 yrs
- Air quality 5/10 Major 7 unhealthy d/yr today · 9 by 30 yrs out
Nearby sold comps map
Loading sold comps map…
Walkable amenities ~0.75 mi
Loading nearby amenities…
Taxation est. · year 1
- Rental income
- $17,648
- − Mortgage interest
- −$7,842
- − Property taxes
- −$1,823
- − Insurance
- −$700
- − Repairs & maintenance
- −$1,412
- − Management
- −$1,412
- − Depreciation
- −$4,073
- Taxable income
- $387
- Est. tax owed @ 24.0%
- −$93
- After-tax cash flow
- $2,516/yr
For passive investors: Depreciation is non-cash, so a rental often shows a tax loss while cash-flowing — sheltering income. Rental losses are passive: they offset passive income freely, and up to $25,000/yr can offset ordinary (W-2) income if you actively participate and your MAGI is under $100k (phasing out to $0 by $150k); unused losses carry forward. On sale, claimed depreciation is recaptured at up to 25%, and gains may owe capital-gains tax (a 1031 exchange can defer both). Figures are a year-1 estimate at your 24.0% rate — not tax advice; consult a CPA.
Schools (NCES district)
- District
- Birmingham City
- NCES district ID
- 0100390
- Math proficiency
- 4% ▼ -17.00%
- Reading proficiency
- 20% ▼ -4.00%
- Median HH income
- $31,988
- Composite
- 9.49/100
- National rank
- #9850
- State rank
- #116 of 129 in AL
Livability — Birmingham
- Score
- 67/100
- State rank
- #78
- US rank
- #10412
Category grades
Schools grade is shown separately in the Schools card above.
Census & demographics
- Census place
- Birmingham, AL
- County
- Jefferson County · 527,445 people
- City population
- 210,422
- Metro
- Birmingham-Hoover, AL
- Population (ZIP)
- 43,903
- Household income
- $52,793
- Rent vs Own
- Severe rent burden
- 1729.0
Population outlook (Jefferson County) Hauer SSP2
- Today (2025)
- 669,185 people
- By 2030
- 669,694 · +0.1%
- By 2040
- 661,388 · -1.2%
- By 2050
- 643,086 · -3.9%
- By 2075
- 577,267 · -13.7%
- By 2100
- 474,758 · -29.1%
Race, ethnicity, and origin ACS 2023
- Neighborhood character
- Predominantly Black (75%)
- Race & ethnicity
- Black 75% White 15% Hispanic / Latino 7% Two or more races 3%
- Hispanic origin (detail)
- Mexican 4%
- Common ancestry
- Lithuanian 1% Italian 1% Slovak 1%
- Foreign-born
- 4% · Canada
- Languages at home
- 92% English-only · Spanish 7%
Political lean MEDSL · Jefferson
- 2024 margin
- D (+10.4) · D 54.6% · R 44.2% · Other 1.2%
- 2008→2024 swing
- +5.4pp toward D · 2008: 5.1pp · 2024: 10.4pp
- All cycles
- 2024: D+10.4 2020: D+13.2 2016: D+7.2 2012: D+6.0 2008: D+5.1
Not yet ingested
- Civics
- —
Market trends
- HPI YoY
- ▼ -112.97%
- Current HPI
- 215.0607
- Rent YoY
- ▲ 3.04%
- Metro
- Birmingham-Hoover, AL
- State GDP YoY
- ▲ 2.94%
- F500 in state
- 4
Industry mix (Fortune 500 HQ in AL)
| Industry | F500 HQs | Revenue |
|---|---|---|
| Financial Services | 1 | $8B |
|
||
| Healthcare | 1 | $5B |
|
||
Price history
+60.4% since first listed2 events — show timeline
- 2026-05-04 Listed $140,000 Greater Alabama MLS
- 2003-03-28 Sold (Public Records) $87,302 Public Records
Cash-flow waterfall
monthlySold comps — $/sqft
last 12 mo · ≤1 miLoading sold comps…