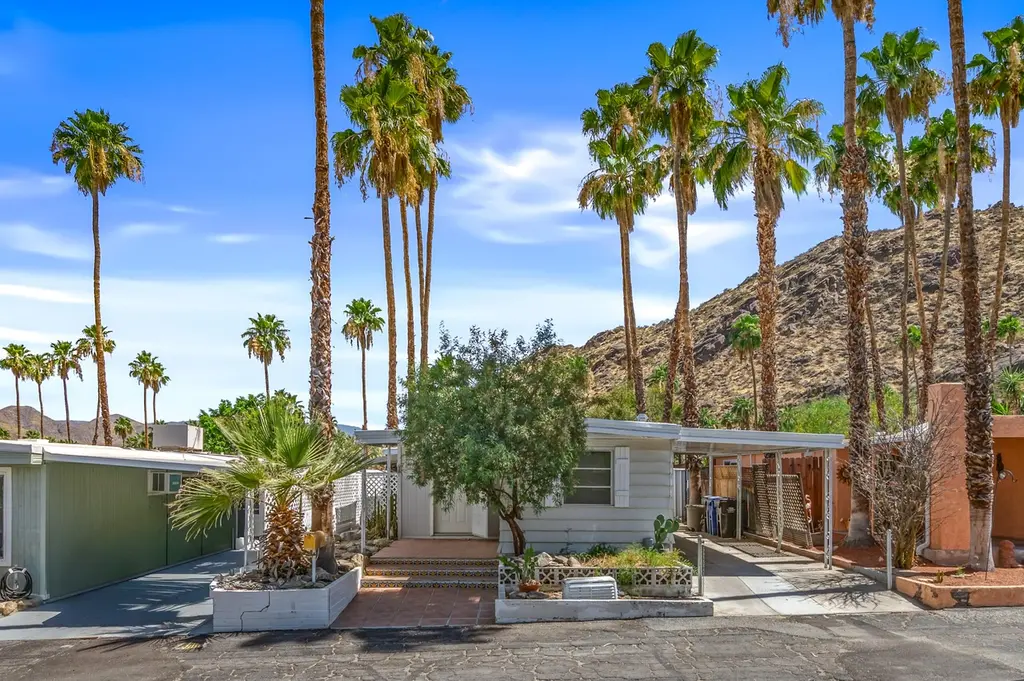
513 Jade Ln · Palm Springs, CA
Flood risk 1/10 · Minimal
- FEMA flood zone
- X (shaded)
- Chance of flooding over 30 yrs
- 0.0%
- Est. flood insurance / yr
- $507 – $1,088
Fire risk 5/10 · Moderate
- Est. fire insurance / yr
- $659 – $1,223
Heat risk 9/10 · Severe
- Hot days now (above 110°F)
- 10 days/yr
- Hot days in 30 yrs
- 28 days/yr
Wind risk 1/10 · Minimal
- Chance of severe wind over 30 yrs
- —
Air-quality risk 6/10 · Moderate
- Unhealthy air days now
- 10 days/yr
- Unhealthy air days in 30 yrs
- 12 days/yr
Risk factors via First Street. Map © Google.
Why this score? — see what drove the B grade
The composite is a weighted blend of 9 inputs, each scored 0–100. Each bar is that input's sub-score; the figure is the points it added to the 100-point composite (weight × sub-score).
- Cash flow +30.0/30.0
- ARV discount +15.0/15.0
- DSCR +10.0/10.0
- 1% rule +8.7/10.0
- Livability +3.3/5.0
- Schools +2.7/10.0
- Condition / age +2.5/5.0
- Rent growth +2.4/5.0
- Appreciation +0.0/10.0
$149,000
🖨 Deal sheet 📄 Offer letter ✓ Due diligence
Listing remarks
Welcome to the Mid-Century neighborhood of Parkview Mobile Estates a 55+ community located in vibrant Palm Springs. 513 Jade Lane is a cozy 1 bedroom 1 bathroom home with exceptional outdoor space and mountain views. The unique floor plan includes a separate eat in-kitchen with passthrough design into the living room/dining room space. The bedroom features a step down retreat perfect for a media space or home office with sliders out to your private patio. The outdoor space is truly exceptional with a covered sitting area and beautiful down canyon views. There is even an outdoor storage shed and gate to your two car tandem carport. The possibilities are endless in either updating or restorin
Key facts
- Step down retreat
- Eat in-kitchen
- Passthrough design
Tags
Property features AI
Finance
- Other: Community in- ground heated pool and spa (community amenities)
- Financial info: Land lease annual amount listed; Rental restrictions apply; Will not consider lease; short-term rentals not allowed; Listing terms: cash or cash to new loan
- HOA & community: Senior community; Not a gated community; No monthly association fee listed
Exterior
- Parking: Total of 4 parking spaces; 2 covered spaces; 2 carport spaces; Attached carport
- Security: Security/safety: other
- Utilities: PUD: Yes; Sewer: Other
- Home design: Single-story (ground level); Detached; Built/manufacturer date listed as 1965 (mobile/manufactured information present)
- Construction: Manufactured/mobile home noted (50 ft length, 10 ft width); One shed on property; Mobile home to remain
- Exterior features: Concrete slab, wood, and rock/stone patios; Close to clubhouse and park nearby; Hillside location; Has mountain view; Detached property; Lease land type
Interior
- Kitchen: Gas cooktop; Self-cleaning oven; Refrigerator; Microwave
- Bedrooms: Main floor master bedroom
- Flooring: Carpet; Terrazzo
- Bathrooms: 1 full bathroom
- Heating & cooling: Central heating; Air conditioning with wall/window unit(s)
- Interior features: Ground-level entry with steps; Partially furnished; Main floor master bedroom; Breakfast nook and living/dining combo; Breakfast area, living room, entry, dining room; No fireplace
- Laundry & utility: No specific laundry details provided
Neighborhood map
What this means for you Summary
Snapshot
- This is a 1-bed/1.0-bath manufactured listed at $149k.
Deal economics
- At list price, monthly cash flow is $578 ($7k/yr) — positive.
- The deal already cash-flows at list — no discount required.
- Meets the 1% rule at list price ($2k rent vs $149k).
- Cap rate 11.0% vs local median 2.7% in Palm Springs — top-decile yield for the area; either an underpriced asset or a hidden risk that comps aren't pricing in. Stress-test before assuming the spread holds.
Location & tenants
- Location reads 66/100 on livability (#348 in CA) — a middle-class / working-renter tenant base. Strengths: amenities A+, commute A+; Watch: schools C-, crime F, cost of living F.
- Palm Springs Unified (suburban): math 21% / reading 42% proficiency, ranked #328 of 517 in CA (top 63%) — families likely to look elsewhere, expect single-tenant / working-renter base with shorter leases; 73% free/reduced lunch — lower-income household profile, screen leases tightly.
- Market conditions: Rents soft (-0.4%/yr); 492 active listings in the ZIP; 32 comparable units currently listed for rent nearby; rentals at typical pace (median 24d on market — plan ~3-4 weeks tenant-placement turnaround); solid renter incomes; 9,195 units permitted in Riverside County in 2024 (1,512 in 5+ unit buildings).
- This rent runs 31% of the median local income ($78k/yr) — at the standard rent-burdened threshold; future hikes will face affordability resistance.
Forward outlook
- Local home prices are declining (-3.0%/yr); year-one equity from $1k of loan paydown is wiped out by about $4k of value loss. Plan a longer hold.
- Riverside County population projected at +22% by 2050 — long-run rental-demand tailwind backs the buy-and-hold thesis.
Negotiation context
- Only 9 days on market — expect competitive offers; lowballing is unlikely to land.
Risks & watch-outs
- Climate carrying-cost: moderate wildfire risk; extreme-heat days projected 10→28/yr by 2055 (HVAC capex compounding) — expect insurance premiums to compound above CPI over the hold.
Questions for the listing agent
- Built in 1975 — when were the roof, HVAC, electrical panel, plumbing, and water heater last replaced?
- Is there a deadline driving the sale (1031 exchange, divorce, estate, relocation)? That informs how much negotiation room exists.
- Crime grade is F in this area — have there been break-ins, vandalism, or insurance claims at this property in the last 3 years? What carrier currently insures it and at what premium?
- What's the average days-on-market for RENTAL listings here right now (not sales)? A rising rental-DOM trend means longer vacancies and softer asking-rent achievability than the comps imply.
- What's the recent tenant-quality profile in this submarket — average credit score on applications, eviction rate, late-payment / NSF rate, and stable-employment percentage? A property-management company in the area should have these aggregated.
- How much new for-sale + rental construction is in the pipeline within 1–3 miles? Heavy new supply typically softens prices + rents 12–24 months out; constrained supply supports both.
Investment metrics
- 1% rule
- 1.37% ✓
- Cap rate
- 10.95%
- Cash-on-cash
- 16.63%
- DSCR
- 1.74
- GRM
- 6.1
CMA / ARV
- ARV (on-the-fly)
- $270,000
- Comps found
- 3
Show comp detail 3 sales within ~0.75 mi
| Address | Dist | Beds/Ba | Sqft | Sold | Price | $/sf | Match |
|---|---|---|---|---|---|---|---|
| 219 Stone Ter | 0.11mi | 2/2.0 (+1) | 900 (0%) | 5mo | $124,000 | $138 | 82 |
| 112 Pali Dr | 0.74mi | 2/2.0 (+1) | 800 (-11%) | 8mo | $275,000 | $344 | 31 |
| 504 Tiki Dr | 0.70mi | 2/2.0 (+1) | 1,000 (+11%) | 14mo | $300,000 | $300 | 28 |
Match score weights: distance 35% · size 25% · config 20% · recency 20%. Top-matched comps best support the ARV.
Projected returns pro-forma
-3.0% appreciation · 0.0% rent growth · sell at horizon
- IRR
- 4.3%
- Equity multiple
- 1.16×
- Total profit
- $6,754
- Equity at exit
- $22,216
- IRR
- 10.8%
- Equity multiple
- 1.73×
- Total profit
- $30,381
- Equity at exit
- $12,883
Cash invested: $41,720 (down + closing). Projections, not guarantees.
Landlord ↔ Tenant lean methodology
- Overall (STATE)
- 18 Strongly Tenant-Friendly
- State California
- 18 Strongly Tenant-Friendly · D+13
- County
- — inherits STATE
- City
- — inherits STATE
ZIP-level market 92264
- Rents YoY
- -0.4%
- Active inventory
- 492
- Price-to-rent
- 6.1×
Monthly cashflow live
- Estimated rent
- $2,035 high interval (Pro) →
- Mortgage (P&I)
- −$781
- Tax est. 1.5%
- −$186 /mo · $2,235/yr
- Insurance
- −$62
- HOA
- −$0
- Vacancy / Maint / Mgmt
- −$427
- Net cashflow
- $578
Break-even live
UW: 25.0% down · 7.5% · 30yr · 1.5% tax · 5.0% vac · 8.0% maint · 8.0% mgmt
Financing live
Cash to close
- Down payment
- $37,250
- Closing costs
- $4,470
- Reserves months
- —
- Total cash needed
- —
Loan-product check · same deal, 3 products live
Conventional
25% down · 7.5% · 30yr
- Down + closing
- —
- Monthly P&I
- —
- Monthly cashflow
- —
- DSCR
- —
- Eligible?
- —
Personal DTI + credit; lowest rate.
DSCR
20% down · 8.5% · 30yr
- Down + closing
- —
- Monthly P&I
- —
- Monthly cashflow
- —
- DSCR
- —
- Eligible?
- —
No personal income docs; deal must DSCR.
Hard money
10% down · 12.0% · 12mo
- Down + closing
- —
- Monthly P&I
- —
- Monthly cashflow
- —
- DSCR
- —
- Eligible?
- —
Short-term bridge; refi at stabilization.
Rent comps 32 comps
| Address | Beds | Baths | Sqft | Rent | $/sqft | DOM | Units | Dist |
|---|---|---|---|---|---|---|---|---|
| 1333 S Belardo Rd Palm Springs, CA | 1.0 | 1.0 | 687 | $1,925 | $2.80 | 2d | 8 | 0.04mi |
| 1425 Via Soledad Unit 1 Palm Springs, CA | 2.0 | 2.0 | 1050 | $2,500 | $2.38 | 43d | 1 | 0.28mi |
| 1425 Via Soledad Unit 1 Palm Springs, CA | 2.0 | 2.0 | 1050 | $2,500 | $2.38 | 24d | 1 | 0.28mi |
| 1674 Via Salida Unit 3 Palm Springs, CA | 1.0 | 1.0 | 550 | $1,650 | $3.00 | 15d | 1 | 0.45mi |
| 671 S Riverside Dr Unit 6 Palm Springs, CA | 2.0 | 2.0 | 900 | $1,985 | $2.21 | 24d | 1 | 0.52mi |
| 722 E San Lorenzo Rd Palm Springs, CA | 3.0 | 1.0–2.0 | 750 | $1,605 | $2.14 | 7d | 3 | 0.53mi |
| 777 E San Lorenzo Rd Unit 3 Palm Springs, CA | 1.0 | 1.0 | 550 | $1,765 | $3.21 | 18d | 1 | 0.56mi |
| 1428 S Camino Real Palm Springs, CA | 2.0 | 2.0 | 1054 | $2,300 | $2.18 | 43d | 1 | 0.60mi |
| 1900 S Palm Canyon Dr #42 Palm Springs, CA | 2.0 | 2.0 | 1024 | $2,500 | $2.44 | 43d | 1 | 0.63mi |
| 1950 S Palm Canyon Dr Palm Springs, CA | 1.0–2.0 | 1.0–2.0 | 902 | $1,999 | $2.22 | 2d | 3 | 0.65mi |
| 1950 S Palm Canyon Dr Palm Springs, CA | 1.0–2.0 | 1.0–2.0 | 902 | $2,095 | $2.32 | 43d | 2 | 0.65mi |
| 788 N Riverside Dr Palm Springs, CA | 1.0 | 1.0 | 725 | $1,648 | $2.27 | 43d | 1 | 0.65mi |
| 585 Calle Abronia S Unit B Palm Springs, CA | 1.0 | 1.0 | 750 | $2,100 | $2.80 | 43d | 1 | 0.69mi |
| 583 Calle Abronia S Unit A Palm Springs, CA | 2.0 | 1.0 | 760 | $2,299 | $3.02 | 43d | 1 | 0.69mi |
| 594 Calle Abronia S Unit 03 Palm Springs, CA | 2.0 | 2.0 | 662 | $1,895 | $2.86 | 43d | 1 | 0.70mi |
| 120 Pali Dr Palm Springs, CA | 2.0 | 2.0 | 835 | $2,200 | $2.63 | 22d | 1 | 0.74mi |
| 1111 E Palm Canyon Dr Palm Springs, CA | 1.0 | 1.0 | 525 | $2,525 | $4.81 | 24d | 2 | 0.79mi |
| 300 S Calle El Segundo Palm Springs, CA | 1.0–2.0 | 1.0 | 554 | $1,330 | $2.40 | 3d | 1 | 1.02mi |
| 1400 E Palm Canyon Dr Unit 113 Palm Springs, CA | 1.0 | 1.0 | 800 | $1,995 | $2.49 | 43d | 1 | 1.05mi |
| 620 S Thornhill Rd Unit 6 Palm Springs, CA | 1.0 | 1.0 | 656 | $1,765 | $2.69 | 24d | 1 | 1.08mi |
| 620 S Thornhill Rd Unit 3 Palm Springs, CA | 2.0 | 1.0 | 700 | $1,985 | $2.84 | 24d | 1 | 1.08mi |
| 1111 E Ramon Rd Palm Springs, CA | 2.0–3.0 | 2.0 | 1191 | $2,000 | $1.68 | 24d | 2 | 1.08mi |
| 1111 E Ramon Rd Palm Springs, CA | 2.0–3.0 | 2.0 | 1191 | $2,800 | $2.35 | 16d | 2 | 1.08mi |
| 449 E Arenas Rd Palm Springs, CA | 2.0 | 1.0–2.0 | 715 | $1,970 | $2.76 | 7d | 1 | 1.09mi |
| 900 E Saturnino Rd Palm Springs, CA | 1.0–3.0 | 1.0–2.0 | 1020 | $1,870 | $1.83 | 1d | 6 | 1.10mi |
| 1530 E Palm Canyon Dr Unit 209 Palm Springs, CA | 2.0 | 2.0 | 740 | $2,595 | $3.51 | 3d | 1 | 1.10mi |
| 1655 E Palm Canyon Dr Palm Springs, CA | 1.0 | 1.0 | 755 | $2,122 | $2.81 | 43d | 3 | 1.18mi |
| 1655 E Palm Canyon Dr Palm Springs, CA | 1.0 | 1.0 | 755 | $2,000 | $2.65 | 7d | 3 | 1.18mi |
| 1655 E Palm Canyon Dr Palm Springs, CA | 1.0 | 1.0 | 755 | $2,350 | $3.11 | 24d | 2 | 1.18mi |
| 280 S Avenida Caballeros #129 Palm Springs, CA | 1.0 | 1.5 | 767 | $1,699 | $2.22 | 24d | 1 | 1.20mi |
| 222 N Calle El Segundo #522 Palm Springs, CA | 1.0 | 1.0 | 539 | $2,450 | $4.55 | 43d | 1 | 1.44mi |
| 311 S Sunrise Way Palm Springs, CA | 2.0 | 1.0–2.0 | 688 | $1,950 | $2.83 | 24d | 18 | 1.49mi |
Listing history 8 events
-
2026-06-18days on market $149,000 Active 9 DOM
-
2026-06-17days on market $149,000 Active 8 DOM
-
2026-06-16days on market $149,000 Active 7 DOM
-
2026-06-15days on market $149,000 Active 6 DOM
-
2026-06-13days on market $149,000 Active 4 DOM
-
2026-06-13days on market $149,000 Active 3 DOM
-
2026-06-10remarks 699-char remark
-
2026-06-10$149,000 Active 1 DOM
ⓘ Source: listings_history table (triggers on properties + properties_extension) + one-shot
backfill from property_details.listing_events for pre-trigger history.
Climate risk First Street
- Flood 1/10 Low FEMA zone X (shaded) · 0% chance over 30 yrs
- Wildfire 5/10 Major
- Heat 9/10 Extreme 10 d/yr ≥110°F today · 28 d/yr by 30 yrs out
- Wind 1/10 Low
- Air quality 6/10 Major 10 unhealthy d/yr today · 12 by 30 yrs out
Nearby sold comps map
Loading sold comps map…
Walkable amenities ~0.75 mi
Loading nearby amenities…
Taxation est. · year 1
- Rental income
- $24,426
- − Mortgage interest
- −$8,346
- − Property taxes
- −$2,235
- − Insurance
- −$745
- − Repairs & maintenance
- −$1,954
- − Management
- −$1,954
- − Depreciation
- −$4,335
- Taxable income
- $4,857
- Est. tax owed @ 24.0%
- −$1,166
- After-tax cash flow
- $5,774/yr
For passive investors: Depreciation is non-cash, so a rental often shows a tax loss while cash-flowing — sheltering income. Rental losses are passive: they offset passive income freely, and up to $25,000/yr can offset ordinary (W-2) income if you actively participate and your MAGI is under $100k (phasing out to $0 by $150k); unused losses carry forward. On sale, claimed depreciation is recaptured at up to 25%, and gains may owe capital-gains tax (a 1031 exchange can defer both). Figures are a year-1 estimate at your 24.0% rate — not tax advice; consult a CPA.
Schools (NCES district)
- District
- Palm Springs Unified
- NCES district ID
- 0629550
- Math proficiency
- 21% ▼ -7.00%
- Reading proficiency
- 42% ▬ 0.00%
- Median HH income
- $43,638
- Composite
- 26.76/100
- National rank
- #7131
- State rank
- #328 of 517 in CA
Livability — Palm Springs
- Score
- 66/100
- State rank
- #348
- US rank
- #11850
Category grades
Schools grade is shown separately in the Schools card above.
Census & demographics
- Census place
- Palm Springs, CA
- County
- Riverside County · 2,287,001 people
- City population
- 46,786
- Metro
- Riverside-San Bernardino-Ontario, CA
- Population (ZIP)
- 19,899
- Household income
- $77,688
- Rent vs Own
- Severe rent burden
- 1215.0
Population outlook (Riverside County) Hauer SSP2
- Today (2025)
- 2,664,475 people
- By 2030
- 2,802,692 · +5.2%
- By 2040
- 3,050,904 · +14.5%
- By 2050
- 3,256,783 · +22.2%
- By 2075
- 3,655,058 · +37.2%
- By 2100
- 3,766,594 · +41.4%
Race, ethnicity, and origin ACS 2023
- Neighborhood character
- Predominantly White (68%)
- Race & ethnicity
- White 68% Hispanic / Latino 20% Two or more races 12% Asian 6% Black 2% Native American 1%
- Hispanic origin (detail)
- Mexican 16%
- Common ancestry
- Lithuanian 4% Romanian 3% Slovak 3%
- Foreign-born
- 16% · Canada, China, South Korea
- Languages at home
- 81% English-only · Spanish 13% Tagalog/Filipino 2% Other Asian/Pacific 1%
Political lean MEDSL · Riverside
- 2024 margin
- Toss-up / Even · D 48.0% · R 49.3% · Other 2.6%
- 2008→2024 swing
- -3.6pp toward R · 2008: 2.3pp · 2024: -1.3pp
- All cycles
- 2024: R+1.3 2020: D+8.0 2016: D+4.3 2012: R+0.4 2008: D+2.3
Not yet ingested
- Civics
- —
Market trends
- HPI YoY
- ▼ -489.04%
- Current HPI
- 357.0969
- Rent YoY
- ▼ -0.43%
- Metro
- Riverside-San Bernardino-Ontario, CA
- State GDP YoY
- ▲ 3.21%
- F500 in state
- 116
Industry mix (Fortune 500 HQ in CA)
| Industry | F500 HQs | Revenue |
|---|---|---|
| Technology | 27 | $1,492B |
|
||
| Financial Services | 3 | $174B |
|
||
| Retail | 3 | $44B |
|
||
| Insurance | 3 | $26B |
|
||
| Media / Entertainment | 2 | $115B |
|
||
| Pharmaceuticals / Biotech | 2 | $62B |
|
||
Price history
1 event — show timeline
- 2026-06-09 Listed $149,000 GPSMLS
Property tax history
+1.6%/yrLatest (2025): $174 · +0.8% YoY. Source: county tax records.
Cash-flow waterfall
monthlySold comps — $/sqft
last 12 mo · ≤1 miLoading sold comps…