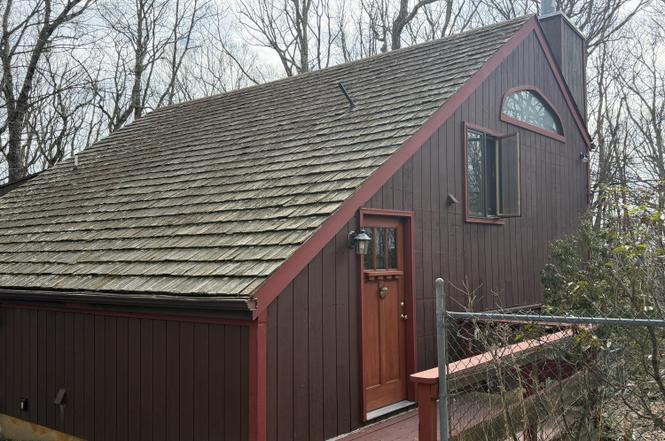
128 Horseshoe Ln · Hemlock Farms, PA
Flood risk 1/10 · Minimal
- FEMA flood zone
- X (unshaded)
- Chance of flooding over 30 yrs
- 0.0%
- Est. flood insurance / yr
- $473 – $860
Fire risk 4/10 · Minor
- Est. fire insurance / yr
- $511 – $949
Heat risk 2/10 · Minimal
- Hot days now (above 91°F)
- 7 days/yr
- Hot days in 30 yrs
- 14 days/yr
Wind risk 3/10 · Minor
- Chance of severe wind over 30 yrs
- 6.0%
Air-quality risk 2/10 · Minimal
- Unhealthy air days now
- 1 days/yr
- Unhealthy air days in 30 yrs
- 2 days/yr
Risk factors via First Street. Map © Google.
Why this score? — see what drove the A grade
The composite is a weighted blend of 9 inputs, each scored 0–100. Each bar is that input's sub-score; the figure is the points it added to the 100-point composite (weight × sub-score).
- Cash flow +30.0/30.0
- ARV discount +15.0/15.0
- 1% rule +10.0/10.0
- DSCR +10.0/10.0
- Appreciation +10.0/10.0
- Schools +4.2/10.0
- Livability +3.4/5.0
- Rent growth +2.5/5.0
- Condition / age +2.5/5.0
$195,000
🖨 Deal sheet (PDF) 📄 Offer letter ✓ Due diligence
Listing remarks
The Diamond in the Rough you have been looking for. This beautiful home on 1.57 acres located on a very quiet road in the amenity filled Hemlock Farms Community is the one you have been looking for. The open floor plan great room with a beautiful wood burning stone fireplace is the focal point leading your eyes t the beautiful wood ceilings. Open the sliders out to the expansive deck or hang out in the screen porch for a feeling of tranquility. Just a little polish will bring this home back to its original glory.
Key facts
- Open floor plan
- Wood ceilings
- 1.57 acres
Tags
Neighborhood map
What this means for you Summary
Snapshot
- This is a 3-bed/2.0-bath single-family listed at $195k.
Deal economics
- At list price, monthly cash flow is $2k ($21k/yr) — positive.
- The deal already cash-flows at list — no discount required.
- Meets the 1% rule at list price ($4k rent vs $195k).
- Recommended offer: $192k (1.5% below list) — sets the bar for market timing.
- Cap rate 16.9% vs local median 6.9% in Hemlock Farms — top-decile yield for the area; either an underpriced asset or a hidden risk that comps aren't pricing in. Stress-test before assuming the spread holds.
Location & tenants
- Location reads 68/100 on livability (#884 in PA) — a middle-class / working-renter tenant base. Strengths: crime A+, housing A+, health & safety A+; Watch: schools C-, amenities F, commute F.
- Wallenpaupack Area SD (rural): math 39% / reading 59% proficiency, ranked #192 of 539 in PA (top 36%) — families likely to look elsewhere, expect single-tenant / working-renter base with shorter leases.
- Market conditions: 374 active listings in the ZIP; 2 comparable units currently listed for rent nearby; 213 units permitted in Pike County in 2024 (0 in 5+ unit buildings).
Forward outlook
- In year one you build about $21k of equity ($1k loan paydown + $20k appreciation (10.0% local appreciation)).
- Pike County population projected at -25% by 2050 — secular population decline; favor cash flow + early exit over multi-decade hold.
- At projected returns (10.0% appreciation + 3.0% rent growth), your $55k cash investment doubles in ~2 years — after that, you're playing with house money.
- By year 2, paydown + projected appreciation supports a ~$34k cash-out refi (75% LTV) — recoverable capital for the next deal without selling this one.
Negotiation context
- It's been on market 20 days — a 2% lower offer ($192k) is reasonable based on typical stale-listing flexibility.
- Current owner paid $120k; list at $195k implies a 62% gain — meaningful room to come down on a strong offer.
Questions for the listing agent
- Built in 1973 — when were the roof, HVAC, electrical panel, plumbing, and water heater last replaced?
- What does the HOA fee cover, when was the last increase, and are there any pending special assessments or reserve-fund shortfalls?
- Is there a deadline driving the sale (1031 exchange, divorce, estate, relocation)? That informs how much negotiation room exists.
- What's the average days-on-market for RENTAL listings here right now (not sales)? A rising rental-DOM trend means longer vacancies and softer asking-rent achievability than the comps imply.
- What's the recent tenant-quality profile in this submarket — average credit score on applications, eviction rate, late-payment / NSF rate, and stable-employment percentage? A property-management company in the area should have these aggregated.
- How much new for-sale + rental construction is in the pipeline within 1–3 miles? Heavy new supply typically softens prices + rents 12–24 months out; constrained supply supports both.
Investment metrics
- 1% rule
- 2.15% ✓
- Cap rate
- 16.93%
- Cash-on-cash
- 37.98%
- DSCR
- 2.69
- GRM
- 3.9
CMA / ARV
- ARV (on-the-fly)
- $265,815
- Comps found
- 12
Show comp detail 12 sales within ~0.75 mi
| Address | Dist | Beds/Ba | Sqft | Sold | Price | $/sf | Match |
|---|---|---|---|---|---|---|---|
| 128 Horseshoe Ln | 0.00mi | 3/2.0 | 1,485 (0%) | 1mo | $190,000 | $128 | 99 |
| 111 Horseshoe Ln | 0.09mi | 2/2.0 (-1) | 1,500 (+1%) | 1mo | $178,500 | $119 | 88 |
| 130 Canterbrook Dr #130 | 0.20mi | 3/2.5 | 1,550 (+4%) | 1mo | $260,000 | $168 | 80 |
| 130 Canterbrook Dr | 0.20mi | 3/2.5 | 1,550 (+4%) | 1mo | $260,000 | $168 | 80 |
| 122 Horseshoe Ln | 0.06mi | 3/2.0 | 1,315 (-11%) | 7mo | $269,000 | $205 | 72 |
| 109 Canterbrook Dr | 0.35mi | 3/2.0 | 1,536 (+3%) | 11mo | $275,000 | $179 | 69 |
| 120 Burning Tree Dr | 0.19mi | 3/2.0 | 1,360 (-8%) | 11mo | $250,000 | $184 | 68 |
| 809 Lasso Ct N | 0.23mi | 3/1.5 | 1,368 (-8%) | 13mo | $279,000 | $204 | 64 |
| 115 Jackson Dr | 0.56mi | 4/2.0 (+1) | 1,496 (+1%) | 6mo | $355,000 | $237 | 62 |
| 103 Fairway Ln | 0.48mi | 4/2.0 (+1) | 1,548 (+4%) | 14mo | $249,000 | $161 | 54 |
| 805 Jefferson Ct | 0.65mi | 4/2.0 (+1) | 1,540 (+4%) | 12mo | $295,000 | $192 | 49 |
| 803 Lariat Ct | 0.73mi | 4/2.0 (+1) | 1,588 (+7%) | 8mo | $190,000 | $120 | 42 |
Match score weights: distance 35% · size 25% · config 20% · recency 20%. Top-matched comps best support the ARV.
Projected returns pro-forma
10.0% appreciation · 3.0% rent growth · sell at horizon
- IRR
- 53.6%
- Equity multiple
- 4.96×
- Total profit
- $216,474
- Equity at exit
- $175,671
- IRR
- 47.2%
- Equity multiple
- 11.10×
- Total profit
- $551,342
- Equity at exit
- $378,842
Cash invested: $54,600 (down + closing). Projections, not guarantees.
Landlord ↔ Tenant lean methodology
- Overall (STATE)
- 62 Landlord-Friendly
- State Pennsylvania
- 62 Landlord-Friendly · EVEN
- County
- — inherits STATE
- City
- — inherits STATE
ZIP-level market 18428
- Home prices YoY
- 9.2%
- Active inventory
- 374
- Price-to-rent
- 3.9×
Monthly cashflow live
- Estimated rent
- $4,192 medium interval (Pro) →
- Mortgage (P&I)
- −$1,023
- Tax from tax record
- −$230 /mo · $2,761/yr
- Insurance
- −$81
- HOA
- −$250
- Vacancy / Maint / Mgmt
- −$880
- Net cashflow
- $1,728
Break-even live
Sensitivity live
| Price | -10% $1,838 | -5% $1,783 | +0% $1,728 | +5% $1,673 | +10% $1,618 |
|---|---|---|---|---|---|
| Rent | -10% $1,397 | -5% $1,562 | +0% $1,728 | +5% $1,894 | +10% $2,059 |
| Rate | -1.0pp $1,826 | -0.5pp $1,778 | base $1,728 | +0.5pp $1,678 | +1.0pp $1,626 |
UW: 25.0% down · 7.5% · 30yr · 1.5% tax · 5.0% vac · 8.0% maint · 8.0% mgmt
Financing live
Cash to close
- Down payment
- $48,750
- Closing costs
- $5,850
- Reserves months
- —
- Total cash needed
- —
Loan-product check · same deal, 3 products live
Conventional
25% down · 7.5% · 30yr
- Down + closing
- —
- Monthly P&I
- —
- Monthly cashflow
- —
- DSCR
- —
- Eligible?
- —
Personal DTI + credit; lowest rate.
DSCR
20% down · 8.5% · 30yr
- Down + closing
- —
- Monthly P&I
- —
- Monthly cashflow
- —
- DSCR
- —
- Eligible?
- —
No personal income docs; deal must DSCR.
Hard money
10% down · 12.0% · 12mo
- Down + closing
- —
- Monthly P&I
- —
- Monthly cashflow
- —
- DSCR
- —
- Eligible?
- —
Short-term bridge; refi at stabilization.
Rent comps 2 comps
| Address | Beds | Baths | Sqft | Rent | $/sqft | DOM | Units | Dist |
|---|---|---|---|---|---|---|---|---|
| 113 Portage Ln Milford, PA | 3.0 | 2.0 | 1400 | $4,000 | $2.86 | 0d | 1 | 0.99mi |
| 101 Pommel Dr Hawley, PA | 3.0 | 2.0 | 1691 | $4,400 | $2.60 | 2d | 1 | 0.99mi |
HOA detail
- Monthly dues
- $250 · $3,000/yr
Listing history 3 events
-
2026-04-01status Pending
-
2026-03-11$195,000 Active
-
2012-04-10soldstatus $120,000
ⓘ Source: listings_history table (triggers on properties + properties_extension) + one-shot
backfill from property_details.listing_events for pre-trigger history.
Tax reassessment forecast PA · Partial reset (capped growth)
- Current annual tax
- $2,761 · $230/mo
- Projected year-2 tax
- $2,921 · $243/mo
- Expected delta
- +$160/yr (+$13/mo · 5.8%)
ⓘ Screening estimate from a state-policy table — verify with the county assessor before closing.
Climate risk First Street
- Flood 1/10 Low FEMA zone X (unshaded) · 0% chance over 30 yrs
- Wildfire 4/10 Moderate
- Heat 2/10 Low 7 d/yr ≥91°F today · 14 d/yr by 30 yrs out
- Wind 3/10 Moderate 6% chance of damaging wind over 30 yrs
- Air quality 2/10 Low 1 unhealthy d/yr today · 2 by 30 yrs out
Nearby sold comps map
Loading sold comps map…
Walkable amenities ~0.75 mi
Loading nearby amenities…
Taxation est. · year 1
- Rental income
- $50,310
- − Mortgage interest
- −$10,923
- − Property taxes
- −$2,761
- − Insurance
- −$975
- − Repairs & maintenance
- −$4,025
- − Management
- −$4,025
- − HOA
- −$3,000
- − Depreciation
- −$5,673
- Taxable income
- $18,928
- Est. tax owed @ 24.0%
- −$4,543
- After-tax cash flow
- $16,194/yr
For passive investors: Depreciation is non-cash, so a rental often shows a tax loss while cash-flowing — sheltering income. Rental losses are passive: they offset passive income freely, and up to $25,000/yr can offset ordinary (W-2) income if you actively participate and your MAGI is under $100k (phasing out to $0 by $150k); unused losses carry forward. On sale, claimed depreciation is recaptured at up to 25%, and gains may owe capital-gains tax (a 1031 exchange can defer both). Figures are a year-1 estimate at your 24.0% rate — not tax advice; consult a CPA.
Schools (NCES district)
- District
- Wallenpaupack Area SD
- NCES district ID
- 4224750
- Math proficiency
- 39% ▼ -10.00%
- Reading proficiency
- 59% ▼ -5.00%
- Median HH income
- $51,027
- Composite
- 41.97/100
- National rank
- #3345
- State rank
- #192 of 539 in PA
Livability — Hemlock Farms
- Score
- 68/100
- State rank
- #884
- US rank
- #9421
Category grades
Schools grade is shown separately in the Schools card above.
Census & demographics
- Census place
- Hemlock Farms, PA
- Population (ZIP)
- 12,446
Population outlook (Pike County) Hauer SSP2
- Today (2025)
- 53,548 people
- By 2030
- 51,622 · -3.6%
- By 2040
- 46,490 · -13.2%
- By 2050
- 40,372 · -24.6%
- By 2075
- 31,951 · -40.3%
- By 2100
- 26,821 · -49.9%
Race, ethnicity, and origin ACS 2023
- Neighborhood character
- Predominantly White (85%)
- Race & ethnicity
- White 85% Hispanic / Latino 8% Two or more races 6% Black 1% Asian 1%
- Hispanic origin (detail)
- Puerto Rican 5%
- Common ancestry
- Romanian 5% Portuguese 3% Italian 2%
- Foreign-born
- 5% · Canada
- Languages at home
- 91% English-only · Spanish 5% Russian/Polish/Slavic 1% Other Asian/Pacific 1%
Political lean MEDSL · Pike
- 2024 margin
- Strong R (+24.1) · D 37.6% · R 61.6%
- 2008→2024 swing
- -19.8pp toward R · 2008: -4.2pp · 2024: -24.1pp
- All cycles
- 2024: R+24.1 2020: R+19.0 2016: R+26.0 2012: R+11.0 2008: R+4.2
Not yet ingested
- Civics
- —
Market trends
- HPI YoY
- ▲ 28.60%
- Current HPI
- 340.8254
- Rent YoY
- —
- Metro
- —
- State GDP YoY
- ▲ 1.68%
- F500 in state
- 34
Industry mix (Fortune 500 HQ in PA)
| Industry | F500 HQs | Revenue |
|---|---|---|
| Healthcare | 2 | $309B |
|
||
| Insurance | 2 | $27B |
|
||
| Telecommunications / Media | 1 | $124B |
|
||
| Industrial Distribution | 1 | $22B |
|
||
| Financial Services | 1 | $20B |
|
||
| Chemicals / Materials | 1 | $18B |
|
||
Price history
+62.5% since first listed3 events — show timeline
- 2026-04-01 Pending — PWMLS
- 2026-03-11 Listed $195,000 PWMLS
- 2012-04-10 Sold (Public Records) $120,000 Public Records
Property tax history
+2.8%/yrLatest (2026): $2,761 · +3.0% YoY. Source: county tax records.
Cash-flow waterfall
monthlySold comps — $/sqft
last 12 mo · ≤1 miLoading sold comps…