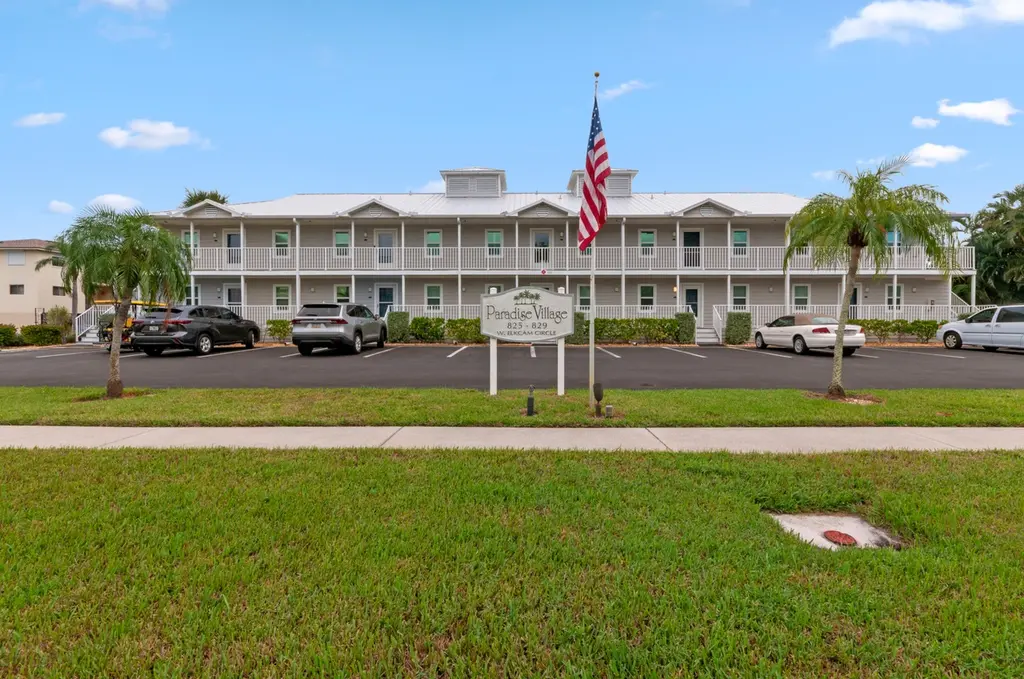
829 W Elkcam Cir #208 · Marco Island, FL
Flood risk 9/10 · Severe
- FEMA flood zone
- AE
- Chance of flooding over 30 yrs
- 0.99%
- Est. flood insurance / yr
- $1,737 – $8,500
Fire risk 3/10 · Minor
- Est. fire insurance / yr
- $947 – $1,759
Heat risk 10/10 · Severe
- Hot days now (above 108°F)
- 7 days/yr
- Hot days in 30 yrs
- 30 days/yr
Wind risk 10/10 · Severe
- Chance of severe wind over 30 yrs
- 99.0%
Air-quality risk 3/10 · Minor
- Unhealthy air days now
- 3 days/yr
- Unhealthy air days in 30 yrs
- 3 days/yr
Risk factors via First Street. Map © Google.
Why this score? — see what drove the B grade
The composite is a weighted blend of 9 inputs, each scored 0–100. Each bar is that input's sub-score; the figure is the points it added to the 100-point composite (weight × sub-score).
- Cash flow +30.0/30.0
- 1% rule +10.0/10.0
- DSCR +10.0/10.0
- ARV discount +7.5/15.0
- Schools +5.0/10.0
- Rent growth +4.1/5.0
- Livability +3.6/5.0
- Condition / age +2.5/5.0
- Appreciation +0.0/10.0
$314,900
🖨 Deal sheet (PDF) 📄 Offer letter ✓ Due diligence
Listing remarks
Remodeled 2 bedroom 2 bath second floor condo overlooking the pool. Laundry is located within the condo. New AC, Impact windows and sliding glass door. Screened lanai, plenty of parking. Great location, close to The Esplanade, Farmers Market, Winn Dixie, restaurants and shopping. The beach is 2 miles away. Perfect for your winter getaway, residence or investment. Can lease 12 times per year, 30 day minimum.
Key facts
- Screened lanai
- Beach 2 miles away
- Sliding glass door
Tags
Property features AI
Finance
- HOA & community: Community amenities include barbecue and pool
Exterior
- Parking: No garage; No carport
- Security: No security features listed
- Utilities: No waterfront utilities specified
- Home design: Condominium; Living area approximately 995
- Construction: Metal roof
- Exterior features: Lanai/covered patio; Impact windows; Sliding windows; Metal roof; Pets allowed with approval; Not on waterfront
Interior
- Kitchen: Dishwasher, Range, Microwave, Refrigerator
- Bedrooms: 2 bedrooms
- Flooring: Tile
- Bathrooms: 2 full bathrooms
- Heating & cooling: Central air; Ceiling fan(s); Electric heat
- Interior features: Dishwasher, Dryer, Microwave, Range, Refrigerator, Washer; Tile flooring; Ceiling fans; Central air conditioning; Electric heating
- Laundry & utility: Washer and Dryer included
Neighborhood map
What this means for you Summary
Snapshot
- This is a 2-bed/2.0-bath condo listed at $315k.
Deal economics
- At list price, monthly cash flow is $859 ($10k/yr) — positive.
- The deal already cash-flows at list — no discount required.
- Meets the 1% rule at list price ($5k rent vs $315k).
- Recommended offer: $305k (3.0% below list) — sets the bar for market timing.
Location & tenants
- Location reads 71/100 on livability (#404 in FL) — a middle-class / working-renter tenant base. Strengths: crime A+, employment A+, health & safety A+; Watch: amenities F, commute F, cost of living F.
- Collier (suburban): math 60% / reading 56% proficiency, ranked #16 of 73 in FL (top 22%) — acceptable for families but not a draw, mixed tenant base, ~2y average lease.
- Zoned schools: Tommie Barfield Elementary School (math 84% / reading 75%, grade A, #116 of 2,144 statewide, top 6%, 464 students, 30% FRL); Manatee Middle School (math 61% / reading 43%, grade C+, #217 of 571 statewide, top 40%, 749 students, 64% FRL); Lely High School (math 40% / reading 39%, grade F, #304 of 667 statewide, top 47%, 1,504 students, 54% FRL).
- Market conditions: Rents rising fast (+6.6%/yr); 689 active listings in the ZIP; 23 comparable units currently listed for rent nearby; rentals at typical pace (median 25d on market — plan ~3-4 weeks tenant-placement turnaround); solid renter incomes; 3,520 units permitted in Collier County in 2024 (959 in 5+ unit buildings).
- At $5,138/mo this rent would consume 61% of the median local household income ($102k/yr) (locally 314% of renters already pay >50% of income on rent) — very limited rent-growth headroom before tenants either downsize or default.
Forward outlook
- Local home prices are declining (-3.0%/yr); year-one equity from $2k of loan paydown is wiped out by about $9k of value loss. Plan a longer hold.
- Collier County population projected at +30% by 2050 — long-run rental-demand tailwind backs the buy-and-hold thesis.
- At projected returns (-3.0% appreciation + 6.6% rent growth), your $88k cash investment doubles in ~7 years — after that, you're playing with house money.
Negotiation context
- It's been on market 51 days — a 3% lower offer ($305k) is reasonable based on typical stale-listing flexibility.
- 7 sale attempts since 17y ago with the ask held roughly flat each time — persistent listings suggest the price (not the market) is what's stuck; bring a comps-based counter.
- Current owner paid $189k; list at $315k implies a 67% gain — meaningful room to come down on a strong offer.
Risks & watch-outs
- Watch-outs: flood insurance adds $427/mo.
- Climate carrying-cost: in FEMA flood zone AE (mandatory federal flood insurance); severe wind risk, 99% chance of damaging wind over 30y; extreme-heat days projected 7→30/yr by 2055 (HVAC capex compounding) — expect insurance premiums to compound above CPI over the hold.
Questions for the listing agent
- It's been on market 51 days. Have you received any prior offers? Is the seller open to a 3% concession, seller financing, or rate buy-down credit?
- What's the actual annual flood-insurance premium (NFIP or private), and is the property in a SFHA with mandatory coverage?
- What does the HOA fee cover, when was the last increase, and are there any pending special assessments or reserve-fund shortfalls?
- Any open or pending special assessments — roof, HVAC, plumbing, elevator, façade? What's the per-unit balance and payoff schedule, and is the seller paying it off at close or rolling it to the buyer?
- Is there a deadline driving the sale (1031 exchange, divorce, estate, relocation)? That informs how much negotiation room exists.
- Schools are A-rated — typically a magnet for longer-tenancy family renters. What's the average tenant stay here, and is there a school-zone premium baked into asking?
- What's the average days-on-market for RENTAL listings here right now (not sales)? A rising rental-DOM trend means longer vacancies and softer asking-rent achievability than the comps imply.
- What's the recent tenant-quality profile in this submarket — average credit score on applications, eviction rate, late-payment / NSF rate, and stable-employment percentage? A property-management company in the area should have these aggregated.
- How much new apartment / multifamily construction is in the pipeline within 1–3 miles? Heavy new supply (>2% of stock underway) typically softens rents 12–24 months out; light construction supports rent growth.
Investment metrics
- 1% rule
- 1.63% ✓
- Cap rate
- 11.19%
- Cash-on-cash
- 17.50%
- DSCR
- 1.78
- GRM
- 5.1
CMA / ARV
No comps found within radius.
Projected returns pro-forma
-3.0% appreciation · 6.59% rent growth · sell at horizon
- IRR
- 6.5%
- Equity multiple
- 1.27×
- Total profit
- $23,626
- Equity at exit
- $46,953
- IRR
- 19.7%
- Equity multiple
- 3.03×
- Total profit
- $178,863
- Equity at exit
- $27,227
Cash invested: $88,172 (down + closing). Projections, not guarantees.
Landlord ↔ Tenant lean methodology
- Overall (STATE)
- 87 Strongly Landlord-Friendly
- State Florida
- 87 Strongly Landlord-Friendly · R+3
- County
- — inherits STATE
- City
- — inherits STATE
ZIP-level market 34145
- Rents YoY
- 6.6%
- Active inventory
- 689
- Price-to-rent
- 5.1×
Monthly cashflow live
- Estimated rent
- $5,138 high interval (Pro) →
- Mortgage (P&I)
- −$1,651
- Tax from tax record
- −$216 /mo · $2,594/yr
- Insurance
- −$131
- Flood insurance flood zone
- −$427 /mo · $5,118/yr
- HOA est. from 1 same-building comp
- −$775
- Vacancy / Maint / Mgmt
- −$1,079
- Net cashflow
- $859
Break-even live
Sensitivity live
| Price | -10% $1,037 | -5% $948 | +0% $859 | +5% $770 | +10% $681 |
|---|---|---|---|---|---|
| Rent | -10% $453 | -5% $656 | +0% $859 | +5% $1,062 | +10% $1,265 |
| Rate | -1.0pp $1,018 | -0.5pp $939 | base $859 | +0.5pp $778 | +1.0pp $694 |
UW: 25.0% down · 7.5% · 30yr · 1.5% tax · 5.0% vac · 8.0% maint · 8.0% mgmt
Financing live
Cash to close
- Down payment
- $78,725
- Closing costs
- $9,447
- Reserves months
- —
- Total cash needed
- —
Loan-product check · same deal, 3 products live
Conventional
25% down · 7.5% · 30yr
- Down + closing
- —
- Monthly P&I
- —
- Monthly cashflow
- —
- DSCR
- —
- Eligible?
- —
Personal DTI + credit; lowest rate.
DSCR
20% down · 8.5% · 30yr
- Down + closing
- —
- Monthly P&I
- —
- Monthly cashflow
- —
- DSCR
- —
- Eligible?
- —
No personal income docs; deal must DSCR.
Hard money
10% down · 12.0% · 12mo
- Down + closing
- —
- Monthly P&I
- —
- Monthly cashflow
- —
- DSCR
- —
- Eligible?
- —
Short-term bridge; refi at stabilization.
Rent comps 23 comps
| Address | Beds | Baths | Sqft | Rent | $/sqft | DOM | Units | Dist |
|---|---|---|---|---|---|---|---|---|
| 750 W Elkcam Cir #315 Marco Island, FL | 2.0 | 2.0 | 990 | $5,600 | $5.66 | 25d | 1 | 0.11mi |
| 761 W Elkcam Cir Unit B110 Marco Island, FL | 2.0 | 2.5 | 1066 | $3,500 | $3.28 | 25d | 1 | 0.13mi |
| 731 W Elkcam Cir Unit A109 Marco Island, FL | 2.0 | 2.5 | 1066 | $2,500 | $2.35 | 25d | 1 | 0.18mi |
| 694 W Elkcam Cir #1123 Marco Island, FL | 2.0 | 2.0 | 945 | $2,530 | $2.68 | 25d | 1 | 0.23mi |
| 651 W Elkcam Cir #815 Marco Island, FL | 2.0 | 2.0 | 813 | $4,700 | $5.78 | 25d | 1 | 0.24mi |
| 457 Tallwood St #106 Marco Island, FL | 1.0 | 1.0 | 539 | $1,600 | $2.97 | 25d | 1 | 0.80mi |
| 1215 Edington Pl Unit A6 Marco Island, FL | 1.0 | 1.0 | 570 | $4,500 | $7.89 | 22d | 1 | 1.00mi |
| 591 Seaview Ct Unit A306 Marco Island, FL | 2.0 | 2.0 | 964 | $6,000 | $6.22 | 25d | 1 | 1.01mi |
| 601 Seaview Ct Unit C106 Marco Island, FL | 2.0 | 2.0 | 964 | $5,700 | $5.91 | 25d | 1 | 1.07mi |
| 651 Seaview Ct Unit B207 Marco Island, FL | 2.0 | 2.0 | 1075 | $6,000 | $5.58 | 25d | 1 | 1.09mi |
| 440 Seaview Ct #912 Marco Island, FL | 2.0 | 2.0 | 1099 | $6,500 | $5.91 | 15d | 1 | 1.16mi |
| 380 Seaview Ct #305 Marco Island, FL | 2.0 | 2.0 | 1100 | $6,000 | $5.45 | 15d | 1 | 1.16mi |
| 260 Seaview Ct #604 Marco Island, FL | 2.0 | 2.0 | 1070 | $8,000 | $7.48 | 15d | 1 | 1.23mi |
| 240 Seaview Ct #413 Marco Island, FL | 1.0 | 1.0 | 750 | $6,500 | $8.67 | 25d | 1 | 1.25mi |
| 60 Pelican St W Naples, FL | 1.0 | 1.0 | 941 | $2,875 | $3.06 | 25d | 2 | 1.27mi |
| 240 Seaview Ct #211 Marco Island, FL | 2.0 | 2.0 | 1075 | $11,000 | $10.23 | 22d | 1 | 1.27mi |
| 167 N Collier Blvd Marco Island, FL | 2.0 | 1.0 | 555 | $2,100 | $3.78 | 15d | 2 | 1.29mi |
| 130 N Collier Blvd Unit A6 Marco Island, FL | 2.0 | 1.0 | 704 | $1,900 | $2.70 | 25d | 1 | 1.35mi |
| 180 Seaview Ct Marco Island, FL | 1.0–2.0 | 1.5–2.0 | 721 | $4,500 | $6.24 | 25d | 2 | 1.38mi |
| 140 Seaview Ct Unit 902S Marco Island, FL | 2.0 | 2.0 | 837 | $9,000 | $10.75 | 25d | 1 | 1.39mi |
| 140 Seaview Ct #1504 Marco Island, FL | 1.0 | 1.5 | 610 | $2,200 | $3.61 | 25d | 1 | 1.39mi |
| 87 N Collier Blvd Unit J16 Marco Island, FL | 2.0 | 1.5 | 787 | $5,550 | $7.05 | 15d | 1 | 1.43mi |
| 87 N Collier Blvd Marco Island, FL | 1.0–2.0 | 1.0–1.5 | 663 | $5,550 | $8.36 | 25d | 3 | 1.45mi |
HOA detail condo
- Monthly dues
- $0 · $0/yr
- Likely covers
- pool
- Assessments
- None detected in remarks — confirm with the listing agent.
Listing history 35 events
-
2026-06-21days on market $314,900 Active 51 DOM
-
2026-06-18days on market $314,900 Active 48 DOM
-
2026-06-17days on market $314,900 Active 47 DOM
-
2026-06-16days on market $314,900 Active 46 DOM
-
2026-06-15days on market $314,900 Active 45 DOM
-
2026-06-14days on market $314,900 Active 43 DOM
-
2026-06-10days on market $314,900 Active 40 DOM
-
2026-06-09days on market $314,900 Active 39 DOM
-
2026-06-08days on market $314,900 Active 38 DOM
-
2026-06-07days on market $314,900 Active 37 DOM
-
2026-06-03days on market $314,900 Active 33 DOM
-
2026-06-02days on market $314,900 Active 32 DOM
-
2026-06-01days on market $314,900 Active 31 DOM
-
2026-05-31days on market $314,900 Active 30 DOM
-
2026-05-30days on market $314,900 Active 29 DOM
-
2026-05-01$314,900 Active
-
2026-01-08historical $2,300
-
2025-11-18$2,300
-
2025-11-17historical
-
2025-10-03$385,000 Active
-
2025-04-30historical
-
2025-03-19status Active
-
2025-03-17historical
-
2025-02-11price $399,900
-
2024-07-04price $419,900
-
2024-06-15price $424,900
-
2024-06-12$429,900 Active
-
2019-05-24soldstatus $189,000
-
2013-12-17soldstatus $107,500
-
2013-12-12price $124,900
-
2013-12-12soldstatus $107,500
-
2013-07-02$107,500
-
2011-05-11soldstatus $83,500
-
2011-05-06soldstatus $83,500
-
2009-09-21$134,900
ⓘ Source: listings_history table (triggers on properties + properties_extension) + one-shot
backfill from property_details.listing_events for pre-trigger history.
Tax reassessment forecast FL · Resets to sale price
- Current annual tax
- $2,594 · $216/mo
- Projected year-2 tax
- $2,614 · $218/mo
- Expected delta
- +$20/yr (+$2/mo · 0.8%)
ⓘ Screening estimate from a state-policy table — verify with the county assessor before closing.
Climate risk First Street
- Flood 9/10 Extreme FEMA zone AE · 99% chance over 30 yrs
- Wildfire 3/10 Moderate
- Heat 10/10 Extreme 7 d/yr ≥108°F today · 30 d/yr by 30 yrs out
- Wind 10/10 Extreme 99% chance of damaging wind over 30 yrs
- Air quality 3/10 Moderate 3 unhealthy d/yr today · 3 by 30 yrs out
Nearby sold comps map
Loading sold comps map…
Walkable amenities ~0.75 mi
Loading nearby amenities…
Taxation est. · year 1
- Rental income
- $61,662
- − Mortgage interest
- −$17,639
- − Property taxes
- −$2,594
- − Insurance
- −$6,693
- − Repairs & maintenance
- −$4,933
- − Management
- −$4,933
- − HOA
- −$9,300
- − Depreciation
- −$9,161
- Taxable income
- $6,409
- Est. tax owed @ 24.0%
- −$1,538
- After-tax cash flow
- $8,771/yr
For passive investors: Depreciation is non-cash, so a rental often shows a tax loss while cash-flowing — sheltering income. Rental losses are passive: they offset passive income freely, and up to $25,000/yr can offset ordinary (W-2) income if you actively participate and your MAGI is under $100k (phasing out to $0 by $150k); unused losses carry forward. On sale, claimed depreciation is recaptured at up to 25%, and gains may owe capital-gains tax (a 1031 exchange can defer both). Figures are a year-1 estimate at your 24.0% rate — not tax advice; consult a CPA.
Schools (NCES district)
- District
- Collier
- NCES district ID
- 1200330
- Math proficiency
- 60% ▼ -4.00%
- Reading proficiency
- 56% ▼ -2.00%
- Median HH income
- $58,275
- Composite
- 50.23/100
- National rank
- #1892
- State rank
- #16 of 73 in FL
Livability — Marco Island
- Score
- 71/100
- State rank
- #404
- US rank
- #7149
Category grades
Schools grade is shown separately in the Schools card above.
Census & demographics
- Census place
- Marco Island, FL
- County
- Collier County · 396,295 people
- City population
- 16,205
- Metro
- Naples-Marco Island, FL
- Population (ZIP)
- 16,205
- Household income
- $101,523
- Rent vs Own
- Severe rent burden
- 314.0
Population outlook (Collier County) Hauer SSP2
- Today (2025)
- 420,858 people
- By 2030
- 450,054 · +6.9%
- By 2040
- 502,232 · +19.3%
- By 2050
- 544,932 · +29.5%
- By 2075
- 627,203 · +49.0%
- By 2100
- 659,015 · +56.6%
Race, ethnicity, and origin ACS 2023
- Neighborhood character
- Predominantly White (90%)
- Race & ethnicity
- White 90% Hispanic / Latino 7% Two or more races 6%
- Hispanic origin (detail)
- Mexican 1% Puerto Rican 1% Cuban 2%
- Common ancestry
- Romanian 5% Lithuanian 2% Slovak 2%
- Foreign-born
- 9% · Canada
- Languages at home
- 90% English-only · Spanish 5% Other Indo-European 1% German/W. Germanic 1%
Political lean MEDSL · Collier
- 2024 margin
- Solid R (+33.1) · D 33.1% · R 66.2%
- 2008→2024 swing
- -10.6pp toward R · 2008: -22.5pp · 2024: -33.1pp
- All cycles
- 2024: R+33.1 2020: R+24.7 2016: R+26.0 2012: R+30.1 2008: R+22.5
Not yet ingested
- Civics
- —
Market trends
- HPI YoY
- ▼ -374.55%
- Current HPI
- 284.7538
- Rent YoY
- ▲ 6.59%
- Metro
- Naples-Marco Island, FL
- State GDP YoY
- ▲ 3.28%
- F500 in state
- 36
Industry mix (Fortune 500 HQ in FL)
| Industry | F500 HQs | Revenue |
|---|---|---|
| Industrial Technology | 2 | $29B |
|
||
| Insurance | 2 | $17B |
|
||
| Retail | 1 | $60B |
|
||
| Technology Distribution | 1 | $58B |
|
||
| Homebuilding | 1 | $35B |
|
||
| Technology Manufacturing | 1 | $35B |
|
||
Price history
+133.4% since first listed20 events — show timeline
- 2026-05-01 Listed $314,900 MIML
- 2026-01-08 Rental Removed $2,300 NAPLESMLS
- 2025-11-18 Listed for Rent $2,300 NAPLESMLS
- 2025-11-17 Listing Removed — NAPLESMLS
- 2025-10-03 Listed $385,000 NAPLESMLS
- 2025-04-30 Listing Removed — NAPLESMLS
- 2025-03-19 Relisted — NAPLESMLS
- 2025-03-17 Listing Removed — NAPLESMLS
- 2025-02-11 Price Changed $399,900 NAPLESMLS
- 2024-07-04 Price Changed $419,900 NAPLESMLS
- 2024-06-15 Price Changed $424,900 NAPLESMLS
- 2024-06-12 Listed $429,900 NAPLESMLS
- 2019-05-24 Sold (Public Records) $189,000 Public Records
- 2013-12-17 Sold (Public Records) $107,500 Public Records
- 2013-12-12 Sold (MLS) $107,500 NAPLESMLS
- 2013-12-12 Price Changed $124,900 NAPLESMLS
- 2013-07-02 Listed $107,500 NAPLESMLS
- 2011-05-11 Sold (Public Records) $83,500 Public Records
- 2011-05-06 Sold (MLS) $83,500 NAPLESMLS
- 2009-09-21 Listed $134,900 NAPLESMLS
Property tax history
+8.6%/yrLatest (2025): $2,594 · -2.8% YoY. Source: county tax records.
Cash-flow waterfall
monthlySold comps — $/sqft
last 12 mo · ≤1 miLoading sold comps…