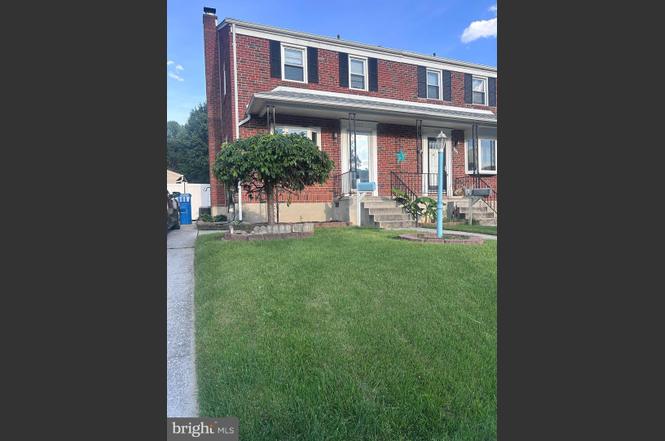
127 Lyndale Ave · Overlea, MD
Flood risk 1/10 · Minimal
- FEMA flood zone
- X (unshaded)
- Chance of flooding over 30 yrs
- 0.0%
- Est. flood insurance / yr
- $473 – $860
Fire risk 1/10 · Minimal
- Est. fire insurance / yr
- $755 – $1,403
Heat risk 7/10 · Major
- Hot days now (above 104°F)
- 7 days/yr
- Hot days in 30 yrs
- 15 days/yr
Wind risk 6/10 · Moderate
- Chance of severe wind over 30 yrs
- 27.0%
Air-quality risk 4/10 · Minor
- Unhealthy air days now
- 5 days/yr
- Unhealthy air days in 30 yrs
- 7 days/yr
Risk factors via First Street. Map © Google.
Why this score? — see what drove the D+ grade
The composite is a weighted blend of 9 inputs, each scored 0–100. Each bar is that input's sub-score; the figure is the points it added to the 100-point composite (weight × sub-score).
- Cash flow +19.6/30.0
- DSCR +6.2/10.0
- ARV discount +5.8/15.0
- 1% rule +4.7/10.0
- Livability +4.0/5.0
- Rent growth +3.8/5.0
- Condition / age +2.5/5.0
- Schools +2.3/10.0
- Appreciation +0.0/10.0
$274,900
🖨 Deal sheet (PDF) 📄 Offer letter ✓ Due diligence
Listing remarks
Coming Soon! Beautifully maintained Nottingham home with a private driveway and plenty of space to enjoy both indoors and out. The spacious living room features a cozy brick-surround pellet stove, creating a warm and inviting atmosphere leading to the updated galley-style kitchen is equipped with stainless steel appliances and a gas range. The upper level features 3 bedrooms and a full bath. The lower level offers a fully finished basement that provides valuable additional living space and includes a full bathroom, laundry area, and direct outdoor access. What truly sets this property apart is the all-season sunroom, offering year-round enjoyment with two sliding glass doors that open to th
Key facts
- Private driveway
- Full bath
- Galley style kitchen
Tags
Property features AI
Exterior
- Parking: Driveway; On-street parking; Off-street parking
- Utilities: Public water; Public sewer
- Home design: Semi-detached home; Estimated year built
- Construction: Brick construction; Block foundation
- Exterior features: Not in a federal flood zone; Above grade and below grade structures noted
Interior
- Bedrooms: Three bedrooms on the primary upper level
- Bathrooms: Two full bathrooms (one on upper level, one on lower level)
- Heating & cooling: Natural gas heating; Central air conditioning with ductless/mini-split
- Interior features: Estimated living area; Daylight, partial basement with interior access, outside entrance, connecting stairway; Basement is partially finished and full
Neighborhood map
What this means for you Summary
Snapshot
- This is a 3-bed/2.0-bath townhouse listed at $275k.
Deal economics
- At list price, monthly cash flow is $316 ($4k/yr) — positive.
- The deal already cash-flows at list — no discount required.
- To meet the 1% rule (rent ≥ 1% of price), the offer needs to be $265k (3.5% below list).
- Recommended offer: $265k (3.5% below list) — sets the bar for 1% rule.
- Cap rate 7.7% vs local median 5.3% in Overlea — top-decile yield for the area; either an underpriced asset or a hidden risk that comps aren't pricing in. Stress-test before assuming the spread holds.
Location & tenants
- Location reads 81/100 on livability (#38 in MD, #1,418 nationally) — a professional / high-income tenant draw. Strengths: amenities A+, commute A+, housing A+; Watch: crime F.
- Baltimore County Public Schools (suburban): math 15% / reading 34% proficiency, ranked #11 of 24 in MD (top 46%) — low school quality limits family demand, transient renter base, plan for 1-2y turnover.
- Zoned schools: Fullerton Elementary (math 21% / reading 26%, grade F, #285 of 860 statewide, top 33%, 411 students, 58% FRL); Parkville Middle (math 9% / reading 43%, grade F, #91 of 225 statewide, top 42%, 999 students, 55% FRL); Overlea High (math 2% / reading 27%, grade F, #185 of 222 statewide, top 85%, 1,365 students, 63% FRL) — zoned schools average 59% FRL vs 39% district-wide (20 pts higher); higher-poverty schools than district average — tighter screening recommended.
- Market conditions: Rents rising fast (+5.3%/yr); 132 active listings in the ZIP; 11 comparable units currently listed for rent nearby; rentals at typical pace (median 18d on market — plan ~3-4 weeks tenant-placement turnaround); solid renter incomes; 1,511 units permitted in Baltimore County in 2024 (643 in 5+ unit buildings).
- This rent runs 33% of the median local income ($95k/yr) — at the standard rent-burdened threshold; future hikes will face affordability resistance.
Forward outlook
- Local home prices are declining (-3.0%/yr); year-one equity from $2k of loan paydown is wiped out by about $8k of value loss. Plan a longer hold.
- Baltimore County population projected at +12% by 2050 — modest demand growth; plan on rents tracking national, not racing it.
Negotiation context
- Only 3 days on market — expect competitive offers; lowballing is unlikely to land.
Risks & watch-outs
- Watch-outs: built in 1953 — expect roof / HVAC / electrical / plumbing capex.
- Climate carrying-cost: major wind risk, 27% chance of damaging wind over 30y; extreme-heat days projected 7→15/yr by 2055 (HVAC capex compounding) — expect insurance premiums to compound above CPI over the hold.
Questions for the listing agent
- Built in 1953 — when were the roof, HVAC, electrical panel, plumbing, and water heater last replaced?
- Is there a deadline driving the sale (1031 exchange, divorce, estate, relocation)? That informs how much negotiation room exists.
- Crime grade is F in this area — have there been break-ins, vandalism, or insurance claims at this property in the last 3 years? What carrier currently insures it and at what premium?
- The area grade is low — what's the realistic commute time and amenity access for the typical tenant pool here? Any planned neighborhood developments (good or bad) we should know about?
- What's the average days-on-market for RENTAL listings here right now (not sales)? A rising rental-DOM trend means longer vacancies and softer asking-rent achievability than the comps imply.
- What's the recent tenant-quality profile in this submarket — average credit score on applications, eviction rate, late-payment / NSF rate, and stable-employment percentage? A property-management company in the area should have these aggregated.
- How much new for-sale + rental construction is in the pipeline within 1–3 miles? Heavy new supply typically softens prices + rents 12–24 months out; constrained supply supports both.
Investment metrics
- 1% rule
- 0.97% ✗
- Cap rate
- 7.67%
- Cash-on-cash
- 4.92%
- DSCR
- 1.22
- GRM
- 8.6
CMA / ARV
- ARV (on-the-fly)
- $265,068
- Comps found
- 5
Show comp detail 5 sales within ~0.75 mi
| Address | Dist | Beds/Ba | Sqft | Sold | Price | $/sf | Match |
|---|---|---|---|---|---|---|---|
| 204 Lyndale Ave | 0.07mi | 3/2.0 | 1,740 (-3%) | 3mo | $257,000 | $148 | 90 |
| 118 Sipple Ave | 0.11mi | 3/2.0 | 1,730 (-3%) | 8mo | $275,000 | $159 | 82 |
| 112 Sipple Ave | 0.12mi | 3/2.0 | 1,740 (-3%) | 16mo | $255,000 | $147 | 77 |
| 5144 Terrace Dr | 0.09mi | 3/1.5 | 1,658 (-7%) | 19mo | $300,000 | $181 | 66 |
| 301 3rd St | 0.57mi | 2/2.0 (-1) | 1,833 (+2%) | 6mo | $249,500 | $136 | 59 |
Match score weights: distance 35% · size 25% · config 20% · recency 20%. Top-matched comps best support the ARV.
Projected returns pro-forma
-3.0% appreciation · 5.34% rent growth · sell at horizon
- IRR
- -6.2%
- Equity multiple
- 0.77×
- Total profit
- $-18,082
- Equity at exit
- $40,988
- IRR
- 6.0%
- Equity multiple
- 1.49×
- Total profit
- $37,528
- Equity at exit
- $23,768
Cash invested: $76,972 (down + closing). Projections, not guarantees.
Landlord ↔ Tenant lean methodology
- Overall (STATE)
- 27 Tenant-Leaning
- State Maryland
- 27 Tenant-Leaning · D+14
- County
- — inherits STATE
- City
- — inherits STATE
ZIP-level market 21236
- Rents YoY
- 5.3%
- Active inventory
- 132
- Price-to-rent
- 8.6×
Monthly cashflow live
- Estimated rent
- $2,653 high interval (Pro) →
- Mortgage (P&I)
- −$1,442
- Tax from tax record
- −$224 /mo · $2,693/yr
- Insurance
- −$115
- HOA
- −$0
- Vacancy / Maint / Mgmt
- −$557
- Net cashflow
- $316
Break-even live
Sensitivity live
| Price | -10% $471 | -5% $393 | +0% $316 | +5% $238 | +10% $160 |
|---|---|---|---|---|---|
| Rent | -10% $106 | -5% $211 | +0% $316 | +5% $420 | +10% $525 |
| Rate | -1.0pp $454 | -0.5pp $386 | base $316 | +0.5pp $244 | +1.0pp $172 |
UW: 25.0% down · 7.5% · 30yr · 1.5% tax · 5.0% vac · 8.0% maint · 8.0% mgmt
Financing live
Cash to close
- Down payment
- $68,725
- Closing costs
- $8,247
- Reserves months
- —
- Total cash needed
- —
Loan-product check · same deal, 3 products live
Conventional
25% down · 7.5% · 30yr
- Down + closing
- —
- Monthly P&I
- —
- Monthly cashflow
- —
- DSCR
- —
- Eligible?
- —
Personal DTI + credit; lowest rate.
DSCR
20% down · 8.5% · 30yr
- Down + closing
- —
- Monthly P&I
- —
- Monthly cashflow
- —
- DSCR
- —
- Eligible?
- —
No personal income docs; deal must DSCR.
Hard money
10% down · 12.0% · 12mo
- Down + closing
- —
- Monthly P&I
- —
- Monthly cashflow
- —
- DSCR
- —
- Eligible?
- —
Short-term bridge; refi at stabilization.
Rent comps 11 comps
| Address | Beds | Baths | Sqft | Rent | $/sqft | DOM | Units | Dist |
|---|---|---|---|---|---|---|---|---|
| 101 Elinor Ave Nottingham, MD | 4.0 | 2.0 | 1476 | $2,900 | $1.96 | 45d | 1 | 0.18mi |
| 100 Elinor Ave Nottingham, MD | 4.0 | 2.5 | 1800 | $2,800 | $1.56 | 25d | 1 | 0.20mi |
| 5110 Kenwood Ave Baltimore, MD | 3.0 | 1.5 | 1406 | $2,500 | $1.78 | 45d | 1 | 0.34mi |
| 5 Belhaven Dr Nottingham, MD | 4.0 | 1.5 | 1554 | $2,000 | $1.29 | 45d | 1 | 0.59mi |
| 29 E Elm Ave Baltimore, MD | 3.0 | 2.0 | 2052 | $3,000 | $1.46 | 6d | 1 | 0.64mi |
| 7726 Heathers Ln Nottingham, MD | 4.0 | 2.5 | 2397 | $3,500 | $1.46 | 18d | 1 | 0.98mi |
| 3617 Double Rock Ln Parkville, MD | 3.0 | 2.5 | 2000 | $2,395 | $1.20 | 6d | 1 | 1.01mi |
| 7935 Belridge Rd Nottingham, MD | 1.0–3.0 | 1.0–1.5 | 974 | $2,213 | $2.27 | 0d | 19 | 1.19mi |
| 5938 Clayton Ave Baltimore, MD | 4.0 | 2.0 | 1296 | $2,872 | $2.22 | 18d | 1 | 1.20mi |
| 8501 Franklin Square Dr Baltimore, MD | 1.0–3.0 | 1.0–2.0 | 950 | $2,780 | $2.93 | 0d | 18 | 1.37mi |
| 30 Morning Ct Rosedale, MD | 3.0 | 3.5 | 1980 | $3,350 | $1.69 | 19d | 1 | 1.42mi |
Listing history 7 events
-
2026-06-21days on market $274,900 Active 3 DOM
-
2026-06-19statusdays on market $274,900 Active 1 DOM
-
2026-06-18days on market $274,900 Coming Soon 5 DOM
-
2026-06-17days on market $274,900 Coming Soon 4 DOM
-
2026-06-16days on market $274,900 Coming Soon 3 DOM
-
2026-06-15remarks 699-char remark
-
2026-06-15$274,900 Coming Soon 2 DOM
ⓘ Source: listings_history table (triggers on properties + properties_extension) + one-shot
backfill from property_details.listing_events for pre-trigger history.
Tax reassessment forecast MD · Partial reset (capped growth)
- Current annual tax
- $2,693 · $224/mo
- Projected year-2 tax
- $2,845 · $237/mo
- Expected delta
- +$152/yr (+$13/mo · 5.6%)
ⓘ Screening estimate from a state-policy table — verify with the county assessor before closing.
Climate risk First Street
- Flood 1/10 Low FEMA zone X (unshaded) · 0% chance over 30 yrs
- Wildfire 1/10 Low
- Heat 7/10 Severe 7 d/yr ≥104°F today · 15 d/yr by 30 yrs out
- Wind 6/10 Major 27% chance of damaging wind over 30 yrs
- Air quality 4/10 Moderate 5 unhealthy d/yr today · 7 by 30 yrs out
Nearby sold comps map
Loading sold comps map…
Walkable amenities ~0.75 mi
Loading nearby amenities…
Taxation est. · year 1
- Rental income
- $31,841
- − Mortgage interest
- −$15,399
- − Property taxes
- −$2,693
- − Insurance
- −$1,374
- − Repairs & maintenance
- −$2,547
- − Management
- −$2,547
- − Depreciation
- −$7,997
- Taxable loss
- −$717
- Est. tax savings @ 24.0%
- +$172
- After-tax cash flow
- $3,960/yr
For passive investors: Depreciation is non-cash, so a rental often shows a tax loss while cash-flowing — sheltering income. Rental losses are passive: they offset passive income freely, and up to $25,000/yr can offset ordinary (W-2) income if you actively participate and your MAGI is under $100k (phasing out to $0 by $150k); unused losses carry forward. On sale, claimed depreciation is recaptured at up to 25%, and gains may owe capital-gains tax (a 1031 exchange can defer both). Figures are a year-1 estimate at your 24.0% rate — not tax advice; consult a CPA.
Schools (NCES district)
- District
- Baltimore County Public Schools
- NCES district ID
- 2400120
- Math proficiency
- 15% ▼ -16.00%
- Reading proficiency
- 34% ▼ -5.00%
- Median HH income
- $66,746
- Composite
- 23.17/100
- National rank
- #7948
- State rank
- #11 of 24 in MD
Livability — Overlea
- Score
- 81/100
- State rank
- #38
- US rank
- #1418
Category grades
Schools grade is shown separately in the Schools card above.
Census & demographics
- Census place
- Overlea, MD
- County
- Baltimore County · 769,527 people
- Metro
- Baltimore-Columbia-Towson, MD
- Population (ZIP)
- 39,514
- Household income
- $95,149
- Rent vs Own
- Severe rent burden
- 1476.0
Population outlook (Baltimore County) Hauer SSP2
- Today (2025)
- 885,518 people
- By 2030
- 909,272 · +2.7%
- By 2040
- 951,547 · +7.5%
- By 2050
- 990,955 · +11.9%
- By 2075
- 1,086,411 · +22.7%
- By 2100
- 1,135,078 · +28.2%
Race, ethnicity, and origin ACS 2023
- Neighborhood character
- Diverse neighborhood (Simpson 0.63)
- Race & ethnicity
- White 56% Black 19% Asian 16% Hispanic / Latino 6% Two or more races 5%
- Hispanic origin (detail)
- Mexican 1% Puerto Rican 1%
- Common ancestry
- Romanian 5% Lithuanian 2% Italian 1%
- Foreign-born
- 17% · Canada, South Korea, Vietnam
- Languages at home
- 79% English-only · Other Indo-European 8% Spanish 3% Tagalog/Filipino 2%
Political lean MEDSL · Baltimore
- 2024 margin
- Strong D (+24.5) · D 61.0% · R 36.5% · Other 2.5%
- 2008→2024 swing
- +9.9pp toward D · 2008: 14.6pp · 2024: 24.5pp
- All cycles
- 2024: D+24.5 2020: D+27.0 2016: D+17.4 2012: D+16.4 2008: D+14.6
Not yet ingested
- Civics
- —
Market trends
- HPI YoY
- ▼ -268.43%
- Current HPI
- 244.9907
- Rent YoY
- ▲ 5.34%
- Metro
- Baltimore-Columbia-Towson, MD
- State GDP YoY
- ▲ 2.97%
- F500 in state
- 12
Industry mix (Fortune 500 HQ in MD)
| Industry | F500 HQs | Revenue |
|---|---|---|
| Aerospace / Defense | 1 | $71B |
|
||
| Utilities | 1 | $25B |
|
||
| Hotels | 1 | $24B |
|
||
| Consumer Goods | 1 | $7B |
|
||
| Real Estate | 1 | $6B |
|
||
| Chemicals | 1 | $2B |
|
||
Price history
+208.9% since first listed9 events — show timeline
- 2026-06-14 Coming Soon $274,900 BRIGHT MLS
- 2023-02-09 Listing Removed — BRIGHT MLS
- 2023-02-04 Coming Soon — BRIGHT MLS
- 2022-07-05 Sold (Public Records) $270,000 Public Records
- 2022-06-21 Sold (MLS) $270,000 BRIGHT MLS
- 2022-05-25 Contingent — BRIGHT MLS
- 2022-05-19 Listed $249,900 BRIGHT MLS
- 1993-06-05 Sold (Public Records) $96,000 Public Records
- 1990-02-12 Sold (Public Records) $89,000 Public Records
Property tax history
+2.1%/yrLatest (2025): $2,693 · +4.5% YoY. Source: county tax records.
Cash-flow waterfall
monthlySold comps — $/sqft
last 12 mo · ≤1 miLoading sold comps…