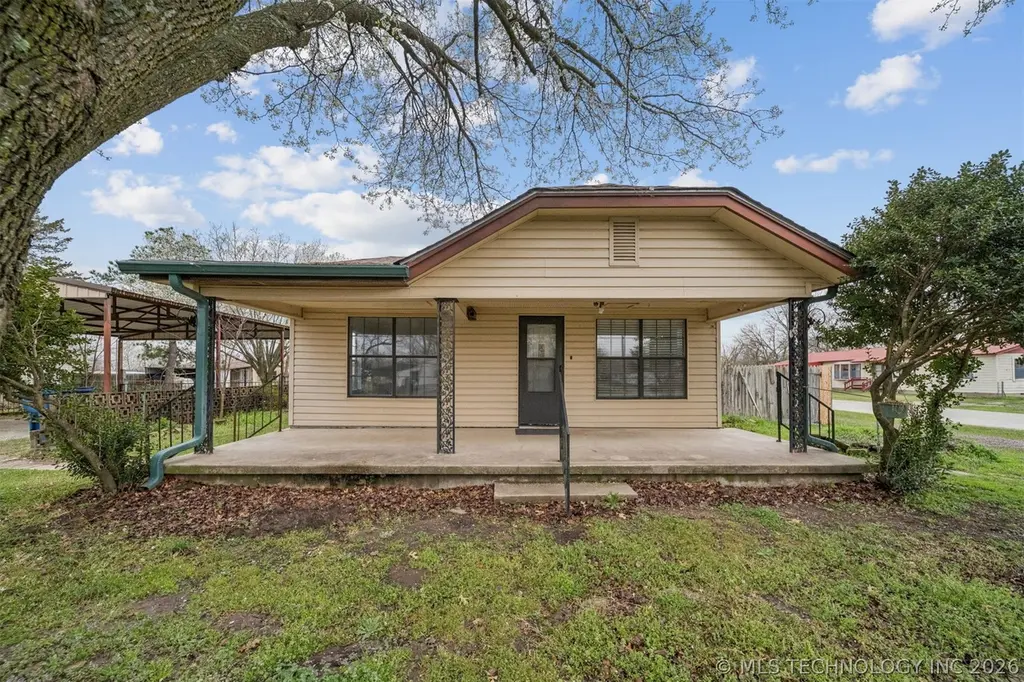
205 N Baltimore · Allen, OK
Flood risk 1/10 · Minimal
- FEMA flood zone
- X (unshaded)
- Chance of flooding over 30 yrs
- 0.0%
- Est. flood insurance / yr
- $507 – $1,088
Fire risk 6/10 · Moderate
- Est. fire insurance / yr
- $2,463 – $4,575
Heat risk 6/10 · Moderate
- Hot days now (above 110°F)
- 7 days/yr
- Hot days in 30 yrs
- 19 days/yr
Wind risk 4/10 · Minor
- Chance of severe wind over 30 yrs
- 11.0%
Air-quality risk 2/10 · Minimal
- Unhealthy air days now
- 0 days/yr
- Unhealthy air days in 30 yrs
- 1 days/yr
Risk factors via First Street. Map © Google.
Why this score? — see what drove the C+ grade
The composite is a weighted blend of 9 inputs, each scored 0–100. Each bar is that input's sub-score; the figure is the points it added to the 100-point composite (weight × sub-score).
- Cash flow +19.3/30.0
- ARV discount +15.0/15.0
- Appreciation +7.3/10.0
- DSCR +6.1/10.0
- 1% rule +4.4/10.0
- Livability +3.0/5.0
- Rent growth +2.5/5.0
- Condition / age +2.5/5.0
- Schools +1.4/10.0
$127,000
🖨 Deal sheet 📄 Offer letter ✓ Due diligence
Listing remarks MLS
(3)Ba, (1)Ba, nice size rooms, large kitchen with lots of cabinets & counter space, utility, cover porch, large yard, large carport, cellar (condition unknown) potential garden spot, shed & shop combo. , some mature trees on corner lot!
Key facts
- Fully fenced
- Covered sitting area
- Oversized lot
Tags
Property features AI
Finance
- Financial info: Financial details not provided
- HOA & community: Gutters listed as a community feature
Exterior
- Parking: 2-car garage; Carport; Boat parking; RV access/parking
- Security: Storm shelter
- Utilities: Electricity available; Natural gas available; Public water; Public sewer
- Home design: Single-story home; Faces east; Entry level not specified; Property type not specified
- Construction: Built per public records (year not specified); Vinyl siding with wood frame construction; Asphalt/fiberglass roof; Crawlspace foundation
- Exterior features: Covered patio and porch; Porch; Patio; Arbor; Rain gutters; Workshop; Storm shelter; Full privacy and chain link fencing with cross-fenced sections; Corner lot with mature trees
Interior
- Kitchen: Dishwasher; Disposal; Microwave; Oven; Range; Stove; Gas water heater
- Bedrooms: Bedroom count not provided
- Flooring: Carpet; Laminate
- Bathrooms: 1 full bathroom; 1 half bathroom
- Heating & cooling: Gas heating; Space heater; Window cooling units (multiple); Central cooling not specified
- Interior features: Ceiling fans; Laminate counters; Gas range connection; No additional interior features listed
- Laundry & utility: Washer hookup; Electric dryer hookup
Neighborhood map
What this means for you Summary
Snapshot
- This is a 3-bed/2.0-bath single-family listed at $127k.
Deal economics
- At list price, monthly cash flow is $140 ($2k/yr) — positive.
- The deal already cash-flows at list — no discount required.
- To meet the 1% rule (rent ≥ 1% of price), the offer needs to be $120k (5.7% below list).
- Recommended offer: $119k (6.0% below list) — sets the bar for market timing.
Location & tenants
- Location reads 60/100 on livability (#339 in OK) — a middle-class / working-renter tenant base. Strengths: cost of living A+, housing A; Watch: schools F, amenities F, commute F.
- Allen (rural): math 17% / reading 15% proficiency, ranked #208 of 270 in OK (top 77%) — low school quality limits family demand, transient renter base, plan for 1-2y turnover; 65% free/reduced lunch — lower-income household profile, screen leases tightly.
- Market conditions: 25 active listings in the ZIP; 2 units permitted in Pontotoc County in 2024 (0 in 5+ unit buildings).
Forward outlook
- In year one you build about $7k of equity ($878 loan paydown + $6k appreciation (4.5% local appreciation)).
- Pontotoc County population projected at +7% by 2050 — modest demand growth; plan on rents tracking national, not racing it.
- At projected returns (4.5% appreciation + 3.0% rent growth), your $36k cash investment doubles in ~4 years — after that, you're playing with house money.
- By year 6, paydown + projected appreciation supports a ~$36k cash-out refi (75% LTV) — recoverable capital for the next deal without selling this one.
Negotiation context
- It's been on market 81 days — a 6% lower offer ($119k) is reasonable based on typical stale-listing flexibility.
- 3 sale attempts since 5y ago; this cycle's ask has dropped $27k (18%) from the opening price — seller is motivated, your offer sets the floor, not the list.
- Current owner paid $90k; 42% above their basis — modest negotiation headroom, anchor on the comps not their cost.
Risks & watch-outs
- Watch-outs: built in 1950 — expect roof / HVAC / electrical / plumbing capex.
- Climate carrying-cost: major wildfire risk; extreme-heat days projected 7→19/yr by 2055 (HVAC capex compounding) — expect insurance premiums to compound above CPI over the hold.
Questions for the listing agent
- It's been on market 81 days. Have you received any prior offers? Is the seller open to a 6% concession, seller financing, or rate buy-down credit?
- Built in 1950 — when were the roof, HVAC, electrical panel, plumbing, and water heater last replaced?
- Why hasn't it sold? Are there any deal-killer items the seller is aware of (foundation, flood, title, zoning, code violations)?
- Is there a deadline driving the sale (1031 exchange, divorce, estate, relocation)? That informs how much negotiation room exists.
- Schools are F-rated, which usually means shorter tenancies and higher turnover. Who's the typical renter profile here, and what's been the actual vacancy rate?
- What's the average days-on-market for RENTAL listings here right now (not sales)? A rising rental-DOM trend means longer vacancies and softer asking-rent achievability than the comps imply.
- What's the recent tenant-quality profile in this submarket — average credit score on applications, eviction rate, late-payment / NSF rate, and stable-employment percentage? A property-management company in the area should have these aggregated.
- How much new for-sale + rental construction is in the pipeline within 1–3 miles? Heavy new supply typically softens prices + rents 12–24 months out; constrained supply supports both.
Investment metrics
- 1% rule
- 0.94% ✗
- Cap rate
- 7.62%
- Cash-on-cash
- 4.73%
- DSCR
- 1.21
- GRM
- 8.8
CMA / ARV
- ARV (on-the-fly)
- $184,452
- Comps found
- 9
Show comp detail 9 sales within ~0.75 mi
| Address | Dist | Beds/Ba | Sqft | Sold | Price | $/sf | Match |
|---|---|---|---|---|---|---|---|
| 604 E Broadway | 0.14mi | 3/2.0 | 1,540 (-5%) | 1mo | $175,000 | $114 | 85 |
| 611 E Highway 1 | 0.27mi | 3/2.0 | 1,494 (-8%) | 8mo | $180,000 | $120 | 68 |
| 303 S Portland | 0.53mi | 3/2.0 | 1,656 (+2%) | 10mo | $320,000 | $193 | 63 |
| 302 S County Line | 0.45mi | 3/2.0 | 1,484 (-8%) | 4mo | $150,000 | $101 | 62 |
| 406 S County Line | 0.52mi | 3/2.0 | 1,672 (+3%) | 11mo | $190,000 | $114 | 61 |
| 402 E Conway St | 0.22mi | 3/2.0 | 1,400 (-14%) | 12mo | $155,000 | $111 | 57 |
| 4723 N3715 | 0.73mi | 3/2.0 | 1,628 (+1%) | 15mo | $215,000 | $132 | 53 |
| 407 W Lexington St | 0.61mi | 3/2.0 | 1,780 (+10%) | 4mo | $285,000 | $160 | 51 |
| 1214 Vinson | 0.66mi | 3/2.0 | 1,384 (-14%) | 24mo | $50,000 | $36 | 25 |
Match score weights: distance 35% · size 25% · config 20% · recency 20%. Top-matched comps best support the ARV.
Projected returns pro-forma
4.55% appreciation · 3.0% rent growth · sell at horizon
- IRR
- 15.8%
- Equity multiple
- 1.98×
- Total profit
- $34,963
- Equity at exit
- $68,554
- IRR
- 16.5%
- Equity multiple
- 3.80×
- Total profit
- $99,547
- Equity at exit
- $115,582
Cash invested: $35,560 (down + closing). Projections, not guarantees.
Landlord ↔ Tenant lean methodology
- Overall (STATE)
- 83 Strongly Landlord-Friendly
- State Oklahoma
- 83 Strongly Landlord-Friendly · R+20
- County
- — inherits STATE
- City
- — inherits STATE
ZIP-level market 74825
- Home prices YoY
- 1.7%
- Active inventory
- 25
- Price-to-rent
- 8.8×
Monthly cashflow live
- Estimated rent
- $1,197 medium interval (Pro) →
- Mortgage (P&I)
- −$666
- Tax from tax record
- −$87 /mo · $1,039/yr
- Insurance
- −$53
- HOA
- −$0
- Vacancy / Maint / Mgmt
- −$251
- Net cashflow
- $140
Break-even live
UW: 25.0% down · 7.5% · 30yr · 1.5% tax · 5.0% vac · 8.0% maint · 8.0% mgmt
Financing live
Cash to close
- Down payment
- $31,750
- Closing costs
- $3,810
- Reserves months
- —
- Total cash needed
- —
Loan-product check · same deal, 3 products live
Conventional
25% down · 7.5% · 30yr
- Down + closing
- —
- Monthly P&I
- —
- Monthly cashflow
- —
- DSCR
- —
- Eligible?
- —
Personal DTI + credit; lowest rate.
DSCR
20% down · 8.5% · 30yr
- Down + closing
- —
- Monthly P&I
- —
- Monthly cashflow
- —
- DSCR
- —
- Eligible?
- —
No personal income docs; deal must DSCR.
Hard money
10% down · 12.0% · 12mo
- Down + closing
- —
- Monthly P&I
- —
- Monthly cashflow
- —
- DSCR
- —
- Eligible?
- —
Short-term bridge; refi at stabilization.
Listing history 25 events
-
2026-06-19days on market $127,000 Active 81 DOM
-
2026-06-18days on market $127,000 Active 80 DOM
-
2026-06-17days on market $127,000 Active 79 DOM
-
2026-06-16days on market $127,000 Active 78 DOM
-
2026-06-15days on market $127,000 Active 77 DOM
-
2026-06-14days on market $127,000 Active 75 DOM
-
2026-06-12days on market $127,000 Active 74 DOM
-
2026-06-09days on market $127,000 Active 71 DOM
-
2026-06-08days on market $127,000 Active 70 DOM
-
2026-06-07days on market $127,000 Active 69 DOM
-
2026-06-03days on market $127,000 Active 65 DOM
-
2026-06-02days on market $127,000 Active 64 DOM
-
2026-06-01days on market $127,000 Active 63 DOM
-
2026-05-31days on market $127,000 Active 62 DOM
-
2026-05-30days on market $127,000 Active 61 DOM
-
2026-05-24status Active
-
2026-05-13status Pending
-
2026-05-09price $127,000
-
2026-04-22price $142,000
-
2026-03-18$154,000 Active
-
2022-03-01soldstatus $89,500 Closed 248-char remark
Show marketing remark (248 chars)
(3)Ba, (1)Ba, nice size rooms, large kitchen with lots of cabinets & counter space, utility, cover porch, large yard, large carport, cellar (condition unknown) potential garden spot, shed & shop combo. , some mature trees on corner lot!
-
2022-03-01soldstatus $89,500
Show marketing remark (248 chars)
(3)Ba, (1)Ba, nice size rooms, large kitchen with lots of cabinets & counter space, utility, cover porch, large yard, large carport, cellar (condition unknown) potential garden spot, shed & shop combo. , some mature trees on corner lot!
-
2021-10-22status Pending 248-char remark
Show marketing remark (248 chars)
(3)Ba, (1)Ba, nice size rooms, large kitchen with lots of cabinets & counter space, utility, cover porch, large yard, large carport, cellar (condition unknown) potential garden spot, shed & shop combo. , some mature trees on corner lot!
-
2021-09-08$94,000 Active 248-char remark
Show marketing remark (248 chars)
(3)Ba, (1)Ba, nice size rooms, large kitchen with lots of cabinets & counter space, utility, cover porch, large yard, large carport, cellar (condition unknown) potential garden spot, shed & shop combo. , some mature trees on corner lot!
-
1986-11-18soldstatus $13,500
ⓘ Source: listings_history table (triggers on properties + properties_extension) + one-shot
backfill from property_details.listing_events for pre-trigger history.
Tax reassessment forecast OK · Resets to sale price
- Current annual tax
- $1,039 · $87/mo
- Projected year-2 tax
- $1,143 · $95/mo
- Expected delta
- +$104/yr (+$9/mo · 10.0%)
ⓘ Screening estimate from a state-policy table — verify with the county assessor before closing.
Climate risk First Street
- Flood 1/10 Low FEMA zone X (unshaded) · 0% chance over 30 yrs
- Wildfire 6/10 Major
- Heat 6/10 Major 7 d/yr ≥110°F today · 19 d/yr by 30 yrs out
- Wind 4/10 Moderate 11% chance of damaging wind over 30 yrs
- Air quality 2/10 Low 0 unhealthy d/yr today · 1 by 30 yrs out
Nearby sold comps map
Loading sold comps map…
Walkable amenities ~0.75 mi
Loading nearby amenities…
Taxation est. · year 1
- Rental income
- $14,365
- − Mortgage interest
- −$7,114
- − Property taxes
- −$1,039
- − Insurance
- −$635
- − Repairs & maintenance
- −$1,149
- − Management
- −$1,149
- − Depreciation
- −$3,695
- Taxable loss
- −$416
- Est. tax savings @ 24.0%
- +$100
- After-tax cash flow
- $1,782/yr
For passive investors: Depreciation is non-cash, so a rental often shows a tax loss while cash-flowing — sheltering income. Rental losses are passive: they offset passive income freely, and up to $25,000/yr can offset ordinary (W-2) income if you actively participate and your MAGI is under $100k (phasing out to $0 by $150k); unused losses carry forward. On sale, claimed depreciation is recaptured at up to 25%, and gains may owe capital-gains tax (a 1031 exchange can defer both). Figures are a year-1 estimate at your 24.0% rate — not tax advice; consult a CPA.
Schools (NCES district)
- District
- Allen
- NCES district ID
- 4002760
- Math proficiency
- 17% ▲ 1.00%
- Reading proficiency
- 15% ▼ -7.00%
- Median HH income
- $44,024
- Composite
- 14.04/100
- National rank
- #9471
- State rank
- #208 of 270 in OK
Livability — Allen
- Score
- 60/100
- State rank
- #339
- US rank
- #18704
Category grades
Schools grade is shown separately in the Schools card above.
Census & demographics
- Census place
- Allen, OK
- Population (ZIP)
- 1,763
Population outlook (Pontotoc County) Hauer SSP2
- Today (2025)
- 39,521 people
- By 2030
- 40,140 · +1.6%
- By 2040
- 41,242 · +4.4%
- By 2050
- 42,293 · +7.0%
- By 2075
- 44,678 · +13.0%
- By 2100
- 46,015 · +16.4%
Race, ethnicity, and origin ACS 2023
- Neighborhood character
- Predominantly White (73%)
- Race & ethnicity
- White 73% Native American 16% Two or more races 6% Hispanic / Latino 5%
- Common ancestry
- Slovak 2% Lithuanian 2% Scottish 2%
- Foreign-born
- 2% · Canada
- Languages at home
- 95% English-only · Spanish 2%
Political lean MEDSL · Pontotoc
- 2024 margin
- Solid R (+46.6) · D 25.7% · R 72.3% · Other 2.1%
- 2008→2024 swing
- -9.9pp toward R · 2008: -36.7pp · 2024: -46.6pp
- All cycles
- 2024: R+46.6 2020: R+43.7 2016: R+45.8 2012: R+38.8 2008: R+36.7
Not yet ingested
- Civics
- —
Market trends
- HPI YoY
- ▲ 4.55%
- Current HPI
- 270.3801
- Rent YoY
- —
- Metro
- —
- State GDP YoY
- ▲ 1.55%
- F500 in state
- 6
Industry mix (Fortune 500 HQ in OK)
| Industry | F500 HQs | Revenue |
|---|---|---|
| Energy | 3 | $48B |
|
||
Price history
+840.7% since first listed10 events — show timeline
- 2026-05-24 Relisted — MLS Technology, Inc.
- 2026-05-13 Pending — MLS Technology, Inc.
- 2026-05-09 Price Changed $127,000 MLS Technology, Inc.
- 2026-04-22 Price Changed $142,000 MLS Technology, Inc.
- 2026-03-18 Listed $154,000 MLS Technology, Inc.
- 2022-03-01 Sold (Public Records) $89,500 Public Records
- 2022-03-01 Sold (MLS) $89,500 MLS Technology, Inc.
- 2021-10-22 Pending — MLS Technology, Inc.
- 2021-09-08 Listed $94,000 MLS Technology, Inc.
- 1986-11-18 Sold (Public Records) $13,500 Public Records
Property tax history
+20.4%/yrLatest (2025): $1,039 · +0.5% YoY. Source: county tax records.
Cash-flow waterfall
monthlySold comps — $/sqft
last 12 mo · ≤1 miLoading sold comps…