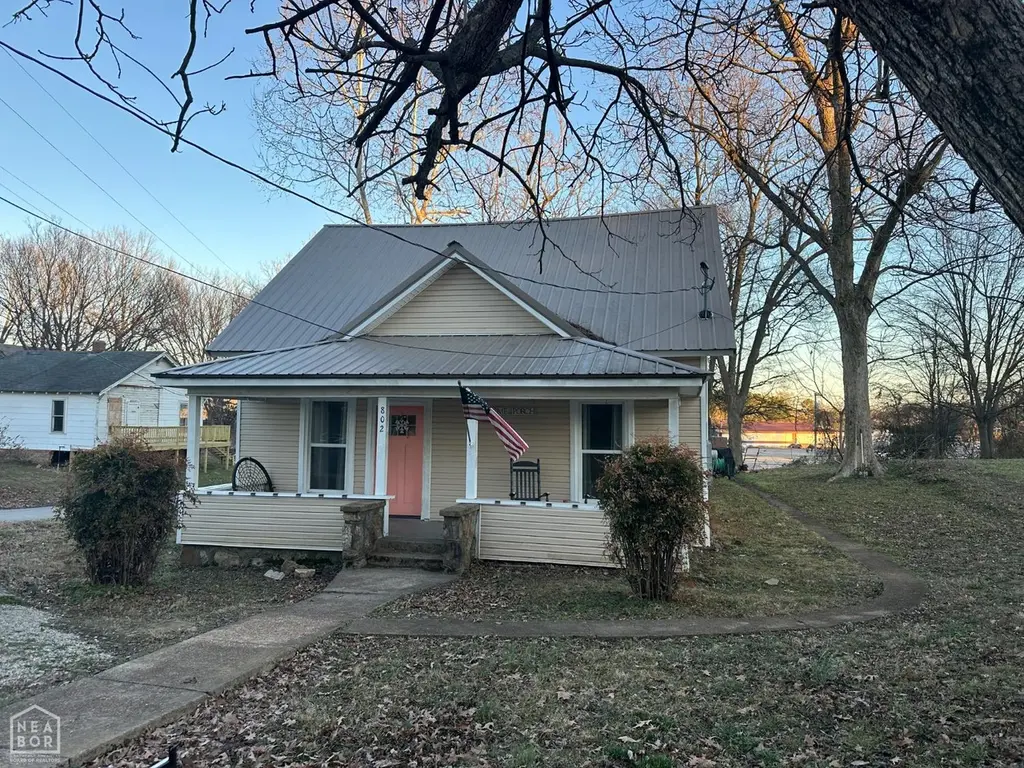
802 Cain St · Pocahontas, AR
Flood risk 1/10 · Minimal
- FEMA flood zone
- X (unshaded)
- Chance of flooding over 30 yrs
- 0.0%
- Est. flood insurance / yr
- $507 – $1,088
Fire risk 4/10 · Minor
- Est. fire insurance / yr
- $1,499 – $2,785
Heat risk 5/10 · Moderate
- Hot days now (above 109°F)
- 7 days/yr
- Hot days in 30 yrs
- 21 days/yr
Wind risk 3/10 · Minor
- Chance of severe wind over 30 yrs
- 5.0%
Air-quality risk 2/10 · Minimal
- Unhealthy air days now
- 1 days/yr
- Unhealthy air days in 30 yrs
- 1 days/yr
Risk factors via First Street. Map © Google.
Why this score? — see what drove the D grade
The composite is a weighted blend of 9 inputs, each scored 0–100. Each bar is that input's sub-score; the figure is the points it added to the 100-point composite (weight × sub-score).
- Cash flow +15.6/30.0
- ARV discount +9.5/15.0
- DSCR +4.8/10.0
- Livability +3.6/5.0
- 1% rule +3.3/10.0
- Rent growth +2.5/5.0
- Condition / age +2.5/5.0
- Schools +2.3/10.0
- Appreciation +0.0/10.0
$125,000
🖨 Deal sheet (PDF) 📄 Offer letter ✓ Due diligence
Listing remarks MLS
Beautiful 3-bedroom, 2-bath home featuring an upstairs level with elegant hardwood floors throughout. Situated on a desirable corner lot, this property offers extra space and added privacy. Enjoy the fully fenced yardperfect for pets, play, or entertainingand relax year-round in the screened porch. A wonderful combination of comfort, style, and outdoor living!
Key facts
- 1 acre lot
- Built 1940
- Listed 124 days
Neighborhood map
What this means for you Summary
Snapshot
- This is a 3-bed/1.0-bath single-family listed at $125k.
Deal economics
- At list price, monthly cash flow is $53 ($637/yr) — positive.
- The deal already cash-flows at list — no discount required.
- To meet the 1% rule (rent ≥ 1% of price), the offer needs to be $104k (17.1% below list).
- Recommended offer: $104k (17.1% below list) — sets the bar for 1% rule.
- Cap rate 6.8% vs local median 4.6% in Pocahontas — top-decile yield for the area; either an underpriced asset or a hidden risk that comps aren't pricing in. Stress-test before assuming the spread holds.
Location & tenants
- Location reads 71/100 on livability (#37 in AR) — a middle-class / working-renter tenant base. Strengths: cost of living A+, housing A+, health & safety A+; Watch: amenities D, employment D, schools D-.
- Pocahontas School District (rural): math 29% / reading 27% proficiency, ranked #165 of 238 in AR (top 69%) — low school quality limits family demand, transient renter base, plan for 1-2y turnover.
- Market conditions: 77 active listings in the ZIP; 4 comparable units currently listed for rent nearby; rentals lingering (median 45d on market — plan ~5-8 weeks vacancy on turnover, expect pricing pressure); 100% of comp listings sitting > 30 days — soft ceiling on asking rent; 6 units permitted in Randolph County in 2024 (5 in 5+ unit buildings).
Forward outlook
- Local home prices are declining (-3.0%/yr); year-one equity from $864 of loan paydown is wiped out by about $4k of value loss. Plan a longer hold.
- Randolph County population projected at -22% by 2050 — secular population decline; favor cash flow + early exit over multi-decade hold.
Negotiation context
- It's been on market 125 days — a 12% lower offer ($110k) is reasonable based on typical stale-listing flexibility.
- 4 sale attempts since 6y ago; this cycle's ask has dropped $28k (18%) from the opening price — seller is motivated, your offer sets the floor, not the list.
Risks & watch-outs
- Watch-outs: built in 1940 — expect roof / HVAC / electrical / plumbing capex.
- Climate carrying-cost: extreme-heat days projected 7→21/yr by 2055 (HVAC capex compounding) — expect insurance premiums to compound above CPI over the hold.
Questions for the listing agent
- It's been on market 125 days. Have you received any prior offers? Is the seller open to a 17% concession, seller financing, or rate buy-down credit?
- Built in 1940 — when were the roof, HVAC, electrical panel, plumbing, and water heater last replaced?
- Why hasn't it sold? Are there any deal-killer items the seller is aware of (foundation, flood, title, zoning, code violations)?
- Is there a deadline driving the sale (1031 exchange, divorce, estate, relocation)? That informs how much negotiation room exists.
- Schools are D-rated, which usually means shorter tenancies and higher turnover. Who's the typical renter profile here, and what's been the actual vacancy rate?
- Crime grade is F in this area — have there been break-ins, vandalism, or insurance claims at this property in the last 3 years? What carrier currently insures it and at what premium?
- The area grade is low — what's the realistic commute time and amenity access for the typical tenant pool here? Any planned neighborhood developments (good or bad) we should know about?
- What's the average days-on-market for RENTAL listings here right now (not sales)? A rising rental-DOM trend means longer vacancies and softer asking-rent achievability than the comps imply.
- What's the recent tenant-quality profile in this submarket — average credit score on applications, eviction rate, late-payment / NSF rate, and stable-employment percentage? A property-management company in the area should have these aggregated.
- How much new for-sale + rental construction is in the pipeline within 1–3 miles? Heavy new supply typically softens prices + rents 12–24 months out; constrained supply supports both.
Investment metrics
- 1% rule
- 0.83% ✗
- Cap rate
- 6.80%
- Cash-on-cash
- 1.82%
- DSCR
- 1.08
- GRM
- 10.0
CMA / ARV
- ARV (median comp)
- $130,698
- List price
- $125,000
- Delta
- -4.36%
- Verdict
- FAIR
- Comps
- 20 within 1.0 mi
Show comp detail 7 sales within ~0.75 mi
| Address | Dist | Beds/Ba | Sqft | Sold | Price | $/sf | Match |
|---|---|---|---|---|---|---|---|
| 1108 S Park St | 0.54mi | 2/1.0 (-1) | 1,204 (+2%) | 2mo | $48,000 | $40 | 66 |
| 302 Park St | 0.62mi | 2/1.0 (-1) | 1,272 (+7%) | 9mo | $115,000 | $90 | 46 |
| 1611 Birdell | 0.62mi | 3/2.0 | 1,344 (+14%) | 2mo | $130,000 | $97 | 43 |
| 915 W Pyburn | 0.51mi | 2/1.0 (-1) | 1,008 (-15%) | 7mo | $44,000 | $44 | 40 |
| 1606 W Pyburn St | 0.72mi | 3/1.0 | 1,040 (-12%) | 7mo | $55,000 | $53 | 40 |
| 1905 Warren St | 0.52mi | 3/2.0 | 1,320 (+12%) | 20mo | $126,900 | $96 | 36 |
| 2229 Highway 62 W | 0.69mi | 3/1.0 | 1,015 (-14%) | 14mo | $105,000 | $103 | 32 |
Match score weights: distance 35% · size 25% · config 20% · recency 20%. Top-matched comps best support the ARV.
Projected returns pro-forma
-3.0% appreciation · 3.0% rent growth · sell at horizon
- IRR
- -13.4%
- Equity multiple
- 0.52×
- Total profit
- $-16,917
- Equity at exit
- $18,638
- IRR
- -4.6%
- Equity multiple
- 0.70×
- Total profit
- $-10,555
- Equity at exit
- $10,808
Cash invested: $35,000 (down + closing). Projections, not guarantees.
Landlord ↔ Tenant lean methodology
- Overall (STATE)
- 92 Strongly Landlord-Friendly
- State Arkansas
- 92 Strongly Landlord-Friendly · R+14
- County
- — inherits STATE
- City
- — inherits STATE
ZIP-level market 72455
- Home prices YoY
- -15.8%
- Active inventory
- 77
- Price-to-rent
- 10.0×
Monthly cashflow live
- Estimated rent
- $1,037 medium interval (Pro) →
- Mortgage (P&I)
- −$656
- Tax from tax record
- −$58 /mo · $700/yr
- Insurance
- −$52
- HOA
- −$0
- Vacancy / Maint / Mgmt
- −$218
- Net cashflow
- $53
Break-even live
Sensitivity live
| Price | -10% $124 | -5% $88 | +0% $53 | +5% $18 | +10% $-18 |
|---|---|---|---|---|---|
| Rent | -10% $-29 | -5% $12 | +0% $53 | +5% $94 | +10% $135 |
| Rate | -1.0pp $116 | -0.5pp $85 | base $53 | +0.5pp $21 | +1.0pp $-12 |
UW: 25.0% down · 7.5% · 30yr · 1.5% tax · 5.0% vac · 8.0% maint · 8.0% mgmt
Financing live
Cash to close
- Down payment
- $31,250
- Closing costs
- $3,750
- Reserves months
- —
- Total cash needed
- —
Loan-product check · same deal, 3 products live
Conventional
25% down · 7.5% · 30yr
- Down + closing
- —
- Monthly P&I
- —
- Monthly cashflow
- —
- DSCR
- —
- Eligible?
- —
Personal DTI + credit; lowest rate.
DSCR
20% down · 8.5% · 30yr
- Down + closing
- —
- Monthly P&I
- —
- Monthly cashflow
- —
- DSCR
- —
- Eligible?
- —
No personal income docs; deal must DSCR.
Hard money
10% down · 12.0% · 12mo
- Down + closing
- —
- Monthly P&I
- —
- Monthly cashflow
- —
- DSCR
- —
- Eligible?
- —
Short-term bridge; refi at stabilization.
Rent comps 4 comps
| Address | Beds | Baths | Sqft | Rent | $/sqft | DOM | Units | Dist |
|---|---|---|---|---|---|---|---|---|
| 915 W Pyburn St Pocahontas, AR | 2.0 | 1.0 | 1008 | $875 | $0.87 | 44d | 1 | 0.53mi |
| 2503 Ridgeland Cir Pocahontas, AR | 2.0 | 2.5 | 1486 | $995 | $0.67 | 45d | 1 | 1.16mi |
| 2503 Ridgeland Cir Unit 4 Pocahontas, AR | 2.0 | 2.5 | 1486 | $995 | $0.67 | 44d | 1 | 1.16mi |
| 2506 Ridgeland Cir Apt 2 Pocahontas, AR | 2.0 | 2.5 | 1438 | $1,495 | $1.04 | 44d | 1 | 1.19mi |
Listing history 31 events
-
2026-06-19days on market $125,000 Active 125 DOM
-
2026-06-18days on market $125,000 Active 124 DOM
-
2026-06-17days on market $125,000 Active 123 DOM
-
2026-06-16days on market $125,000 Active 122 DOM
-
2026-06-15days on market $125,000 Active 121 DOM
-
2026-06-14days on market $125,000 Active 119 DOM
-
2026-06-12days on market $125,000 Active 118 DOM
-
2026-06-09days on market $125,000 Active 115 DOM
-
2026-06-08days on market $125,000 Active 114 DOM
-
2026-06-07days on market $125,000 Active 113 DOM
-
2026-06-07days on market $125,000 Active 112 DOM
-
2026-06-04days on market $125,000 Active 109 DOM
-
2026-06-02days on market $125,000 Active 108 DOM
-
2026-06-01days on market $125,000 Active 107 DOM
-
2026-05-31days on market $125,000 Active 106 DOM
-
2026-05-31days on market $125,000 Active 105 DOM
-
2026-02-16price $125,000 362-char remark
Show marketing remark (362 chars)
Beautiful 3-bedroom, 2-bath home featuring an upstairs level with elegant hardwood floors throughout. Situated on a desirable corner lot, this property offers extra space and added privacy. Enjoy the fully fenced yardperfect for pets, play, or entertainingand relax year-round in the screened porch. A wonderful combination of comfort, style, and outdoor living!
-
2026-02-14$153,000 Active 362-char remark
Show marketing remark (362 chars)
Beautiful 3-bedroom, 2-bath home featuring an upstairs level with elegant hardwood floors throughout. Situated on a desirable corner lot, this property offers extra space and added privacy. Enjoy the fully fenced yardperfect for pets, play, or entertainingand relax year-round in the screened porch. A wonderful combination of comfort, style, and outdoor living!
-
2025-06-30soldstatus $139,000
-
2025-06-25soldstatus $139,000
-
2025-06-25soldstatus $139,000
-
2025-06-18soldstatus $139,000
-
2025-01-01$139,000
-
2022-05-31soldstatus $110,000
-
2022-05-13soldstatus $110,000
-
2022-03-25$109,900
-
2021-02-22soldstatus
-
2020-11-24$90,000
-
2014-01-31soldstatus $57,000
-
2012-07-18soldstatus $45,000
-
2008-04-07soldstatus $30,000
ⓘ Source: listings_history table (triggers on properties + properties_extension) + one-shot
backfill from property_details.listing_events for pre-trigger history.
Tax reassessment forecast AR · Resets to sale price
- Current annual tax
- $700 · $58/mo
- Projected year-2 tax
- $800 · $67/mo
- Expected delta
- +$100/yr (+$8/mo · 14.3%)
ⓘ Screening estimate from a state-policy table — verify with the county assessor before closing.
Climate risk First Street
- Flood 1/10 Low FEMA zone X (unshaded) · 0% chance over 30 yrs
- Wildfire 4/10 Moderate
- Heat 5/10 Major 7 d/yr ≥109°F today · 21 d/yr by 30 yrs out
- Wind 3/10 Moderate 5% chance of damaging wind over 30 yrs
- Air quality 2/10 Low 1 unhealthy d/yr today · 1 by 30 yrs out
Nearby sold comps map
Loading sold comps map…
Walkable amenities ~0.75 mi
Loading nearby amenities…
Taxation est. · year 1
- Rental income
- $12,441
- − Mortgage interest
- −$7,002
- − Property taxes
- −$700
- − Insurance
- −$625
- − Repairs & maintenance
- −$995
- − Management
- −$995
- − Depreciation
- −$3,636
- Taxable loss
- −$1,513
- Est. tax savings @ 24.0%
- +$363
- After-tax cash flow
- $1,000/yr
For passive investors: Depreciation is non-cash, so a rental often shows a tax loss while cash-flowing — sheltering income. Rental losses are passive: they offset passive income freely, and up to $25,000/yr can offset ordinary (W-2) income if you actively participate and your MAGI is under $100k (phasing out to $0 by $150k); unused losses carry forward. On sale, claimed depreciation is recaptured at up to 25%, and gains may owe capital-gains tax (a 1031 exchange can defer both). Figures are a year-1 estimate at your 24.0% rate — not tax advice; consult a CPA.
Schools (NCES district)
- District
- Pocahontas School District
- NCES district ID
- 0511610
- Math proficiency
- 29% ▼ -15.00%
- Reading proficiency
- 27% ▼ -12.00%
- Median HH income
- $37,399
- Composite
- 23.36/100
- National rank
- #7907
- State rank
- #165 of 238 in AR
Livability — Pocahontas
- Score
- 71/100
- State rank
- #37
- US rank
- #6525
Category grades
Schools grade is shown separately in the Schools card above.
Census & demographics
- Census place
- Pocahontas, AR
- Population (ZIP)
- 13,572
Population outlook (Randolph County) Hauer SSP2
- Today (2025)
- 16,421 people
- By 2030
- 15,733 · -4.2%
- By 2040
- 14,296 · -12.9%
- By 2050
- 12,884 · -21.5%
- By 2075
- 9,535 · -41.9%
- By 2100
- 6,520 · -60.3%
Race, ethnicity, and origin ACS 2023
- Neighborhood character
- Predominantly White (88%)
- Race & ethnicity
- White 88% Two or more races 6% Pacific Islander 3% Hispanic / Latino 2% Black 2%
- Common ancestry
- Slovak 5% Lithuanian 1% Serbian 1%
- Foreign-born
- 4%
- Languages at home
- 96% English-only · Other Asian/Pacific 3% Spanish 1%
Political lean MEDSL · Randolph
- 2024 margin
- Solid R (+63.7) · D 17.1% · R 80.9% · Other 2.0%
- 2008→2024 swing
- -45.6pp toward R · 2008: -18.1pp · 2024: -63.7pp
- All cycles
- 2024: R+63.7 2020: R+60.8 2016: R+48.8 2012: R+27.9 2008: R+18.1
Not yet ingested
- Civics
- —
Market trends
- HPI YoY
- ▼ -33.61%
- Current HPI
- 179.3505
- Rent YoY
- —
- Metro
- —
- State GDP YoY
- ▲ 3.80%
- F500 in state
- 10
Industry mix (Fortune 500 HQ in AR)
| Industry | F500 HQs | Revenue |
|---|---|---|
| Retail | 1 | $681B |
|
||
| Food / Agriculture | 1 | $53B |
|
||
| Retail / Energy | 1 | $22B |
|
||
| Transportation / Logistics | 1 | $12B |
|
||
| Energy | 1 | $4B |
|
||
Price history
+316.7% since first listed15 events — show timeline
- 2026-02-16 Price Changed $125,000 NEABOR MLS
- 2026-02-14 Listed $153,000 NEABOR MLS
- 2025-06-30 Sold (Public Records) $139,000 Public Records
- 2025-06-25 Sold (Public Records) $139,000 Public Records
- 2025-06-25 Sold (Public Records) $139,000 Public Records
- 2025-06-18 Sold (MLS) $139,000 NEABOR MLS
- 2025-01-01 Listed $139,000 NEABOR MLS
- 2022-05-31 Sold (Public Records) $110,000 Public Records
- 2022-05-13 Sold (MLS) $110,000 NEABOR MLS
- 2022-03-25 Listed $109,900 NEABOR MLS
- 2021-02-22 Sold (MLS) — CARMLS
- 2020-11-24 Listed $90,000 CARMLS
- 2014-01-31 Sold (Public Records) $57,000 Public Records
- 2012-07-18 Sold (Public Records) $45,000 Public Records
- 2008-04-07 Sold (Public Records) $30,000 Public Records
Property tax history
+63.2%/yrLatest (2025): $700 · +0.0% YoY. Source: county tax records.
Cash-flow waterfall
monthlySold comps — $/sqft
last 12 mo · ≤1 miLoading sold comps…