23701 S Western Ave #56 · Torrance, CA
Flood risk 1/10 · Minimal
- FEMA flood zone
- X (unshaded)
- Chance of flooding over 30 yrs
- 0.0%
- Est. flood insurance / yr
- $507 – $1,088
Fire risk 1/10 · Minimal
- Est. fire insurance / yr
- $659 – $1,223
Heat risk 3/10 · Minor
- Hot days now (above 86°F)
- 7 days/yr
- Hot days in 30 yrs
- 22 days/yr
Wind risk 1/10 · Minimal
- Chance of severe wind over 30 yrs
- —
Air-quality risk 5/10 · Moderate
- Unhealthy air days now
- 7 days/yr
- Unhealthy air days in 30 yrs
- 7 days/yr
Risk factors via First Street. Map © Google.
Why this score? — see what drove the B- grade
The composite is a weighted blend of 9 inputs, each scored 0–100. Each bar is that input's sub-score; the figure is the points it added to the 100-point composite (weight × sub-score).
- Cash flow +30.0/30.0
- 1% rule +10.0/10.0
- DSCR +10.0/10.0
- Schools +5.9/10.0
- Livability +3.8/5.0
- Condition / age +3.8/5.0
- Rent growth +3.3/5.0
- ARV discount +0.0/15.0
- Appreciation +0.0/10.0
$155,000
🖨 Deal sheet (PDF) 📄 Offer letter ✓ Due diligence
Listing remarks
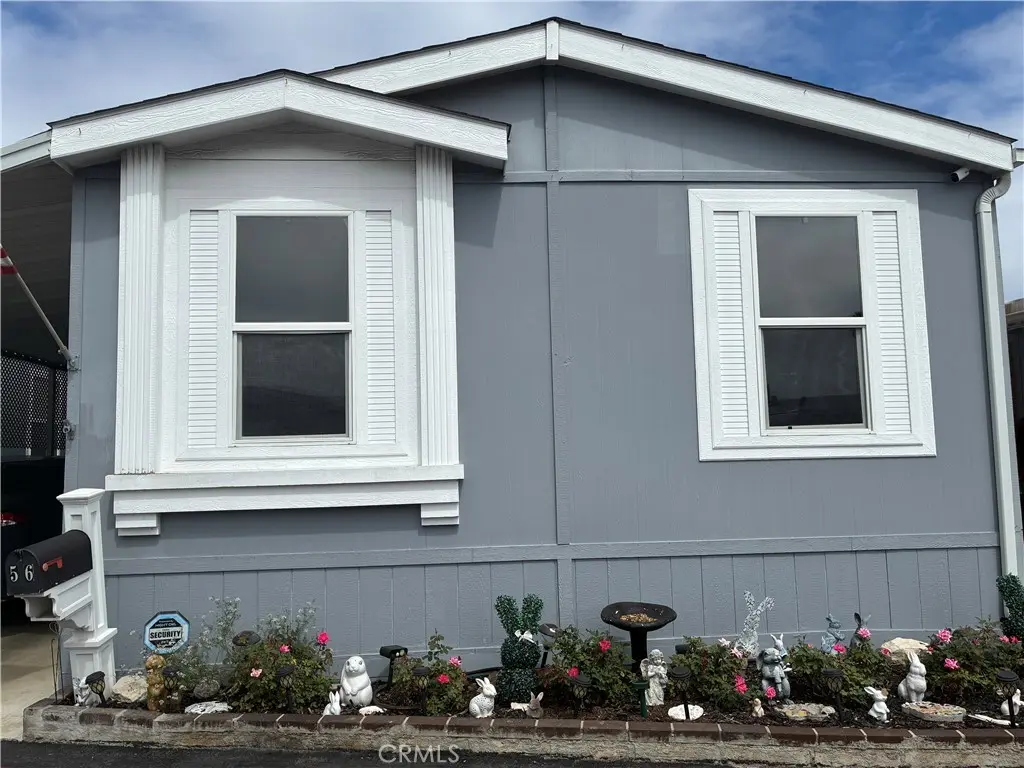
Located in Torrance School District - Welcome to the Knolls Lodge, an All Age Community. This 2007 model is well cared for, super clean, and maintained. Offers a functional, open and comfortable floorplan. The Primary bedroom and a full bath are located at one end of the unit, separated by a large living space, and the other 2 bedrooms and full bath on the opposite end. Many windows with plantation shutters. Additional features include new A/C unit, inside Laundry area, private covered carport driveway for 2-3 cars. Conveniently located near major streets for easy access to shops, schools, restaurants, entertainment, freeway, etc. Community provides 2 swimming pools, club house and security
Key facts
- New a/c unit
- Inside laundry area
- Open floorplan
Tags
Property features AI
Finance
- Other: Located in Knolls Lodge park; Manager approval required for residency; Pets allowed with number limits; Includes 1 shed; Mobile dimensions approximately 18 ft by 96 ft
- Financial info: Land lease in effect ($1,850 per month, current)
- HOA & community: Part of an association; Onsite property management; Pool access; Pet rules (call for rules)
Exterior
- Parking: Carport (2 spaces)
- Utilities: Public sewer; District/public water; Natural gas connected; Electricity connected
- Home design: Single-story mobile home (Golden Pacific model); Entry level 1
- Construction: Mobile home remains on site; One story
- Exterior features: Community pool; Close to clubhouse; Curbs
Interior
- Kitchen: Gas range; Gas oven; Dishwasher
- Bedrooms: Primary bedroom
- Flooring: Carpet; Laminate
- Bathrooms: 2 full bathrooms; Shower in tub
- Heating & cooling: Central furnace heating; Central air conditioning
- Interior features: Quartz counters; Copper partial plumbing; Open floor plan; Single-level home; Entry located on the left side of the unit
- Laundry & utility: Indoor laundry room; Gas dryer hookup; Individual laundry room
Neighborhood map
What this means for you Summary
Snapshot
- This is a 3-bed/2.0-bath manufactured listed at $155k. Condition is rated good.
Deal economics
- At list price, monthly cash flow is $2k ($18k/yr) — positive.
- The deal already cash-flows at list — no discount required.
- Meets the 1% rule at list price ($3k rent vs $155k).
- Recommended offer: $150k (3.0% below list) — sets the bar for market timing.
- Cap rate 18.2% vs local median 2.1% in Torrance — top-decile yield for the area; either an underpriced asset or a hidden risk that comps aren't pricing in. Stress-test before assuming the spread holds.
Location & tenants
- Location reads 76/100 on livability (#95 in CA, #3,501 nationally) — a middle-class / working-renter tenant base. Strengths: amenities A+, commute A+, employment A+; Watch: health & safety C-, crime D+, cost of living F.
- Torrance Unified (urban): math 62% / reading 67% proficiency, ranked #150 of 1,400 in CA (top 11%) — acceptable for families but not a draw, mixed tenant base, ~2y average lease; only 20% free/reduced lunch — higher-income household profile.
- Zoned schools: John Adams Elementary (357 students, 31% FRL); J. H. Hull Middle (622 students, 44% FRL); Torrance High (1,999 students, 30% FRL) — zoned schools average 35% FRL vs 20% district-wide (15 pts higher); higher-poverty schools than district average — tighter screening recommended.
- Market conditions: Rents rising (+3.2%/yr); 96 active listings in the ZIP; 40 comparable units currently listed for rent nearby; rentals at typical pace (median 27d on market — plan ~3-4 weeks tenant-placement turnaround); 48% of comp listings sitting > 30 days — soft ceiling on asking rent; solid renter incomes; 19,697 units permitted in Los Angeles County in 2024 (9,426 in 5+ unit buildings).
- This rent runs 40% of the median local income ($93k/yr) — at the standard rent-burdened threshold; future hikes will face affordability resistance.
Forward outlook
- Local home prices are declining (-3.0%/yr); year-one equity from $1k of loan paydown is wiped out by about $5k of value loss. Plan a longer hold.
- Los Angeles County population projected at +9% by 2050 — modest demand growth; plan on rents tracking national, not racing it.
- At projected returns (-3.0% appreciation + 3.2% rent growth), your $43k cash investment doubles in ~3 years — after that, you're playing with house money.
Negotiation context
- It's been on market 60 days — a 3% lower offer ($150k) is reasonable based on typical stale-listing flexibility.
Questions for the listing agent
- It's been on market 60 days. Have you received any prior offers? Is the seller open to a 3% concession, seller financing, or rate buy-down credit?
- Is there a deadline driving the sale (1031 exchange, divorce, estate, relocation)? That informs how much negotiation room exists.
- Schools are A-rated — typically a magnet for longer-tenancy family renters. What's the average tenant stay here, and is there a school-zone premium baked into asking?
- Crime grade is D in this area — have there been break-ins, vandalism, or insurance claims at this property in the last 3 years? What carrier currently insures it and at what premium?
- What's the average days-on-market for RENTAL listings here right now (not sales)? A rising rental-DOM trend means longer vacancies and softer asking-rent achievability than the comps imply.
- What's the recent tenant-quality profile in this submarket — average credit score on applications, eviction rate, late-payment / NSF rate, and stable-employment percentage? A property-management company in the area should have these aggregated.
- How much new for-sale + rental construction is in the pipeline within 1–3 miles? Heavy new supply typically softens prices + rents 12–24 months out; constrained supply supports both.
Investment metrics
- 1% rule
- 2.01% ✓
- Cap rate
- 18.17%
- Cash-on-cash
- 42.43%
- DSCR
- 2.89
- GRM
- 4.1
CMA / ARV
- ARV (median comp)
- $113,457
- List price
- $155,000
- Delta
- 36.62%
- Verdict
- OVERPRICED
- Comps
- 13 within 1.0 mi
Show comp detail 12 sales within ~0.75 mi
| Address | Dist | Beds/Ba | Sqft | Sold | Price | $/sf | Match |
|---|---|---|---|---|---|---|---|
| 23701 Western #258 | 0.00mi | 3/1.0 | 960 (0%) | 11mo | $73,000 | $76 | 87 |
| 23701 S Western #247 | 0.00mi | 2/1.0 (-1) | 950 (-1%) | 6mo | $39,000 | $41 | 84 |
| 23701 S Western Ave #259 | 0.01mi | 2/1.0 (-1) | 900 (-6%) | 2mo | $42,500 | $47 | 79 |
| 23701 S Western Ave #213 | 0.00mi | 3/2.0 | 1,009 (+5%) | 15mo | $149,600 | $148 | 79 |
| 23701 S Western Ave #200 | 0.00mi | 2/2.0 (-1) | 936 (-2%) | 15mo | $130,000 | $139 | 78 |
| 23701 S Western Ave #7 | 0.08mi | 3/2.0 | 1,040 (+8%) | 11mo | $144,000 | $138 | 73 |
| 23701 S Western Ave #130 | 0.01mi | 2/2.0 (-1) | 846 (-12%) | 4mo | $184,201 | $218 | 72 |
| 23701 S Western Ave #231 | 0.00mi | 3/2.0 | 1,080 (+12%) | 10mo | $95,000 | $88 | 71 |
| 23701 S Western Ave #202 | 0.00mi | 2/2.0 (-1) | 1,037 (+8%) | 13mo | $180,900 | $174 | 71 |
| 23701 S Western Ave #45 | 0.00mi | 2/2.0 (-1) | 840 (-12%) | 7mo | $69,900 | $83 | 69 |
| 24200 Walnut #62 | 0.23mi | 3/2.0 | 1,040 (+8%) | 14mo | $80,000 | $77 | 64 |
| 2103 245th St #7 | 0.62mi | 2/2.0 (-1) | 852 (-11%) | 1mo | $225,000 | $264 | 47 |
Match score weights: distance 35% · size 25% · config 20% · recency 20%. Top-matched comps best support the ARV.
Projected returns pro-forma
-3.0% appreciation · 3.25% rent growth · sell at horizon
- IRR
- 39.4%
- Equity multiple
- 2.69×
- Total profit
- $73,360
- Equity at exit
- $23,111
- IRR
- 45.9%
- Equity multiple
- 5.44×
- Total profit
- $192,814
- Equity at exit
- $13,402
Cash invested: $43,400 (down + closing). Projections, not guarantees.
Landlord ↔ Tenant lean methodology
- Overall (STATE)
- 18 Strongly Tenant-Friendly
- State California
- 18 Strongly Tenant-Friendly · D+13
- County
- — inherits STATE
- City
- — inherits STATE
ZIP-level market 90501
- Rents YoY
- 3.2%
- Active inventory
- 96
- Price-to-rent
- 4.1×
Monthly cashflow live
- Estimated rent
- $3,123 high interval (Pro) →
- Mortgage (P&I)
- −$813
- Tax from tax record
- −$55 /mo · $663/yr
- Insurance
- −$65
- HOA
- −$0
- Vacancy / Maint / Mgmt
- −$656
- Net cashflow
- $1,534
Break-even live
Sensitivity live
| Price | -10% $1,622 | -5% $1,578 | +0% $1,534 | +5% $1,491 | +10% $1,447 |
|---|---|---|---|---|---|
| Rent | -10% $1,288 | -5% $1,411 | +0% $1,534 | +5% $1,658 | +10% $1,781 |
| Rate | -1.0pp $1,612 | -0.5pp $1,574 | base $1,534 | +0.5pp $1,494 | +1.0pp $1,453 |
UW: 25.0% down · 7.5% · 30yr · 1.5% tax · 5.0% vac · 8.0% maint · 8.0% mgmt
Financing live
Cash to close
- Down payment
- $38,750
- Closing costs
- $4,650
- Reserves months
- —
- Total cash needed
- —
Loan-product check · same deal, 3 products live
Conventional
25% down · 7.5% · 30yr
- Down + closing
- —
- Monthly P&I
- —
- Monthly cashflow
- —
- DSCR
- —
- Eligible?
- —
Personal DTI + credit; lowest rate.
DSCR
20% down · 8.5% · 30yr
- Down + closing
- —
- Monthly P&I
- —
- Monthly cashflow
- —
- DSCR
- —
- Eligible?
- —
No personal income docs; deal must DSCR.
Hard money
10% down · 12.0% · 12mo
- Down + closing
- —
- Monthly P&I
- —
- Monthly cashflow
- —
- DSCR
- —
- Eligible?
- —
Short-term bridge; refi at stabilization.
Rent comps 40 comps
| Address | Beds | Baths | Sqft | Rent | $/sqft | DOM | Units | Dist |
|---|---|---|---|---|---|---|---|---|
| 2124 W 238th St Unit A Torrance, CA | 2.0 | 2.0 | 750 | $3,600 | $4.80 | 18d | 1 | 0.48mi |
| 2128 W 238th St Unit A Torrance, CA | 2.0 | 2.0 | 750 | $3,500 | $4.67 | 45d | 1 | 0.48mi |
| 2174 1st St Unit 237th St unit Torrance, CA | 2.0 | 1.0 | 800 | $2,500 | $3.12 | 26d | 1 | 0.56mi |
| 1802 247th St Unit 1802 Lomita, CA | 2.0 | 1.0 | 800 | $3,200 | $4.00 | 45d | 1 | 0.64mi |
| 24636 Eshelman Ave Lomita, CA | 2.0 | 1.0 | 950 | $2,950 | $3.11 | 6d | 1 | 0.66mi |
| 24638 Eshelman Ave Unit 1/4 Lomita, CA | 2.0 | 1.0 | 950 | $2,950 | $3.11 | 45d | 1 | 0.66mi |
| 1311 Sepulveda Blvd Torrance, CA | 2.0–3.0 | 2.0 | 1201 | $4,400 | $3.66 | 1d | 1 | 0.67mi |
| 1567 W 228th St Torrance, CA | 2.0 | 2.0 | 990 | $3,200 | $3.23 | 45d | 1 | 0.68mi |
| 1657 W 227th St Apt 1 Torrance, CA | 2.0 | 1.0 | 575 | $2,150 | $3.74 | 45d | 1 | 0.73mi |
| 1612 226th St Unit B Torrance, CA | 2.0 | 1.0 | 850 | $2,650 | $3.12 | 45d | 1 | 0.78mi |
| 2757 Andreo Ave Torrance, CA | 2.0 | 2.0 | 1100 | $3,295 | $3.00 | 45d | 1 | 0.81mi |
| 2757 Andreo Ave Unit 6 Torrance, CA | 2.0 | 2.0 | 1100 | $2,933 | $2.67 | 5d | 1 | 0.81mi |
| 2757 Andreo Ave Unit 3 Torrance, CA | 2.0 | 2.0 | 1100 | $2,933 | $2.67 | 13d | 1 | 0.81mi |
| 2757 Andreo Ave Unit 3 Torrance, CA | 2.0 | 1.5 | 1100 | $2,933 | $2.67 | 5d | 1 | 0.81mi |
| 2757 Andreo Ave Unit 5 Torrance, CA | 2.0 | 2.0 | 1100 | $2,933 | $2.67 | 24d | 1 | 0.81mi |
| 2757 Andreo Ave Unit 5 Torrance, CA | 2.0 | 1.5 | 1100 | $2,993 | $2.72 | 13d | 1 | 0.81mi |
| 1318 W 227th St Torrance, CA | 2.0 | 1.0 | 640 | $2,250 | $3.52 | 3d | 1 | 0.88mi |
| 1318 W 227th St Torrance, CA | 2.0 | 1.0 | 640 | $2,250 | $3.52 | 45d | 1 | 0.88mi |
| 1533 Plaza del Amo Unit 4 Torrance, CA | 2.0 | 1.0 | 978 | $2,550 | $2.61 | 0d | 1 | 0.88mi |
| 25110 Eshelman Ave Lomita, CA | 2.0 | 1.5 | 800 | $2,245 | $2.81 | 12d | 1 | 0.95mi |
| 24836 Narbonne Ave Lomita, CA | 2.0 | 1.0 | 740 | $2,995 | $4.05 | 45d | 1 | 0.96mi |
| 1332 W 225th St Unit 1 Torrance, CA | 2.0 | 1.0 | 900 | $2,095 | $2.33 | 45d | 1 | 0.98mi |
| 2758 Orange Ave Unit 10 Torrance, CA | 2.0 | 1.5 | 950 | $2,800 | $2.95 | 14d | 1 | 0.99mi |
| 2457 Lomita Blvd Lomita, CA | 2.0 | 1.0–2.0 | 878 | $5,036 | $5.74 | 0d | 14 | 1.02mi |
| 2308 Cabrillo Ave Apt 8 Torrance, CA | 2.0 | 2.0 | 950 | $2,200 | $2.32 | 9d | 1 | 1.06mi |
| 24410 Crenshaw Blvd Torrance, CA | 2.0 | 2.0 | 1010 | $2,795 | $2.77 | 6d | 1 | 1.10mi |
| 2525 W 235th St Unit 10656A Torrance, CA | 2.0 | 1.5 | 1073 | $4,210 | $3.92 | 45d | 1 | 1.11mi |
| 2545 W 235th St Torrance, CA | 2.0 | 1.0–1.5 | 984 | $3,325 | $3.38 | 5d | 5 | 1.15mi |
| 1611 W 221st St Torrance, CA | 2.0 | 1.5 | 650 | $2,600 | $4.00 | 45d | 1 | 1.19mi |
| 806 Coriander Dr Unit H Torrance, CA | 2.0 | 2.0 | 829 | $2,500 | $3.02 | 26d | 1 | 1.22mi |
| 1800 255th St Unit 1812-A Lomita, CA | 2.0 | 1.0 | 750 | $2,145 | $2.86 | 45d | 1 | 1.23mi |
| 2585 W 235th St Unit 10599A Torrance, CA | 2.0 | 1.0 | 896 | $3,880 | $4.33 | 45d | 1 | 1.24mi |
| 817 W 232nd St Unit G Torrance, CA | 2.0 | 1.5 | 900 | $3,250 | $3.61 | 20d | 1 | 1.24mi |
| 1648 255th St W Harbor City, CA | 2.0 | 2.0 | 800 | $3,400 | $4.25 | 45d | 1 | 1.24mi |
| 23318 Sesame St Unit H Torrance, CA | 2.0 | 2.0 | 852 | $2,595 | $3.05 | 24d | 1 | 1.27mi |
| 1903 Cabrillo Ave Unit C Torrance, CA | 2.0 | 1.0 | 700 | $2,700 | $3.86 | 45d | 1 | 1.31mi |
| 2635 W 235th St Unit 8890A Torrance, CA | 2.0 | 1.5 | 1073 | $4,120 | $3.84 | 45d | 1 | 1.31mi |
| 2639 W 235th St Unit 11270A Torrance, CA | 2.0 | 2.0 | 1073 | $4,260 | $3.97 | 45d | 1 | 1.33mi |
| 1340 255th St W Apt 1 Harbor City, CA | 2.0 | 2.0 | 932 | $2,595 | $2.78 | 1d | 1 | 1.34mi |
| 2655 W 235th St Unit 11106A Torrance, CA | 2.0 | 1.0 | 997 | $4,170 | $4.18 | 45d | 1 | 1.36mi |
Listing history 18 events
-
2026-06-21pricedays on market $155,000 Active 60 DOM
-
2026-06-18days on market $160,000 Active 57 DOM
-
2026-06-17days on market $160,000 Active 56 DOM
-
2026-06-16days on market $160,000 Active 55 DOM
-
2026-06-15days on market $160,000 Active 54 DOM
-
2026-06-13days on market $160,000 Active 52 DOM
-
2026-06-13days on market $160,000 Active 51 DOM
-
2026-06-09days on market $160,000 Active 48 DOM
-
2026-06-08remarks 699-char remark
-
2026-06-08pricedays on market $160,000 Active 47 DOM
-
2026-06-07days on market $165,000 Active 46 DOM
-
2026-06-04days on market $165,000 Active 43 DOM
-
2026-06-03days on market $165,000 Active 42 DOM
-
2026-06-02days on market $165,000 Active 41 DOM
-
2026-06-01days on market $165,000 Active 40 DOM
-
2026-05-31days on market $165,000 Active 39 DOM
-
2026-05-15price $165,000 678-char remark
-
2026-04-22$170,000 Active 678-char remark
ⓘ Source: listings_history table (triggers on properties + properties_extension) + one-shot
backfill from property_details.listing_events for pre-trigger history.
Tax reassessment forecast CA · Resets to sale price
- Current annual tax
- $663 · $55/mo
- Projected year-2 tax
- $1,178 · $98/mo
- Expected delta
- +$515/yr (+$43/mo · 77.7%)
ⓘ Screening estimate from a state-policy table — verify with the county assessor before closing.
Climate risk First Street
- Flood 1/10 Low FEMA zone X (unshaded) · 0% chance over 30 yrs
- Wildfire 1/10 Low
- Heat 3/10 Moderate 7 d/yr ≥86°F today · 22 d/yr by 30 yrs out
- Wind 1/10 Low
- Air quality 5/10 Major 7 unhealthy d/yr today · 7 by 30 yrs out
Nearby sold comps map
Loading sold comps map…
Walkable amenities ~0.75 mi
Loading nearby amenities…
Taxation est. · year 1
- Rental income
- $37,475
- − Mortgage interest
- −$8,682
- − Property taxes
- −$663
- − Insurance
- −$775
- − Repairs & maintenance
- −$2,998
- − Management
- −$2,998
- − Depreciation
- −$4,509
- Taxable income
- $16,849
- Est. tax owed @ 24.0%
- −$4,044
- After-tax cash flow
- $14,369/yr
For passive investors: Depreciation is non-cash, so a rental often shows a tax loss while cash-flowing — sheltering income. Rental losses are passive: they offset passive income freely, and up to $25,000/yr can offset ordinary (W-2) income if you actively participate and your MAGI is under $100k (phasing out to $0 by $150k); unused losses carry forward. On sale, claimed depreciation is recaptured at up to 25%, and gains may owe capital-gains tax (a 1031 exchange can defer both). Figures are a year-1 estimate at your 24.0% rate — not tax advice; consult a CPA.
Condition & rehab AI · 12 photos
This well-maintained mobile home is in good condition with a good condition score of 75. It has a good exterior, interior walls, kitchen, bathrooms, and foundation. The home is ready for a fresh coat of paint and new carpets to increase its value.
Value-add opportunities
- Both Paint exterior — Enhances curb appeal and value
- Both Replace carpets — Improves comfort and value
- Both Replace kitchen appliances — Modernizes and increases value
- Both Replace bathroom fixtures — Modernizes and increases value
Renovation cost estimate screening
Value-add ROI direction
- Both Paint exterior — Enhances curb appeal and value ↑
- Both Replace carpets — Improves comfort and value ↑
- Both Replace kitchen appliances — Modernizes and increases value ↑
- Both Replace bathroom fixtures — Modernizes and increases value ↑
ⓘ Cost ranges are severity-bucket heuristics (US national rule-of-thumb). Get contractor quotes + a written scope before underwriting a rehab budget.
Schools (NCES district)
- District
- Torrance Unified
- NCES district ID
- 0639420
- Math proficiency
- 62% ▲ 2.00%
- Reading proficiency
- 67% ▬ 0.00%
- Median HH income
- $78,640
- Composite
- 58.96/100
- National rank
- #1969
- State rank
- #150 of 1400 in CA
Livability — Torrance
- Score
- 76/100
- State rank
- #95
- US rank
- #3501
Category grades
Schools grade is shown separately in the Schools card above.
Census & demographics
- Census place
- Torrance, CA
- County
- Los Angeles County · 9,444,647 people
- City population
- 153,473
- Metro
- Los Angeles-Long Beach-Anaheim, CA
- Population (ZIP)
- 41,787
- Household income
- $92,923
- Rent vs Own
- Severe rent burden
- 1972.0
Population outlook (Los Angeles County) Hauer SSP2
- Today (2025)
- 10,940,515 people
- By 2030
- 11,256,481 · +2.9%
- By 2040
- 11,729,929 · +7.2%
- By 2050
- 11,948,407 · +9.2%
- By 2075
- 11,818,114 · +8.0%
- By 2100
- 10,842,928 · -0.9%
Race, ethnicity, and origin ACS 2023
- Neighborhood character
- Diverse neighborhood (Simpson 0.70)
- Race & ethnicity
- Hispanic / Latino 43% Asian 27% White 20% Two or more races 15% Black 5%
- Hispanic origin (detail)
- Mexican 34%
- Common ancestry
- Slovak 1% Lithuanian 1% British 1%
- Foreign-born
- 33% · Canada, South Korea, China
- Languages at home
- 46% English-only · Spanish 32% Other Asian/Pacific 5% Korean 5%
Political lean MEDSL · Los Angeles
- 2024 margin
- Solid D (+32.9) · D 64.8% · R 31.9% · Other 3.3%
- 2008→2024 swing
- -7.4pp toward R · 2008: 40.4pp · 2024: 32.9pp
- All cycles
- 2024: D+32.9 2020: D+44.2 2016: D+48.0 2012: D+40.0 2008: D+40.4
Not yet ingested
- Civics
- —
Market trends
- HPI YoY
- ▼ -755.95%
- Current HPI
- 334.9041
- Rent YoY
- ▲ 3.25%
- Metro
- Los Angeles-Long Beach-Anaheim, CA
- State GDP YoY
- ▲ 3.21%
- F500 in state
- 116
Industry mix (Fortune 500 HQ in CA)
| Industry | F500 HQs | Revenue |
|---|---|---|
| Technology | 27 | $1,492B |
|
||
| Financial Services | 3 | $174B |
|
||
| Retail | 3 | $44B |
|
||
| Insurance | 3 | $26B |
|
||
| Media / Entertainment | 2 | $115B |
|
||
| Pharmaceuticals / Biotech | 2 | $62B |
|
||
Price history
-8.8% since first listed4 events — show timeline
- 2026-06-21 Price Changed $155,000 CRMLS
- 2026-06-08 Price Changed $160,000 CRMLS
- 2026-05-15 Price Changed $165,000 CRMLS
- 2026-04-22 Listed $170,000 CRMLS
Property tax history
+4.6%/yrLatest (2025): $663 · +4.6% YoY. Source: county tax records.
Cash-flow waterfall
monthlySold comps — $/sqft
last 12 mo · ≤1 miLoading sold comps…