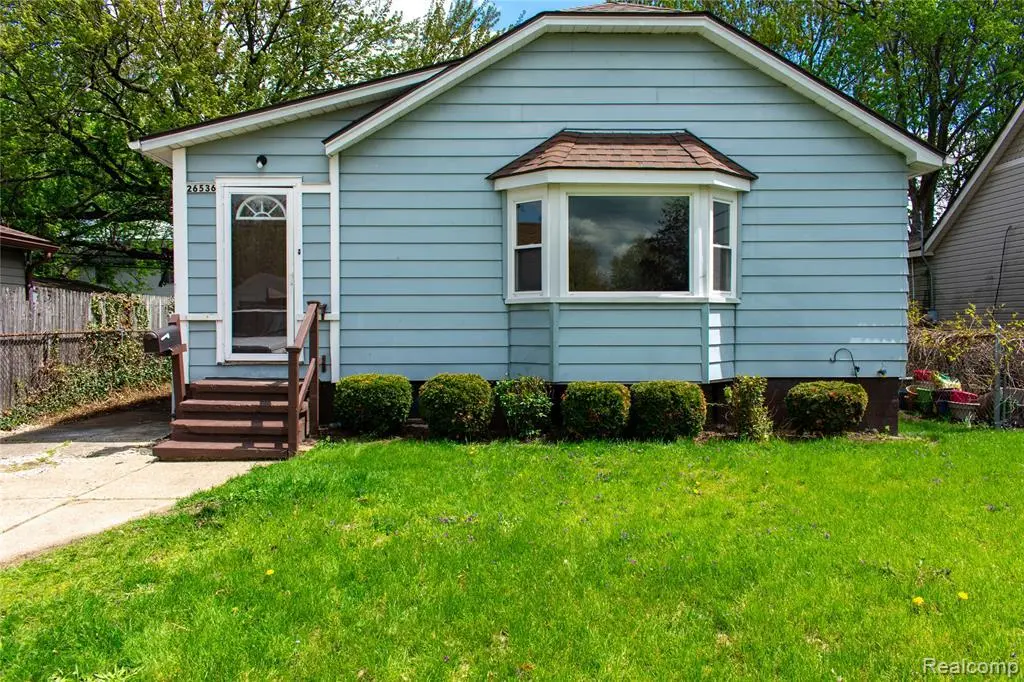
26536 Dartmouth St · Madison Heights, MI
Flood risk 1/10 · Minimal
- FEMA flood zone
- X (unshaded)
- Chance of flooding over 30 yrs
- 0.0%
- Est. flood insurance / yr
- $473 – $860
Fire risk 1/10 · Minimal
- Est. fire insurance / yr
- $784 – $1,456
Heat risk 3/10 · Minor
- Hot days now (above 98°F)
- 7 days/yr
- Hot days in 30 yrs
- 15 days/yr
Wind risk 2/10 · Minimal
- Chance of severe wind over 30 yrs
- —
Air-quality risk 3/10 · Minor
- Unhealthy air days now
- 3 days/yr
- Unhealthy air days in 30 yrs
- 5 days/yr
Risk factors via First Street. Map © Google.
Why this score? — see what drove the B grade
The composite is a weighted blend of 9 inputs, each scored 0–100. Each bar is that input's sub-score; the figure is the points it added to the 100-point composite (weight × sub-score).
- Cash flow +29.7/30.0
- ARV discount +15.0/15.0
- DSCR +10.0/10.0
- 1% rule +8.3/10.0
- Livability +4.0/5.0
- Rent growth +3.2/5.0
- Condition / age +2.5/5.0
- Schools +1.3/10.0
- Appreciation +0.0/10.0
$144,900
🖨 Deal sheet 📄 Offer letter ✓ Due diligence
Listing remarks MLS
Welcome to 26536 Dartmouth St! This charming 2-bedroom, 1-bath home offers a fantastic opportunity for homeowners and savvy investors alike. Whether you're looking for an affordable place to make your own or a property with strong rental potential, this home offers plenty of value and opportunity. Major updates include a newer roof (less than 2 years old) and a furnace approximately 10 years old, providing peace of mind and a strong foundation for future improvements. Inside, you'll find a full basement offering excellent storage and future finishing potential, along with a spacious backyard and a 1-car garage. Conveniently located just minutes from downtown Royal Oak, Woodward Ave, and I-75 with easy north and south access, this home is also only 15 minutes from downtown Detroit. Enjoy close proximity to parks, shopping, dining, and entertainment!
Key facts
- Newer roof
- Convenient location
- Furnace
Tags
Property features AI
Exterior
- Parking: Detached 1-car garage
- Utilities: Public sewer; Other water source
- Home design: Single-family residence; One level
- Construction: Aluminum siding; Block foundation; Built above grade: 854 square feet
- Exterior features: Paved road access; Lot approximately 0.12 acres (40 x 126); Ground-level entry with steps
Interior
- Kitchen: Free-standing gas range; Free-standing refrigerator; Microwave; Dishwasher not listed
- Bathrooms: 1 full bathroom
- Heating & cooling: Forced air heating (natural gas); No central cooling
- Interior features: Dryer and Washer; Microwave; Free-standing gas range; Free-standing refrigerator; Unfinished basement
- Laundry & utility: Washer and Dryer
Neighborhood map
What this means for you Summary
Snapshot
- This is a 2-bed/1.0-bath single-family listed at $145k.
Deal economics
- At list price, monthly cash flow is $528 ($6k/yr) — positive.
- The deal already cash-flows at list — no discount required.
- Meets the 1% rule at list price ($2k rent vs $145k).
- Recommended offer: $143k (1.5% below list) — sets the bar for market timing.
- Cap rate 10.7% vs local median 5.7% in Madison Heights — top-decile yield for the area; either an underpriced asset or a hidden risk that comps aren't pricing in. Stress-test before assuming the spread holds.
Location & tenants
- Location reads 81/100 on livability (#62 in MI, #1,347 nationally) — a professional / high-income tenant draw. Strengths: commute A+, cost of living A+, housing A+; Watch: schools D+, health & safety D.
- Madison District Public Schools (suburban): math 9% / reading 21% proficiency, ranked #502 of 540 in MI (top 93%) — low school quality limits family demand, transient renter base, plan for 1-2y turnover; 70% free/reduced lunch — lower-income household profile, screen leases tightly.
- Market conditions: Rents rising (+2.8%/yr); 135 active listings in the ZIP; 27 comparable units currently listed for rent nearby; rentals leasing fast (median 14d on market — plan ~1-2 weeks tenant-placement turnaround); 2,614 units permitted in Oakland County in 2024 (721 in 5+ unit buildings).
- This rent runs 33% of the median local income ($70k/yr) — at the standard rent-burdened threshold; future hikes will face affordability resistance.
Forward outlook
- Local home prices are declining (-3.0%/yr); year-one equity from $1k of loan paydown is wiped out by about $4k of value loss. Plan a longer hold.
- Oakland County population projected at +10% by 2050 — modest demand growth; plan on rents tracking national, not racing it.
- At projected returns (-3.0% appreciation + 2.8% rent growth), your $41k cash investment doubles in ~8 years — after that, you're playing with house money.
Negotiation context
- It's been on market 24 days — a 2% lower offer ($143k) is reasonable based on typical stale-listing flexibility.
- 2 sale attempts; this cycle's ask has dropped $15k (9%) from the opening price — seller is motivated, your offer sets the floor, not the list.
Risks & watch-outs
- Watch-outs: built in 1926 — expect roof / HVAC / electrical / plumbing capex.
Questions for the listing agent
- Built in 1926 — when were the roof, HVAC, electrical panel, plumbing, and water heater last replaced?
- Is there a deadline driving the sale (1031 exchange, divorce, estate, relocation)? That informs how much negotiation room exists.
- Schools are D-rated, which usually means shorter tenancies and higher turnover. Who's the typical renter profile here, and what's been the actual vacancy rate?
- What's the average days-on-market for RENTAL listings here right now (not sales)? A rising rental-DOM trend means longer vacancies and softer asking-rent achievability than the comps imply.
- What's the recent tenant-quality profile in this submarket — average credit score on applications, eviction rate, late-payment / NSF rate, and stable-employment percentage? A property-management company in the area should have these aggregated.
- How much new for-sale + rental construction is in the pipeline within 1–3 miles? Heavy new supply typically softens prices + rents 12–24 months out; constrained supply supports both.
Investment metrics
- 1% rule
- 1.33% ✓
- Cap rate
- 10.66%
- Cash-on-cash
- 15.61%
- DSCR
- 1.69
- GRM
- 6.3
CMA / ARV
- ARV (median comp)
- $182,684
- List price
- $144,900
- Delta
- -20.68%
- Verdict
- UNDERPRICED
- Comps
- 20 within 1.0 mi
Show comp detail 12 sales within ~0.75 mi
| Address | Dist | Beds/Ba | Sqft | Sold | Price | $/sf | Match |
|---|---|---|---|---|---|---|---|
| 26605 Rialto St | 0.67mi | 3/1.0 (+1) | 1,510 (+2%) | 1mo | $237,500 | $157 | 60 |
| 313 S Edison Ave | 0.63mi | 3/2.0 (+1) | 1,453 (-2%) | 1mo | $401,000 | $276 | 58 |
| 627 Symes Ave | 0.68mi | 3/1.0 (+1) | 1,520 (+2%) | 4mo | $275,000 | $181 | 56 |
| 1921 Kalama Ave | 0.67mi | 3/2.0 (+1) | 1,447 (-2%) | 0mo | $361,000 | $249 | 56 |
| 27756 Palmer Blvd | 0.62mi | 3/2.0 (+1) | 1,526 (+3%) | 2mo | $301,000 | $197 | 56 |
| 27129 Osmun St | 0.61mi | 3/1.0 (+1) | 1,400 (-6%) | 4mo | $195,000 | $139 | 54 |
| 2333 Barrett Ave | 0.65mi | 3/2.0 (+1) | 1,420 (-4%) | 2mo | $350,000 | $246 | 52 |
| 27392 Groveland St | 0.58mi | 3/1.0 (+1) | 1,650 (+11%) | 3mo | $230,000 | $139 | 47 |
| 219 N Edison Ave | 0.73mi | 3/1.5 (+1) | 1,333 (-10%) | 1mo | $400,000 | $300 | 41 |
| 430 S Edison Ave | 0.65mi | 3/2.0 (+1) | 1,686 (+14%) | 0mo | $425,000 | $252 | 38 |
| 1809 Taylor Ave | 0.74mi | 3/2.5 (+1) | 1,612 (+9%) | 4mo | $325,000 | $202 | 37 |
| 535 S Campbell Rd | 0.69mi | 3/2.5 (+1) | 1,700 (+15%) | 2mo | $328,000 | $193 | 31 |
Match score weights: distance 35% · size 25% · config 20% · recency 20%. Top-matched comps best support the ARV.
Projected returns pro-forma
-3.0% appreciation · 2.81% rent growth · sell at horizon
- IRR
- 6.2%
- Equity multiple
- 1.24×
- Total profit
- $9,789
- Equity at exit
- $21,605
- IRR
- 15.4%
- Equity multiple
- 2.24×
- Total profit
- $50,405
- Equity at exit
- $12,528
Cash invested: $40,572 (down + closing). Projections, not guarantees.
Landlord ↔ Tenant lean methodology
- Overall (STATE)
- 62 Landlord-Friendly
- State Michigan
- 62 Landlord-Friendly · EVEN
- County
- — inherits STATE
- City
- — inherits STATE
ZIP-level market 48071
- Rents YoY
- 2.8%
- Active inventory
- 135
- Price-to-rent
- 6.3×
Monthly cashflow live
- Estimated rent
- $1,930 high interval (Pro) →
- Mortgage (P&I)
- −$760
- Tax from tax record
- −$177 /mo · $2,122/yr
- Insurance
- −$60
- HOA
- −$0
- Vacancy / Maint / Mgmt
- −$405
- Net cashflow
- $528
Break-even live
UW: 25.0% down · 7.5% · 30yr · 1.5% tax · 5.0% vac · 8.0% maint · 8.0% mgmt
Financing live
Cash to close
- Down payment
- $36,225
- Closing costs
- $4,347
- Reserves months
- —
- Total cash needed
- —
Loan-product check · same deal, 3 products live
Conventional
25% down · 7.5% · 30yr
- Down + closing
- —
- Monthly P&I
- —
- Monthly cashflow
- —
- DSCR
- —
- Eligible?
- —
Personal DTI + credit; lowest rate.
DSCR
20% down · 8.5% · 30yr
- Down + closing
- —
- Monthly P&I
- —
- Monthly cashflow
- —
- DSCR
- —
- Eligible?
- —
No personal income docs; deal must DSCR.
Hard money
10% down · 12.0% · 12mo
- Down + closing
- —
- Monthly P&I
- —
- Monthly cashflow
- —
- DSCR
- —
- Eligible?
- —
Short-term bridge; refi at stabilization.
Rent comps 27 comps
| Address | Beds | Baths | Sqft | Rent | $/sqft | DOM | Units | Dist |
|---|---|---|---|---|---|---|---|---|
| 328 W Kalama Ave Madison Heights, MI | 3.0 | 1.0 | 900 | $1,575 | $1.75 | 4d | 1 | 0.44mi |
| 617 S Edgeworth Ave Royal Oak, MI | 2.0 | 1.0 | 955 | $2,125 | $2.23 | 24d | 1 | 0.49mi |
| 27865 Brettonwoods St Madison Heights, MI | 3.0 | 2.0 | 964 | $2,000 | $2.07 | 11d | 1 | 0.67mi |
| 1600 E 4th St Royal Oak, MI | 3.0 | 1.0 | 1166 | $3,200 | $2.74 | 12d | 1 | 0.73mi |
| 406 N Campbell Rd Royal Oak, MI | 3.0 | 2.0 | 1814 | $2,500 | $1.38 | 1d | 1 | 0.77mi |
| 28218 Diesing Dr Madison Heights, MI | 3.0 | 1.5 | 1009 | $1,700 | $1.68 | 43d | 1 | 0.84mi |
| 1816 Guthrie Ave Royal Oak, MI | 3.0 | 1.0 | 1100 | $1,800 | $1.64 | 4d | 1 | 0.94mi |
| 1725 Gardenia Ave Royal Oak, MI | 2.0 | 1.0 | 900 | $1,350 | $1.50 | 24d | 1 | 0.98mi |
| 642 Bellaire Ave Madison Heights, MI | 3.0 | 2.5 | 1750 | $2,423 | $1.38 | 21d | 1 | 1.00mi |
| 1132 N Campbell Rd Royal Oak, MI | 1.0–3.0 | 1.0–1.5 | 1050 | $1,722 | $1.64 | 1d | 7 | 1.01mi |
| 2181 Coy St Ferndale, MI | 3.0 | 1.0 | 1050 | $1,995 | $1.90 | 10d | 1 | 1.03mi |
| 818 Etowah Ave Unit 1032341P Royal Oak, MI | 2.0 | 1.0 | 893 | $6,755 | $7.56 | 13d | 1 | 1.04mi |
| 27385 Park Ct Unit 1364147P Madison Heights, MI | 3.0 | 1.0 | 904 | $1,678 | $1.86 | 1d | 1 | 1.07mi |
| 916 Cherokee Ave Royal Oak, MI | 2.0 | 1.5 | 944 | $2,250 | $2.38 | 2d | 1 | 1.12mi |
| 1414 Owana Ave Royal Oak, MI | 3.0 | 1.0 | 1489 | $1,675 | $1.12 | 21d | 1 | 1.14mi |
| 2186 Garfield St Ferndale, MI | 3.0 | 1.0 | 1300 | $1,750 | $1.35 | 24d | 1 | 1.19mi |
| 739 S Alexander Ave Unit Top Level Royal Oak, MI | 1.0 | 1.0 | 900 | $1,200 | $1.33 | 17d | 1 | 1.21mi |
| 691 E Mapledale Ave Hazel Park, MI | 2.0 | 1.0 | 1333 | $1,500 | $1.13 | 10d | 1 | 1.26mi |
| 959 E Shevlin Ave Hazel Park, MI | 3.0 | 1.0 | 1419 | $1,750 | $1.23 | 14d | 1 | 1.26mi |
| 1007 Gardenia Ave Unit 1009 Royal Oak, MI | 2.0 | 1.0 | 1000 | $1,400 | $1.40 | 24d | 1 | 1.31mi |
| 2420 Woodward Hts Ferndale, MI | 3.0 | 1.0 | 1316 | $2,200 | $1.67 | 24d | 1 | 1.36mi |
| 609 E Eleven Mile Rd Royal Oak, MI | 1.0–2.0 | 1.0 | 925 | $1,375 | $1.49 | 24d | 1 | 1.36mi |
| 322 Jeff Keeton Dr Hazel Park, MI | 2.0 | 2.5 | 1334 | $2,350 | $1.76 | 1d | 1 | 1.37mi |
| 1045 E 12 Mile Rd Madison Heights, MI | 3.0 | 1.0 | 1700 | $4,000 | $2.35 | 1d | 1 | 1.42mi |
| 25151 Dequindre Rd Madison Heights, MI | 3.0 | 2.0 | 1088 | $1,279 | $1.18 | 23d | 1 | 1.48mi |
| 1605 Anne Dr Royal Oak, MI | 2.0 | 3.5 | 1814 | $2,900 | $1.60 | 2d | 1 | 1.48mi |
| 2803 Grayson St Ferndale, MI | 3.0 | 2.0 | 1274 | $2,000 | $1.57 | 43d | 1 | 1.49mi |
Listing history 2 events
-
2026-05-02$159,900 Active 468-char remark
Show marketing remark (860 chars)
Welcome to 26536 Dartmouth St! This charming 2-bedroom, 1-bath home offers a fantastic opportunity for homeowners and savvy investors alike. Whether you're looking for an affordable place to make your own or a property with strong rental potential, this home offers plenty of value and opportunity. Major updates include a newer roof (less than 2 years old) and a furnace approximately 10 years old, providing peace of mind and a strong foundation for future improvements. Inside, you'll find a full basement offering excellent storage and future finishing potential, along with a spacious backyard and a 1-car garage. Conveniently located just minutes from downtown Royal Oak, Woodward Ave, and I-75 with easy north and south access, this home is also only 15 minutes from downtown Detroit. Enjoy close proximity to parks, shopping, dining, and entertainment!
ⓘ Source: listings_history table (triggers on properties + properties_extension) + one-shot
backfill from property_details.listing_events for pre-trigger history.
Tax reassessment forecast MI · Partial reset (capped growth)
- Current annual tax
- $2,122 · $177/mo
- Projected year-2 tax
- $2,177 · $181/mo
- Expected delta
- +$55/yr (+$5/mo · 2.6%)
ⓘ Screening estimate from a state-policy table — verify with the county assessor before closing.
Climate risk First Street
- Flood 1/10 Low FEMA zone X (unshaded) · 0% chance over 30 yrs
- Wildfire 1/10 Low
- Heat 3/10 Moderate 7 d/yr ≥98°F today · 15 d/yr by 30 yrs out
- Wind 2/10 Low
- Air quality 3/10 Moderate 3 unhealthy d/yr today · 5 by 30 yrs out
Nearby sold comps map
Loading sold comps map…
Walkable amenities ~0.75 mi
Loading nearby amenities…
Taxation est. · year 1
- Rental income
- $23,161
- − Mortgage interest
- −$8,117
- − Property taxes
- −$2,122
- − Insurance
- −$724
- − Repairs & maintenance
- −$1,853
- − Management
- −$1,853
- − Depreciation
- −$4,215
- Taxable income
- $4,277
- Est. tax owed @ 24.0%
- −$1,027
- After-tax cash flow
- $5,306/yr
For passive investors: Depreciation is non-cash, so a rental often shows a tax loss while cash-flowing — sheltering income. Rental losses are passive: they offset passive income freely, and up to $25,000/yr can offset ordinary (W-2) income if you actively participate and your MAGI is under $100k (phasing out to $0 by $150k); unused losses carry forward. On sale, claimed depreciation is recaptured at up to 25%, and gains may owe capital-gains tax (a 1031 exchange can defer both). Figures are a year-1 estimate at your 24.0% rate — not tax advice; consult a CPA.
Schools (NCES district)
- District
- Madison District Public Schools
- NCES district ID
- 2622290
- Math proficiency
- 9% ▼ -11.00%
- Reading proficiency
- 21% ▼ -12.00%
- Median HH income
- $41,297
- Composite
- 12.89/100
- National rank
- #9586
- State rank
- #502 of 540 in MI
Livability — Madison Heights
- Score
- 81/100
- State rank
- #62
- US rank
- #1347
Category grades
Schools grade is shown separately in the Schools card above.
Census & demographics
- Census place
- Madison Heights, MI
- County
- Oakland County · 1,009,092 people
- City population
- 28,419
- Metro
- Detroit-Warren-Dearborn, MI
- Population (ZIP)
- 28,419
- Household income
- $69,503
- Rent vs Own
- Severe rent burden
- 786.0
Population outlook (Oakland County) Hauer SSP2
- Today (2025)
- 1,335,747 people
- By 2030
- 1,375,100 · +2.9%
- By 2040
- 1,435,385 · +7.5%
- By 2050
- 1,469,250 · +10.0%
- By 2075
- 1,531,946 · +14.7%
- By 2100
- 1,450,485 · +8.6%
Race, ethnicity, and origin ACS 2023
- Neighborhood character
- Predominantly White (79%)
- Race & ethnicity
- White 79% Black 7% Asian 7% Two or more races 4% Hispanic / Latino 2%
- Common ancestry
- Romanian 11% Lithuanian 3% Slovak 2%
- Foreign-born
- 14% · China, Canada, South Korea
- Languages at home
- 84% English-only · Chinese 3% Other Indo-European 3% Arabic 2%
Political lean MEDSL · Oakland
- 2024 margin
- D (+10.6) · D 54.4% · R 43.8% · Other 1.9%
- 2008→2024 swing
- -3.9pp toward R · 2008: 14.5pp · 2024: 10.6pp
- All cycles
- 2024: D+10.6 2020: D+14.1 2016: D+8.1 2012: D+8.1 2008: D+14.5
Not yet ingested
- Civics
- —
Market trends
- HPI YoY
- ▼ -275.69%
- Current HPI
- 243.4861
- Rent YoY
- ▲ 2.81%
- Metro
- Detroit-Warren-Dearborn, MI
- State GDP YoY
- ▲ 1.37%
- F500 in state
- 28
Industry mix (Fortune 500 HQ in MI)
| Industry | F500 HQs | Revenue |
|---|---|---|
| Automotive Parts | 3 | $48B |
|
||
| Automotive | 2 | $372B |
|
||
| Chemicals | 1 | $45B |
|
||
| Automotive Retail | 1 | $29B |
|
||
| Healthcare / Medical Devices | 1 | $23B |
|
||
| Automotive Technology | 1 | $20B |
|
||
Price history
-13.1% since first listed8 events — show timeline
- 2026-06-17 Sold (MLS) $138,900 REALCOMP
- 2026-06-17 Sold (MLS) $138,900 MiRealSource-MiMLS
- 2026-05-26 Pending — MiRealSource-MiMLS
- 2026-05-26 Pending — REALCOMP
- 2026-05-22 Price Changed $144,900 MiRealSource-MiMLS
- 2026-05-21 Price Changed $144,900 REALCOMP
- 2026-05-02 Listed $159,900 REALCOMP
- 2026-05-02 Listed $159,900 MiRealSource-MiMLS
Property tax history
+5.4%/yrLatest (2025): $2,122 · +2.8% YoY. Source: county tax records.
Cash-flow waterfall
monthlySold comps — $/sqft
last 12 mo · ≤1 miLoading sold comps…