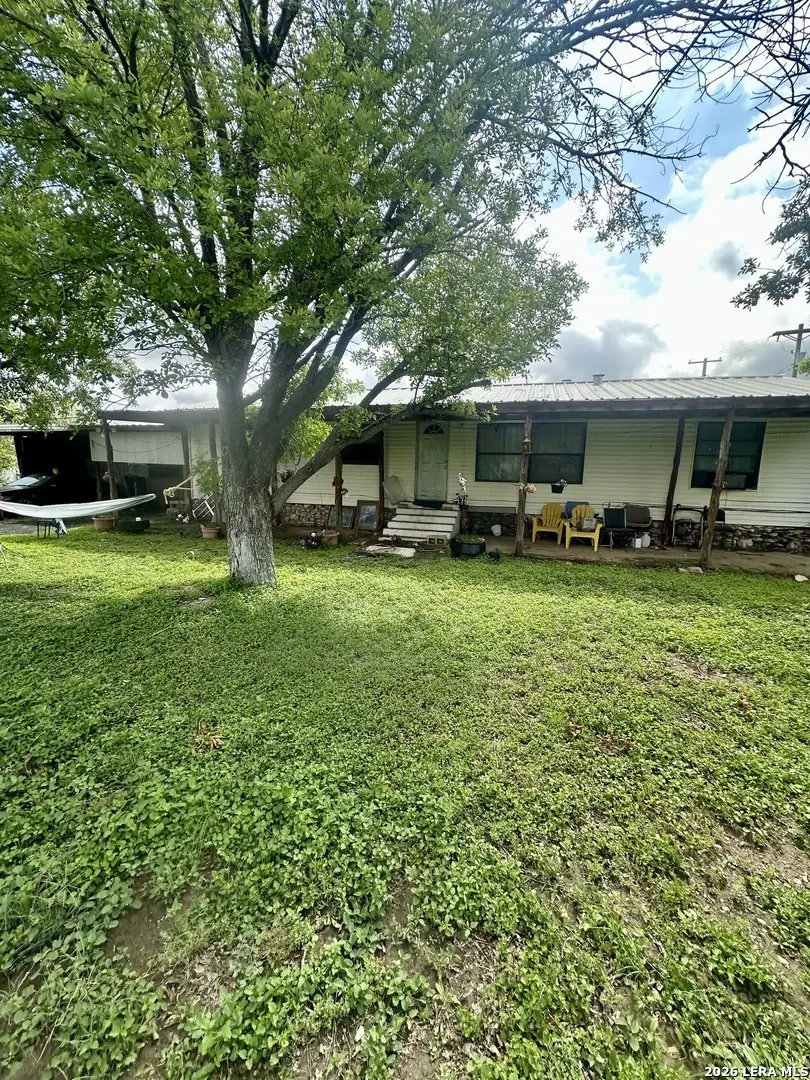
906 EL Paso St · Sabinal, TX
Flood risk 1/10 · Minimal
- FEMA flood zone
- X (unshaded)
- Chance of flooding over 30 yrs
- 0.0%
- Est. flood insurance / yr
- $507 – $1,088
Fire risk 5/10 · Moderate
- Est. fire insurance / yr
- $1,222 – $2,270
Heat risk 8/10 · Major
- Hot days now (above 108°F)
- 7 days/yr
- Hot days in 30 yrs
- 22 days/yr
Wind risk 6/10 · Moderate
- Chance of severe wind over 30 yrs
- 61.0%
Air-quality risk 1/10 · Minimal
- Unhealthy air days now
- 0 days/yr
- Unhealthy air days in 30 yrs
- 0 days/yr
Risk factors via First Street. Map © Google.
Why this score? — see what drove the B grade
The composite is a weighted blend of 9 inputs, each scored 0–100. Each bar is that input's sub-score; the figure is the points it added to the 100-point composite (weight × sub-score).
- Cash flow +30.0/30.0
- 1% rule +10.0/10.0
- DSCR +10.0/10.0
- ARV discount +7.5/15.0
- Appreciation +5.2/10.0
- Livability +2.8/5.0
- Rent growth +2.5/5.0
- Condition / age +2.5/5.0
- Schools +2.3/10.0
$75,000
🖨 Deal sheet 📄 Offer letter ✓ Due diligence
Listing remarks
Take advantage of this investment opportunity in Sabinal! This corner lot features a manufactured home with great potential for renovation or a full makeover. Priced to sell and offered as is, this property is perfect for investors, flippers, or buyers looking to customize a home to their own style. Located in a quiet area, you'll enjoy the small town charm Sabinal is known for, while still being close to everyday essentials. The property offers easy access to Uvalde and is within driving distance of San Antonio. Outdoor enthusiasts will appreciate being near the Frio River and Garner State Park, making this a great location for those who enjoy nature and weekend getaways. Bring your vision
Key facts
- Manufactured home
- Near frio river
- Corner lot
Tags
Property features AI
Finance
- Other: Possession at closing/funding; For sale (not a short sale)
- Financial info: Down payment assistance not indicated
- HOA & community: Located in Dunlap Subdivision/Sabinal
Exterior
- Utilities: City water and sewer
- Home design: Siding exterior; Metal roof; Pre-owned (approx. 39 years old)
- Construction: Metal roof; Siding exterior
- Exterior features: Chain link fence; Corner lot; Paved streets
Interior
- Kitchen: Kitchen about 10 x 10
- Bedrooms: Master bedroom about 11 x 10; Second bedroom about 10 x 10; Third bedroom about 10 x 10; Master bedroom has additional features noted in remarks
- Flooring: Linoleum flooring
- Bathrooms: Two full bathrooms; Master bathroom with shower only (approx. 5 x 7)
- Heating & cooling: One window A/C; Other heating and fuel types (see remarks)
- Interior features: City garbage service; One living area
Neighborhood map
What this means for you Summary
Snapshot
- This is a 3-bed/2.0-bath manufactured listed at $75k.
Deal economics
- At list price, monthly cash flow is $377 ($5k/yr) — positive.
- The deal already cash-flows at list — no discount required.
- Meets the 1% rule at list price ($1k rent vs $75k).
Location & tenants
- Location reads 55/100 on livability (#1,346 in TX) — a working-class tenant base; expect higher turnover. Strengths: crime A+, cost of living A+, housing A-; Watch: amenities F, commute F, employment F.
- Sabinal ISD (rural): math 25% / reading 31% proficiency, ranked #686 of 826 in TX (top 83%) — low school quality limits family demand, transient renter base, plan for 1-2y turnover; 63% free/reduced lunch — lower-income household profile, screen leases tightly.
- Zoned schools: Sabinal El (math 22% / reading 37%, grade F, #2,525 of 4,322 statewide, top 62%, 234 students, 87% FRL); Sabinal Secondary (math 34% / reading 34%, grade F, #963 of 1,632 statewide, top 61%, 132 students, 58% FRL).
- Market conditions: 28 active listings in the ZIP; 17 units permitted in Uvalde County in 2024 (0 in 5+ unit buildings).
Forward outlook
- In year one you build about $774 of equity ($519 loan paydown + $255 appreciation (0.3% local appreciation)).
- Uvalde County population projected at +14% by 2050 — modest demand growth; plan on rents tracking national, not racing it.
- At projected returns (0.3% appreciation + 3.0% rent growth), your $21k cash investment doubles in ~4 years — after that, you're playing with house money.
Negotiation context
- Only 12 days on market — expect competitive offers; lowballing is unlikely to land.
Risks & watch-outs
- Climate carrying-cost: major wind risk, 61% chance of damaging wind over 30y; moderate wildfire risk; extreme-heat days projected 7→22/yr by 2055 (HVAC capex compounding) — expect insurance premiums to compound above CPI over the hold.
Questions for the listing agent
- Is there a deadline driving the sale (1031 exchange, divorce, estate, relocation)? That informs how much negotiation room exists.
- Schools are D-rated, which usually means shorter tenancies and higher turnover. Who's the typical renter profile here, and what's been the actual vacancy rate?
- What's the average days-on-market for RENTAL listings here right now (not sales)? A rising rental-DOM trend means longer vacancies and softer asking-rent achievability than the comps imply.
- What's the recent tenant-quality profile in this submarket — average credit score on applications, eviction rate, late-payment / NSF rate, and stable-employment percentage? A property-management company in the area should have these aggregated.
- How much new for-sale + rental construction is in the pipeline within 1–3 miles? Heavy new supply typically softens prices + rents 12–24 months out; constrained supply supports both.
Investment metrics
- 1% rule
- 1.52% ✓
- Cap rate
- 12.33%
- Cash-on-cash
- 21.54%
- DSCR
- 1.96
- GRM
- 5.5
CMA / ARV
No comps found within radius.
Projected returns pro-forma
0.34% appreciation · 3.0% rent growth · sell at horizon
- IRR
- 22.2%
- Equity multiple
- 2.10×
- Total profit
- $23,045
- Equity at exit
- $23,060
- IRR
- 25.9%
- Equity multiple
- 3.97×
- Total profit
- $62,297
- Equity at exit
- $28,765
Cash invested: $21,000 (down + closing). Projections, not guarantees.
Landlord ↔ Tenant lean methodology
- Overall (STATE)
- 87 Strongly Landlord-Friendly
- State Texas
- 87 Strongly Landlord-Friendly · R+5
- County
- — inherits STATE
- City
- — inherits STATE
ZIP-level market 78881
- Home prices YoY
- 0.3%
- Active inventory
- 28
- Price-to-rent
- 5.5×
Monthly cashflow live
- Estimated rent
- $1,143 medium interval (Pro) →
- Mortgage (P&I)
- −$393
- Tax from tax record
- −$101 /mo · $1,217/yr
- Insurance
- −$31
- HOA
- −$0
- Vacancy / Maint / Mgmt
- −$240
- Net cashflow
- $377
Break-even live
UW: 25.0% down · 7.5% · 30yr · 1.5% tax · 5.0% vac · 8.0% maint · 8.0% mgmt
Financing live
Cash to close
- Down payment
- $18,750
- Closing costs
- $2,250
- Reserves months
- —
- Total cash needed
- —
Loan-product check · same deal, 3 products live
Conventional
25% down · 7.5% · 30yr
- Down + closing
- —
- Monthly P&I
- —
- Monthly cashflow
- —
- DSCR
- —
- Eligible?
- —
Personal DTI + credit; lowest rate.
DSCR
20% down · 8.5% · 30yr
- Down + closing
- —
- Monthly P&I
- —
- Monthly cashflow
- —
- DSCR
- —
- Eligible?
- —
No personal income docs; deal must DSCR.
Hard money
10% down · 12.0% · 12mo
- Down + closing
- —
- Monthly P&I
- —
- Monthly cashflow
- —
- DSCR
- —
- Eligible?
- —
Short-term bridge; refi at stabilization.
Listing history 5 events
-
2026-06-02status $75,000 Pending 12 DOM
-
2026-06-01days on market $75,000 Active 12 DOM
-
2026-05-31statusdays on market $75,000 Active 11 DOM
-
2026-05-20$75,000 New
-
1993-12-01soldstatus
ⓘ Source: listings_history table (triggers on properties + properties_extension) + one-shot
backfill from property_details.listing_events for pre-trigger history.
Tax reassessment forecast TX · Resets to sale price
- Current annual tax
- $1,217 · $101/mo
- Projected year-2 tax
- $1,372 · $114/mo
- Expected delta
- +$156/yr (+$13/mo · 12.8%)
ⓘ Screening estimate from a state-policy table — verify with the county assessor before closing.
Climate risk First Street
- Flood 1/10 Low FEMA zone X (unshaded) · 0% chance over 30 yrs
- Wildfire 5/10 Major
- Heat 8/10 Severe 7 d/yr ≥108°F today · 22 d/yr by 30 yrs out
- Wind 6/10 Major 61% chance of damaging wind over 30 yrs
- Air quality 1/10 Low 0 unhealthy d/yr today · 0 by 30 yrs out
Nearby sold comps map
Loading sold comps map…
Walkable amenities ~0.75 mi
Loading nearby amenities…
Taxation est. · year 1
- Rental income
- $13,716
- − Mortgage interest
- −$4,201
- − Property taxes
- −$1,217
- − Insurance
- −$375
- − Repairs & maintenance
- −$1,097
- − Management
- −$1,097
- − Depreciation
- −$2,182
- Taxable income
- $3,547
- Est. tax owed @ 24.0%
- −$851
- After-tax cash flow
- $3,673/yr
For passive investors: Depreciation is non-cash, so a rental often shows a tax loss while cash-flowing — sheltering income. Rental losses are passive: they offset passive income freely, and up to $25,000/yr can offset ordinary (W-2) income if you actively participate and your MAGI is under $100k (phasing out to $0 by $150k); unused losses carry forward. On sale, claimed depreciation is recaptured at up to 25%, and gains may owe capital-gains tax (a 1031 exchange can defer both). Figures are a year-1 estimate at your 24.0% rate — not tax advice; consult a CPA.
Schools (NCES district)
- District
- Sabinal ISD
- NCES district ID
- 4838430
- Math proficiency
- 25% ▼ -6.00%
- Reading proficiency
- 31% ▼ -3.00%
- Median HH income
- $35,048
- Composite
- 23.09/100
- National rank
- #7965
- State rank
- #686 of 826 in TX
Livability — Sabinal
- Score
- 55/100
- State rank
- #1346
- US rank
- #23212
Category grades
Schools grade is shown separately in the Schools card above.
Census & demographics
- Census place
- Sabinal, TX
- Population (ZIP)
- 1,288
Population outlook (Uvalde County) Hauer SSP2
- Today (2025)
- 28,865 people
- By 2030
- 29,675 · +2.8%
- By 2040
- 31,256 · +8.3%
- By 2050
- 32,790 · +13.6%
- By 2075
- 37,013 · +28.2%
- By 2100
- 37,306 · +29.2%
Race, ethnicity, and origin ACS 2023
- Race & ethnicity
- White 49% Hispanic / Latino 49% Two or more races 16%
- Hispanic origin (detail)
- Mexican 41%
- Common ancestry
- Serbian 10% Slovak 8% Lithuanian 1%
- Foreign-born
- 14% · Canada
- Languages at home
- 58% English-only · Spanish 42%
Political lean MEDSL · Uvalde
- 2024 margin
- Solid R (+33.4) · D 32.9% · R 66.3%
- 2008→2024 swing
- -28.1pp toward R · 2008: -5.3pp · 2024: -33.4pp
- All cycles
- 2024: R+33.4 2020: R+20.3 2016: R+10.8 2012: R+8.3 2008: R+5.3
Not yet ingested
- Civics
- —
Market trends
- HPI YoY
- ▲ 0.34%
- Current HPI
- 106.0073
- Rent YoY
- —
- Metro
- —
- State GDP YoY
- ▲ 3.95%
- F500 in state
- 110
Industry mix (Fortune 500 HQ in TX)
| Industry | F500 HQs | Revenue |
|---|---|---|
| Energy | 16 | $1,198B |
|
||
| Technology | 5 | $198B |
|
||
| Engineering / Construction | 4 | $72B |
|
||
| Energy Services | 3 | $60B |
|
||
| Utilities | 3 | $41B |
|
||
| Healthcare | 2 | $330B |
|
||
Price history
2 events — show timeline
- 2026-05-20 Listed $75,000 LERA
- 1993-12-01 Sold (Public Records) — Public Records
Property tax history
+5.3%/yrLatest (2025): $1,217 · +5.4% YoY. Source: county tax records.
Cash-flow waterfall
monthlySold comps — $/sqft
last 12 mo · ≤1 miLoading sold comps…