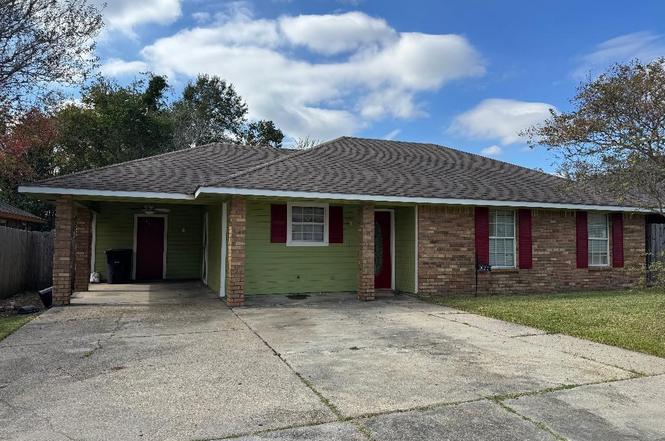
6053 Ingram Dr · Merrydale, LA
Flood risk 1/10 · Minimal
- FEMA flood zone
- X (unshaded)
- Chance of flooding over 30 yrs
- 0.0%
- Est. flood insurance / yr
- $507 – $1,088
Fire risk 1/10 · Minimal
- Est. fire insurance / yr
- $1,269 – $2,357
Heat risk 8/10 · Major
- Hot days now (above 108°F)
- 7 days/yr
- Hot days in 30 yrs
- 21 days/yr
Wind risk 9/10 · Severe
- Chance of severe wind over 30 yrs
- 99.0%
Air-quality risk 3/10 · Minor
- Unhealthy air days now
- 3 days/yr
- Unhealthy air days in 30 yrs
- 4 days/yr
Risk factors via First Street. Map © Google.
Why this score? — see what drove the A- grade
The composite is a weighted blend of 9 inputs, each scored 0–100. Each bar is that input's sub-score; the figure is the points it added to the 100-point composite (weight × sub-score).
- Cash flow +29.8/30.0
- ARV discount +15.0/15.0
- DSCR +10.0/10.0
- 1% rule +8.5/10.0
- Appreciation +8.0/10.0
- Livability +2.9/5.0
- Rent growth +2.5/5.0
- Condition / age +2.5/5.0
- Schools +2.4/10.0
$110,000
🖨 Deal sheet (PDF) 📄 Offer letter ✓ Due diligence
Listing remarks MLS
Subject to short sale approval
Key facts
- 4,356 sq ft lot
- 3 parking spots
- Built 1987
Neighborhood map
What this means for you Summary
Snapshot
- This is a 3-bed/2.0-bath single-family listed at $110k.
Deal economics
- At list price, monthly cash flow is $405 ($5k/yr) — positive.
- The deal already cash-flows at list — no discount required.
- Meets the 1% rule at list price ($1k rent vs $110k).
- Cap rate 10.7% vs local median 7.8% in Merrydale — top-decile yield for the area; either an underpriced asset or a hidden risk that comps aren't pricing in. Stress-test before assuming the spread holds.
Location & tenants
- Location reads 58/100 on livability (#301 in LA) — a working-class tenant base; expect higher turnover. Strengths: cost of living A+, housing A; Watch: crime F, amenities F, commute F.
- East Baton Rouge Parish (urban): math 22% / reading 34% proficiency, ranked #47 of 98 in LA (top 48%) — low school quality limits family demand, transient renter base, plan for 1-2y turnover; 77% free/reduced lunch — lower-income household profile, screen leases tightly.
- Zoned schools: Glen Oaks Park Elementary School (math 14% / reading 27%, grade F, #439 of 646 statewide, top 68%, 446 students, 91% FRL); Liberty High School (math 50% / reading 74%, grade B-, #15 of 265 statewide, top 6%, 1,208 students, 60% FRL) — zoned schools at 75% FRL track the district average.
- Zoned-school proficiency averages 41% at this address vs 28% district-wide (+13 pts) — the actual schools serving this property are materially stronger than the East Baton Rouge Parish average implies; a family-tenant draw the district grade alone would hide.
- Market conditions: 39 active listings in the ZIP; 6 comparable units currently listed for rent nearby; rentals at typical pace (median 25d on market — plan ~3-4 weeks tenant-placement turnaround); 2,252 units permitted in East Baton Rouge Parish in 2024 (440 in 5+ unit buildings).
Forward outlook
- In year one you build about $7k of equity ($761 loan paydown + $7k appreciation (5.9% local appreciation)).
- East Baton Rouge County population projected at +4% by 2050 — modest demand growth; plan on rents tracking national, not racing it.
- At projected returns (5.9% appreciation + 3.0% rent growth), your $31k cash investment doubles in ~3 years — after that, you're playing with house money.
- By year 5, paydown + projected appreciation supports a ~$32k cash-out refi (75% LTV) — recoverable capital for the next deal without selling this one.
Negotiation context
- Only 1 days on market — expect competitive offers; lowballing is unlikely to land.
- 3 sale attempts with the ask held roughly flat each time — persistent listings suggest the price (not the market) is what's stuck; bring a comps-based counter.
Risks & watch-outs
- Climate carrying-cost: severe wind risk, 99% chance of damaging wind over 30y; extreme-heat days projected 7→21/yr by 2055 (HVAC capex compounding) — expect insurance premiums to compound above CPI over the hold.
Questions for the listing agent
- Is there a deadline driving the sale (1031 exchange, divorce, estate, relocation)? That informs how much negotiation room exists.
- Crime grade is F in this area — have there been break-ins, vandalism, or insurance claims at this property in the last 3 years? What carrier currently insures it and at what premium?
- What's the average days-on-market for RENTAL listings here right now (not sales)? A rising rental-DOM trend means longer vacancies and softer asking-rent achievability than the comps imply.
- What's the recent tenant-quality profile in this submarket — average credit score on applications, eviction rate, late-payment / NSF rate, and stable-employment percentage? A property-management company in the area should have these aggregated.
- How much new for-sale + rental construction is in the pipeline within 1–3 miles? Heavy new supply typically softens prices + rents 12–24 months out; constrained supply supports both.
Investment metrics
- 1% rule
- 1.35% ✓
- Cap rate
- 10.71%
- Cash-on-cash
- 15.76%
- DSCR
- 1.70
- GRM
- 6.2
CMA / ARV
- ARV (on-the-fly)
- $151,976
- Comps found
- 12
Show comp detail 12 sales within ~0.75 mi
| Address | Dist | Beds/Ba | Sqft | Sold | Price | $/sf | Match |
|---|---|---|---|---|---|---|---|
| 6040 Lanier Dr | 0.10mi | 3/1.5 | 1,250 (-0%) | 9mo | $169,999 | $136 | 85 |
| 6855 Dalark Dr | 0.37mi | 3/2.0 | 1,300 (+4%) | 3mo | $158,900 | $122 | 75 |
| 6655 Dalark Dr | 0.28mi | 3/2.0 | 1,221 (-3%) | 9mo | $147,000 | $120 | 75 |
| 7751 Bringhurst Ave | 0.18mi | 3/1.5 | 1,180 (-6%) | 13mo | $134,900 | $114 | 69 |
| 7224 Poinsetta Dr | 0.49mi | 4/2.0 (+1) | 1,235 (-2%) | 1mo | $175,000 | $142 | 69 |
| 6912 Oak Park Dr | 0.47mi | 4/2.0 (+1) | 1,225 (-2%) | 2mo | $172,800 | $141 | 68 |
| 7819 Greenwell St | 0.46mi | 3/1.5 | 1,293 (+3%) | 6mo | $107,500 | $83 | 66 |
| 5911 Benson Dr | 0.24mi | 3/1.5 | 1,133 (-10%) | 5mo | $99,900 | $88 | 66 |
| 6970 Coronet Dr | 0.65mi | 3/1.5 | 1,226 (-2%) | 1mo | $119,900 | $98 | 63 |
| 5837 Denova St | 0.54mi | 3/2.0 | 1,150 (-8%) | 6mo | $139,000 | $121 | 56 |
| 7754 Grayson Ave | 0.43mi | 3/2.0 | 1,357 (+8%) | 13mo | $154,900 | $114 | 56 |
| 5621 Lanier Dr | 0.39mi | 3/1.5 | 1,081 (-14%) | 11mo | $160,000 | $148 | 48 |
Match score weights: distance 35% · size 25% · config 20% · recency 20%. Top-matched comps best support the ARV.
Projected returns pro-forma
5.93% appreciation · 3.0% rent growth · sell at horizon
- IRR
- 28.4%
- Equity multiple
- 2.85×
- Total profit
- $57,097
- Equity at exit
- $68,664
- IRR
- 26.6%
- Equity multiple
- 5.80×
- Total profit
- $147,944
- Equity at exit
- $124,101
Cash invested: $30,800 (down + closing). Projections, not guarantees.
Landlord ↔ Tenant lean methodology
- Overall (STATE)
- 90 Strongly Landlord-Friendly
- State Louisiana
- 90 Strongly Landlord-Friendly · R+12
- County
- — inherits STATE
- City
- — inherits STATE
ZIP-level market 70812
- Home prices YoY
- 3.5%
- Active inventory
- 39
- Price-to-rent
- 6.2×
Monthly cashflow live
- Estimated rent
- $1,484 high interval (Pro) →
- Mortgage (P&I)
- −$577
- Tax from tax record
- −$145 /mo · $1,737/yr
- Insurance
- −$46
- HOA
- −$0
- Vacancy / Maint / Mgmt
- −$312
- Net cashflow
- $405
Break-even live
Sensitivity live
| Price | -10% $467 | -5% $436 | +0% $405 | +5% $373 | +10% $342 |
|---|---|---|---|---|---|
| Rent | -10% $287 | -5% $346 | +0% $405 | +5% $463 | +10% $522 |
| Rate | -1.0pp $460 | -0.5pp $433 | base $405 | +0.5pp $376 | +1.0pp $347 |
UW: 25.0% down · 7.5% · 30yr · 1.5% tax · 5.0% vac · 8.0% maint · 8.0% mgmt
Financing live
Cash to close
- Down payment
- $27,500
- Closing costs
- $3,300
- Reserves months
- —
- Total cash needed
- —
Loan-product check · same deal, 3 products live
Conventional
25% down · 7.5% · 30yr
- Down + closing
- —
- Monthly P&I
- —
- Monthly cashflow
- —
- DSCR
- —
- Eligible?
- —
Personal DTI + credit; lowest rate.
DSCR
20% down · 8.5% · 30yr
- Down + closing
- —
- Monthly P&I
- —
- Monthly cashflow
- —
- DSCR
- —
- Eligible?
- —
No personal income docs; deal must DSCR.
Hard money
10% down · 12.0% · 12mo
- Down + closing
- —
- Monthly P&I
- —
- Monthly cashflow
- —
- DSCR
- —
- Eligible?
- —
Short-term bridge; refi at stabilization.
Rent comps 6 comps
| Address | Beds | Baths | Sqft | Rent | $/sqft | DOM | Units | Dist |
|---|---|---|---|---|---|---|---|---|
| 8614 Forestwood Ave Baton Rouge, LA | 3.0 | 2.0 | 1313 | $1,700 | $1.29 | 15d | 1 | 0.59mi |
| 5255 Astoria Dr Baton Rouge, LA | 3.0 | 2.0 | 1463 | $1,295 | $0.89 | 45d | 1 | 0.90mi |
| 9173 Cedar Ct Baton Rouge, LA | 4.0 | 2.0 | 1405 | $1,596 | $1.14 | 15d | 1 | 0.93mi |
| 9062 Cedar Ct Baton Rouge, LA | 3.0 | 2.0 | 1350 | $1,158 | $0.86 | 25d | 1 | 1.01mi |
| 7745 S Maribel Ct Baton Rouge, LA | 3.0 | 2.0 | 1682 | $1,500 | $0.89 | 22d | 1 | 1.29mi |
| 7745 S Maribel Ct Baton Rouge, LA | 3.0 | 2.0 | 1682 | $1,500 | $0.89 | 46d | 1 | 1.29mi |
Listing history 5 events
-
2026-02-17status Pending
-
2026-02-17status Active
-
2026-01-26$110,000
Show marketing remark (30 chars)
Subject to short sale approval
-
2026-01-26$110,000 30-char remark
Show marketing remark (30 chars)
Subject to short sale approval
-
1987-10-30soldstatus
ⓘ Source: listings_history table (triggers on properties + properties_extension) + one-shot
backfill from property_details.listing_events for pre-trigger history.
Tax reassessment forecast LA · Resets to sale price
- Current annual tax
- $1,737 · $145/mo
- Projected year-2 tax
- $1,737 · $145/mo
- Expected delta
- $0/yr ($0/mo · 0.0%)
ⓘ Screening estimate from a state-policy table — verify with the county assessor before closing.
Climate risk First Street
- Flood 1/10 Low FEMA zone X (unshaded) · 0% chance over 30 yrs
- Wildfire 1/10 Low
- Heat 8/10 Severe 7 d/yr ≥108°F today · 21 d/yr by 30 yrs out
- Wind 9/10 Extreme 99% chance of damaging wind over 30 yrs
- Air quality 3/10 Moderate 3 unhealthy d/yr today · 4 by 30 yrs out
Nearby sold comps map
Loading sold comps map…
Walkable amenities ~0.75 mi
Loading nearby amenities…
Taxation est. · year 1
- Rental income
- $17,803
- − Mortgage interest
- −$6,162
- − Property taxes
- −$1,737
- − Insurance
- −$550
- − Repairs & maintenance
- −$1,424
- − Management
- −$1,424
- − Depreciation
- −$3,200
- Taxable income
- $3,306
- Est. tax owed @ 24.0%
- −$793
- After-tax cash flow
- $4,062/yr
For passive investors: Depreciation is non-cash, so a rental often shows a tax loss while cash-flowing — sheltering income. Rental losses are passive: they offset passive income freely, and up to $25,000/yr can offset ordinary (W-2) income if you actively participate and your MAGI is under $100k (phasing out to $0 by $150k); unused losses carry forward. On sale, claimed depreciation is recaptured at up to 25%, and gains may owe capital-gains tax (a 1031 exchange can defer both). Figures are a year-1 estimate at your 24.0% rate — not tax advice; consult a CPA.
Schools (NCES district)
- District
- East Baton Rouge Parish
- NCES district ID
- 2200540
- Math proficiency
- 22% ▼ -36.00%
- Reading proficiency
- 34% ▼ -31.00%
- Median HH income
- $46,263
- Composite
- 24.14/100
- National rank
- #7745
- State rank
- #47 of 98 in LA
Livability — Merrydale
- Score
- 58/100
- State rank
- #301
- US rank
- #21115
Category grades
Schools grade is shown separately in the Schools card above.
Census & demographics
- Census place
- Merrydale, LA
- City population
- 11,124
- Population (ZIP)
- 11,124
Population outlook (East Baton Rouge County) Hauer SSP2
- Today (2025)
- 464,810 people
- By 2030
- 472,137 · +1.6%
- By 2040
- 480,243 · +3.3%
- By 2050
- 484,422 · +4.2%
- By 2075
- 492,069 · +5.9%
- By 2100
- 476,347 · +2.5%
Race, ethnicity, and origin ACS 2023
- Neighborhood character
- Predominantly Black (97%)
- Race & ethnicity
- Black 97% Hispanic / Latino 2% White 1%
- Foreign-born
- 1% · Canada
- Languages at home
- 99% English-only · Spanish 1%
Political lean MEDSL · East Baton Rouge
- 2024 margin
- D (+11.1) · D 54.5% · R 43.4% · Other 2.1%
- 2008→2024 swing
- +8.9pp toward D · 2008: 2.2pp · 2024: 11.1pp
- All cycles
- 2024: D+11.1 2020: D+13.1 2016: D+9.2 2012: D+5.2 2008: D+2.2
Not yet ingested
- Civics
- —
Market trends
- HPI YoY
- ▲ 5.93%
- Current HPI
- 174.6882
- Rent YoY
- —
- Metro
- —
- State GDP YoY
- ▲ 3.29%
- F500 in state
- 10
Industry mix (Fortune 500 HQ in LA)
| Industry | F500 HQs | Revenue |
|---|---|---|
| Telecommunications | 2 | $23B |
|
||
| Utilities | 1 | $12B |
|
||
| Wholesale / Distribution | 1 | $5B |
|
||
| Advertising | 1 | $2B |
|
||
Price history
+0.0% since first listed5 events — show timeline
- 2026-02-17 Pending — GBRMLS
- 2026-02-17 Relisted — GBRMLS
- 2026-01-26 Listed $110,000 AcadianaMLS
- 2026-01-26 Listed $110,000 GBRMLS
- 1987-10-30 Sold (Public Records) — Public Records
Property tax history
+19.8%/yrLatest (2025): $1,737 · -0.4% YoY. Source: county tax records.
Cash-flow waterfall
monthlySold comps — $/sqft
last 12 mo · ≤1 miLoading sold comps…