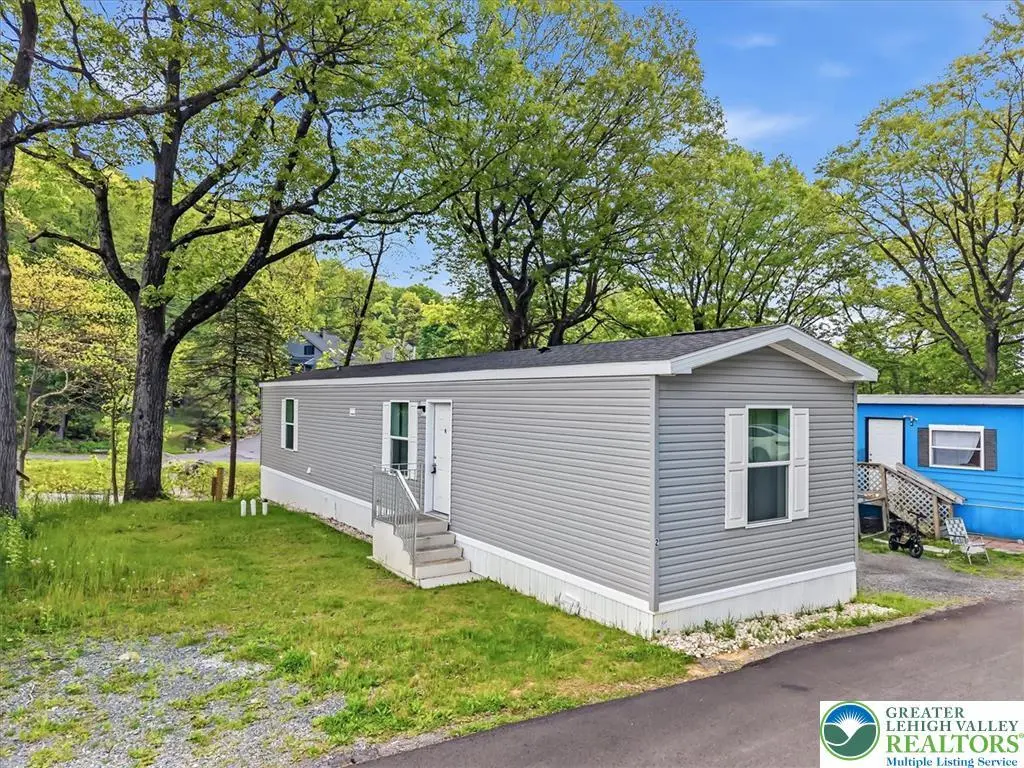
2 Indian Trl · Wind Gap, PA
Flood risk 1/10 · Minimal
- FEMA flood zone
- X (unshaded)
- Chance of flooding over 30 yrs
- 0.0%
- Est. flood insurance / yr
- $473 – $860
Fire risk 3/10 · Minor
- Est. fire insurance / yr
- $511 – $949
Heat risk 3/10 · Minor
- Hot days now (above 94°F)
- 6 days/yr
- Hot days in 30 yrs
- 13 days/yr
Wind risk 4/10 · Minor
- Chance of severe wind over 30 yrs
- 11.0%
Air-quality risk 2/10 · Minimal
- Unhealthy air days now
- 1 days/yr
- Unhealthy air days in 30 yrs
- 2 days/yr
Risk factors via First Street. Map © Google.
Why this score? — see what drove the D- grade
The composite is a weighted blend of 9 inputs, each scored 0–100. Each bar is that input's sub-score; the figure is the points it added to the 100-point composite (weight × sub-score).
- 1% rule +9.6/10.0
- ARV discount +7.5/15.0
- Cash flow +7.0/30.0
- Schools +4.1/10.0
- Livability +3.5/5.0
- Rent growth +2.5/5.0
- Condition / age +2.5/5.0
- DSCR +1.2/10.0
- Appreciation +0.0/10.0
$95,900
🖨 Deal sheet (PDF) 📄 Offer letter ✓ Due diligence
Listing remarks
Welcome to 2 Indian Trail in Wind Gap’s Indian Steps community - a brand-new 2025 “The Gem – Ruby” manufactured home offering stylish, low-maintenance living with modern finishes and energy-efficient construction throughout. This thoughtfully designed 2-bedroom, 2-bath home features an open-concept layout with recessed lighting, durable modern flooring, and a bright living area that flows seamlessly into the kitchen and dining space. The kitchen offers stainless steel appliances, gas range, shaker-style cabinetry, ample storage, and oversized peninsula seating ideal for everyday living and entertaining. The spacious primary suite includes a walk-in closet and private
Key facts
- Walk-in closet
- Gas range
- Open-concept layout
Tags
Property features AI
Finance
- Other: Energy Star Certified homes (green feature)
- HOA & community: Association fee $660 per month; Property has a land lease
Exterior
- Parking: Driveway; Off-street parking
- Utilities: Cable available; 100 amp service with circuit breakers; Community/coop sewer; Community/coop water
- Home design: Single-story; New construction; Has a view; Zoned RM
- Construction: Vinyl and wood siding; Asphalt/fiberglass roof
- Exterior features: Propane tank (leased); Mobile home structure; Flat lot; Not in a subdivision; Private road frontage; Paved road
Interior
- Kitchen: Dishwasher; Gas oven; Gas range; Refrigerator; Propane water heater
- Bedrooms: Total rooms: 5 (includes bedrooms and living areas)
- Flooring: Carpet; Laminate; Resilient flooring
- Bathrooms: 2 full bathrooms
- Heating & cooling: Forced air heating (gas and propane); Central air conditioning
- Interior features: Dining area; Eat-in kitchen; Mud room; Utility room; Walk-in closet(s); Window treatments; Drapes
- Laundry & utility: Washer hookup on main level; Dryer hookup on main level
Neighborhood map
What this means for you Summary
Snapshot
- This is a 2-bed/2.0-bath manufactured listed at $96k.
Deal economics
- At list price, monthly cash flow is $-139 ($-2k/yr) — negative.
- To cash-flow at today's rent, offer at most $71k (25.7% below list).
- Meets the 1% rule at list price ($1k rent vs $96k).
- Recommended offer: $71k (25.7% below list) — sets the bar for cash-flow.
Location & tenants
- Location reads 70/100 on livability (#753 in PA) — a middle-class / working-renter tenant base. Strengths: crime A+, cost of living A+, housing A+; Watch: employment D, amenities F, commute F.
- Pen Argyl Area SD (suburban): math 38% / reading 57% proficiency, ranked #217 of 539 in PA (top 40%) — families likely to look elsewhere, expect single-tenant / working-renter base with shorter leases.
- Zoned schools: Plainfield El Sch (math 52% / reading 62%, grade C+, #444 of 1,518 statewide, top 32%, 420 students, 53% FRL); Wind Gap Ms (math 28% / reading 56%, grade D-, #221 of 512 statewide, top 45%, 518 students, 46% FRL); Pen Argyl Area Hs (math 77% / reading 75%, grade A-, #25 of 437 statewide, top 6%, 502 students, 35% FRL) — zoned schools average 44% FRL vs 27% district-wide (17 pts higher); higher-poverty schools than district average — tighter screening recommended.
- Market conditions: 33 active listings in the ZIP; 1 comparable units currently listed for rent nearby; 567 units permitted in Northampton County in 2024 (151 in 5+ unit buildings).
Forward outlook
- Local home prices are declining (-3.0%/yr); year-one equity from $663 of loan paydown is wiped out by about $3k of value loss. Plan a longer hold.
Negotiation context
- It's been on market 19 days — a 2% lower offer ($94k) is reasonable based on typical stale-listing flexibility.
Risks & watch-outs
- Watch-outs: HOA is 47% of rent.
Questions for the listing agent
- What do current leases actually rent for vs. the listed asking? Can we see a recent rent roll and the last 12 months of T-12 income?
- What does the HOA fee cover, when was the last increase, and are there any pending special assessments or reserve-fund shortfalls?
- Is there a deadline driving the sale (1031 exchange, divorce, estate, relocation)? That informs how much negotiation room exists.
- Schools are D-rated, which usually means shorter tenancies and higher turnover. Who's the typical renter profile here, and what's been the actual vacancy rate?
- The area grade is low — what's the realistic commute time and amenity access for the typical tenant pool here? Any planned neighborhood developments (good or bad) we should know about?
- What's the average days-on-market for RENTAL listings here right now (not sales)? A rising rental-DOM trend means longer vacancies and softer asking-rent achievability than the comps imply.
- What's the recent tenant-quality profile in this submarket — average credit score on applications, eviction rate, late-payment / NSF rate, and stable-employment percentage? A property-management company in the area should have these aggregated.
- How much new for-sale + rental construction is in the pipeline within 1–3 miles? Heavy new supply typically softens prices + rents 12–24 months out; constrained supply supports both.
Investment metrics
- 1% rule
- 1.46% ✓
- Cap rate
- 4.55%
- Cash-on-cash
- -6.23%
- DSCR
- 0.72
- GRM
- 5.7
CMA / ARV
- ARV (on-the-fly)
- $39,480
- Comps found
- 3
Show comp detail 3 sales within ~0.75 mi
| Address | Dist | Beds/Ba | Sqft | Sold | Price | $/sf | Match |
|---|---|---|---|---|---|---|---|
| 11 Indian Trl | 0.04mi | 2/2.0 | 890 (+6%) | 10mo | $83,600 | $94 | 80 |
| 28 Indian Trl | 0.04mi | 2/1.0 | 800 (-5%) | 8mo | $36,035 | $45 | 79 |
| 15 Indian Trl | 0.04mi | 2/1.5 | 896 (+7%) | 14mo | $42,500 | $47 | 74 |
Match score weights: distance 35% · size 25% · config 20% · recency 20%. Top-matched comps best support the ARV.
Projected returns pro-forma
-3.0% appreciation · 3.0% rent growth · sell at horizon
- IRR
- -26.4%
- Equity multiple
- 0.10×
- Total profit
- $-24,033
- Equity at exit
- $14,299
- IRR
- -21.8%
- Equity multiple
- -0.15×
- Total profit
- $-30,811
- Equity at exit
- $8,292
Cash invested: $26,852 (down + closing). Projections, not guarantees.
Landlord ↔ Tenant lean methodology
- Overall (STATE)
- 62 Landlord-Friendly
- State Pennsylvania
- 62 Landlord-Friendly · EVEN
- County
- — inherits STATE
- City
- — inherits STATE
ZIP-level market 18091
- Active inventory
- 33
- Price-to-rent
- 5.7×
Monthly cashflow live
- Estimated rent
- $1,400 medium interval (Pro) →
- Mortgage (P&I)
- −$503
- Tax from tax record
- −$42 /mo · $509/yr
- Insurance
- −$40
- HOA
- −$660
- Vacancy / Maint / Mgmt
- −$294
- Net cashflow
- $-139
Break-even live
Sensitivity live
| Price | -10% $-85 | -5% $-112 | +0% $-139 | +5% $-166 | +10% $-194 |
|---|---|---|---|---|---|
| Rent | -10% $-250 | -5% $-195 | +0% $-139 | +5% $-84 | +10% $-29 |
| Rate | -1.0pp $-91 | -0.5pp $-115 | base $-139 | +0.5pp $-164 | +1.0pp $-189 |
UW: 25.0% down · 7.5% · 30yr · 1.5% tax · 5.0% vac · 8.0% maint · 8.0% mgmt
Financing live
Cash to close
- Down payment
- $23,975
- Closing costs
- $2,877
- Reserves months
- —
- Total cash needed
- —
Loan-product check · same deal, 3 products live
Conventional
25% down · 7.5% · 30yr
- Down + closing
- —
- Monthly P&I
- —
- Monthly cashflow
- —
- DSCR
- —
- Eligible?
- —
Personal DTI + credit; lowest rate.
DSCR
20% down · 8.5% · 30yr
- Down + closing
- —
- Monthly P&I
- —
- Monthly cashflow
- —
- DSCR
- —
- Eligible?
- —
No personal income docs; deal must DSCR.
Hard money
10% down · 12.0% · 12mo
- Down + closing
- —
- Monthly P&I
- —
- Monthly cashflow
- —
- DSCR
- —
- Eligible?
- —
Short-term bridge; refi at stabilization.
Rent comps 1 comps
| Address | Beds | Baths | Sqft | Rent | $/sqft | DOM | Units | Dist |
|---|---|---|---|---|---|---|---|---|
| 152 Water St Wind Gap, PA | 2.0 | 1.0 | 600 | $1,400 | $2.33 | 4d | 1 | 0.97mi |
HOA detail
- Monthly dues
- $660 · $7,920/yr
- Likely covers
- gas
Listing history 7 events
-
2026-06-05statusdays on market $95,900 Pending 19 DOM
-
2026-06-03days on market $95,900 Active 18 DOM
-
2026-06-02days on market $95,900 Active 17 DOM
-
2026-06-01days on market $95,900 Active 16 DOM
-
2026-05-31days on market $95,900 Active 15 DOM
-
2026-05-31days on market $95,900 Active 14 DOM
-
2026-05-15$95,900 Active
ⓘ Source: listings_history table (triggers on properties + properties_extension) + one-shot
backfill from property_details.listing_events for pre-trigger history.
Tax reassessment forecast PA · Partial reset (capped growth)
- Current annual tax
- $509 · $42/mo
- Projected year-2 tax
- $1,012 · $84/mo
- Expected delta
- +$503/yr (+$42/mo · 98.8%)
ⓘ Screening estimate from a state-policy table — verify with the county assessor before closing.
Climate risk First Street
- Flood 1/10 Low FEMA zone X (unshaded) · 0% chance over 30 yrs
- Wildfire 3/10 Moderate
- Heat 3/10 Moderate 6 d/yr ≥94°F today · 13 d/yr by 30 yrs out
- Wind 4/10 Moderate 11% chance of damaging wind over 30 yrs
- Air quality 2/10 Low 1 unhealthy d/yr today · 2 by 30 yrs out
Nearby sold comps map
Loading sold comps map…
Walkable amenities ~0.75 mi
Loading nearby amenities…
Taxation est. · year 1
- Rental income
- $16,800
- − Mortgage interest
- −$5,372
- − Property taxes
- −$509
- − Insurance
- −$480
- − Repairs & maintenance
- −$1,344
- − Management
- −$1,344
- − HOA
- −$7,920
- − Depreciation
- −$2,790
- Taxable loss
- −$2,958
- Est. tax savings @ 24.0%
- +$710
- After-tax cash flow
- $-962/yr
For passive investors: Depreciation is non-cash, so a rental often shows a tax loss while cash-flowing — sheltering income. Rental losses are passive: they offset passive income freely, and up to $25,000/yr can offset ordinary (W-2) income if you actively participate and your MAGI is under $100k (phasing out to $0 by $150k); unused losses carry forward. On sale, claimed depreciation is recaptured at up to 25%, and gains may owe capital-gains tax (a 1031 exchange can defer both). Figures are a year-1 estimate at your 24.0% rate — not tax advice; consult a CPA.
Schools (NCES district)
- District
- Pen Argyl Area SD
- NCES district ID
- 4218570
- Math proficiency
- 38% ▼ -9.00%
- Reading proficiency
- 57% ▼ -6.00%
- Median HH income
- $54,057
- Composite
- 41.03/100
- National rank
- #3585
- State rank
- #217 of 539 in PA
Livability — Wind Gap
- Score
- 70/100
- State rank
- #753
- US rank
- #7506
Category grades
Schools grade is shown separately in the Schools card above.
Census & demographics
- Census place
- Wind Gap, PA
- Population (ZIP)
- 6,091
Population outlook (Northampton County) Hauer SSP2
- Today (2025)
- 312,227 people
- By 2030
- 314,769 · +0.8%
- By 2040
- 316,914 · +1.5%
- By 2050
- 318,037 · +1.9%
- By 2075
- 334,003 · +7.0%
- By 2100
- 344,696 · +10.4%
Race, ethnicity, and origin ACS 2023
- Neighborhood character
- Predominantly White (92%)
- Race & ethnicity
- White 92% Two or more races 6% Hispanic / Latino 4% Black 1%
- Common ancestry
- French 4% Polish 3% Romanian 3%
- Foreign-born
- 6% · Canada
- Languages at home
- 91% English-only · Russian/Polish/Slavic 4% Spanish 2% Other Asian/Pacific 1%
Political lean MEDSL · Northampton
- 2024 margin
- Toss-up / Even · D 48.6% · R 50.4%
- 2008→2024 swing
- -14.1pp toward R · 2008: 12.3pp · 2024: -1.8pp
- All cycles
- 2024: R+1.8 2020: D+0.7 2016: R+3.8 2012: D+4.6 2008: D+12.3
Not yet ingested
- Civics
- —
Market trends
- HPI YoY
- ▼ -145.73%
- Current HPI
- 196.8806
- Rent YoY
- —
- Metro
- —
- State GDP YoY
- ▲ 1.68%
- F500 in state
- 34
Industry mix (Fortune 500 HQ in PA)
| Industry | F500 HQs | Revenue |
|---|---|---|
| Healthcare | 2 | $309B |
|
||
| Insurance | 2 | $27B |
|
||
| Telecommunications / Media | 1 | $124B |
|
||
| Industrial Distribution | 1 | $22B |
|
||
| Financial Services | 1 | $20B |
|
||
| Chemicals / Materials | 1 | $18B |
|
||
Price history
1 event — show timeline
- 2026-05-15 Listed $95,900 GLVRMLS
Property tax history
+2.0%/yrLatest (2024): $509 · +0.0% YoY. Source: county tax records.
Cash-flow waterfall
monthlySold comps — $/sqft
last 12 mo · ≤1 miLoading sold comps…