1670 Terminal Loop Rd · McQueeney, TX
Flood risk 9/10 · Severe
- FEMA flood zone
- AE
- Chance of flooding over 30 yrs
- 0.99%
- Est. flood insurance / yr
- $1,737 – $8,500
Fire risk 3/10 · Minor
- Est. fire insurance / yr
- $1,222 – $2,270
Heat risk 8/10 · Major
- Hot days now (above 108°F)
- 5 days/yr
- Hot days in 30 yrs
- 16 days/yr
Wind risk 8/10 · Major
- Chance of severe wind over 30 yrs
- 80.0%
Air-quality risk 1/10 · Minimal
- Unhealthy air days now
- 0 days/yr
- Unhealthy air days in 30 yrs
- 0 days/yr
Risk factors via First Street. Map © Google.
Why this score? — see what drove the D grade
The composite is a weighted blend of 9 inputs, each scored 0–100. Each bar is that input's sub-score; the figure is the points it added to the 100-point composite (weight × sub-score).
- Cash flow +11.3/30.0
- ARV discount +7.5/15.0
- Appreciation +4.9/10.0
- 1% rule +3.4/10.0
- Livability +3.4/5.0
- DSCR +3.3/10.0
- Rent growth +2.5/5.0
- Condition / age +2.5/5.0
- Schools +2.4/10.0
$345,000
🖨 Deal sheet 📄 Offer letter ✓ Due diligence
Listing remarks MLS
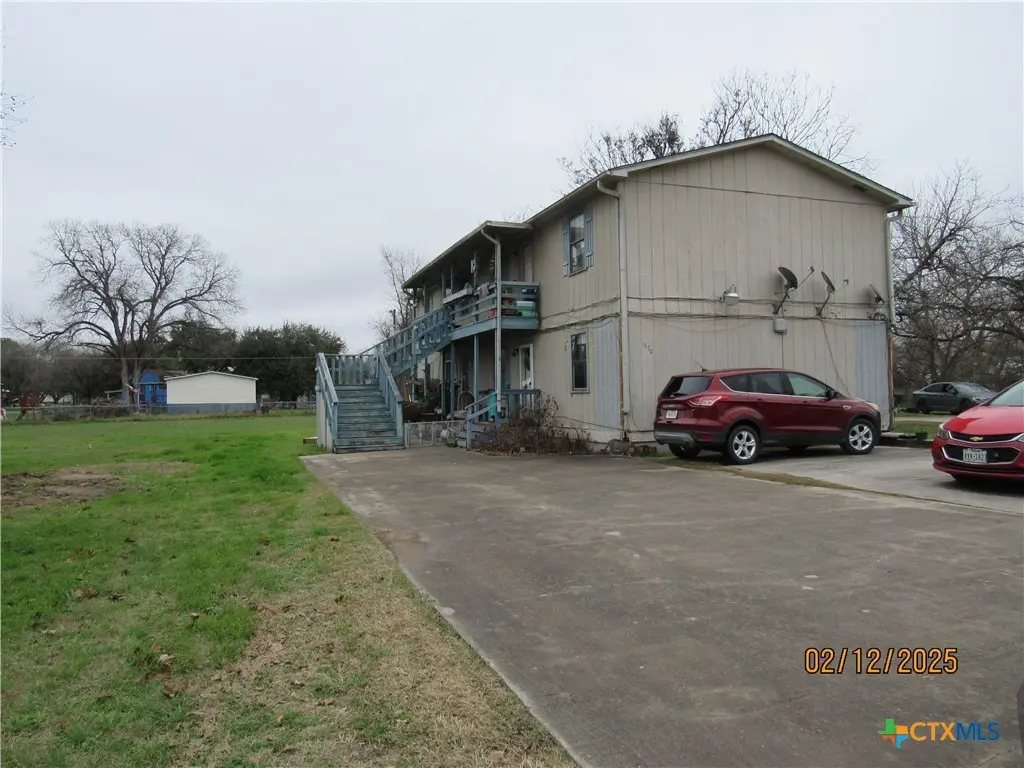
Excellent investment opportunity. Four plex on a spacious lot located across from Lake McQueeney. Property features a concrete driveway and ample parking for tenants. Schedule a showing today.
Key facts
- Ample parking
- Spacious lot
- Concrete driveway
Tags
Neighborhood map
What this means for you Summary
Snapshot
- This is a townhouse listed at $345k.
Deal economics
- At list price, monthly cash flow is $-552 ($-7k/yr) — negative.
- To cash-flow at today's rent, offer at most $248k (28.2% below list).
- To meet the 1% rule (rent ≥ 1% of price), the offer needs to be $289k (16.3% below list).
- Recommended offer: $248k (28.2% below list) — sets the bar for cash-flow.
- Cap rate 5.9% vs local median 1.2% in McQueeney — top-decile yield for the area; either an underpriced asset or a hidden risk that comps aren't pricing in. Stress-test before assuming the spread holds.
Location & tenants
- Location reads 67/100 on livability (#559 in TX) — a middle-class / working-renter tenant base. Strengths: crime A+, employment A+, cost of living A+; Watch: schools D, amenities F, commute F.
- Seguin ISD (town): math 26% / reading 30% proficiency, ranked #663 of 826 in TX (top 80%) — low school quality limits family demand, transient renter base, plan for 1-2y turnover; 63% free/reduced lunch — lower-income household profile, screen leases tightly.
- Market conditions: 32 active listings in the ZIP; 2 comparable units currently listed for rent nearby; 2,064 units permitted in Guadalupe County in 2024 (133 in 5+ unit buildings).
Forward outlook
- In year one you build about $1k of equity ($2k loan paydown + $-929 appreciation (-0.3% local appreciation)).
- Guadalupe County population projected at +61% by 2050 — long-run rental-demand tailwind backs the buy-and-hold thesis.
Negotiation context
- It's been on market 489 days — a 12% lower offer ($304k) is reasonable based on typical stale-listing flexibility.
Risks & watch-outs
- Watch-outs: flood insurance adds $427/mo.
- Climate carrying-cost: in FEMA flood zone AE (mandatory federal flood insurance); severe wind risk, 80% chance of damaging wind over 30y; extreme-heat days projected 5→16/yr by 2055 (HVAC capex compounding) — expect insurance premiums to compound above CPI over the hold.
Questions for the listing agent
- What do current leases actually rent for vs. the listed asking? Can we see a recent rent roll and the last 12 months of T-12 income?
- It's been on market 489 days. Have you received any prior offers? Is the seller open to a 28% concession, seller financing, or rate buy-down credit?
- What's the actual annual flood-insurance premium (NFIP or private), and is the property in a SFHA with mandatory coverage?
- Why hasn't it sold? Are there any deal-killer items the seller is aware of (foundation, flood, title, zoning, code violations)?
- Is there a deadline driving the sale (1031 exchange, divorce, estate, relocation)? That informs how much negotiation room exists.
- Schools are D-rated, which usually means shorter tenancies and higher turnover. Who's the typical renter profile here, and what's been the actual vacancy rate?
- The area grade is low — what's the realistic commute time and amenity access for the typical tenant pool here? Any planned neighborhood developments (good or bad) we should know about?
- What's the average days-on-market for RENTAL listings here right now (not sales)? A rising rental-DOM trend means longer vacancies and softer asking-rent achievability than the comps imply.
- What's the recent tenant-quality profile in this submarket — average credit score on applications, eviction rate, late-payment / NSF rate, and stable-employment percentage? A property-management company in the area should have these aggregated.
- How much new for-sale + rental construction is in the pipeline within 1–3 miles? Heavy new supply typically softens prices + rents 12–24 months out; constrained supply supports both.
Investment metrics
- 1% rule
- 0.84% ✗
- Cap rate
- 5.86%
- Cash-on-cash
- -1.55%
- DSCR
- 0.93
- GRM
- 10.0
CMA / ARV
No comps found within radius.
Projected returns pro-forma
-0.27% appreciation · 3.0% rent growth · sell at horizon
- IRR
- -11.2%
- Equity multiple
- 0.49×
- Total profit
- $-49,247
- Equity at exit
- $95,559
- IRR
- -4.7%
- Equity multiple
- 0.52×
- Total profit
- $-46,410
- Equity at exit
- $111,242
Cash invested: $96,600 (down + closing). Projections, not guarantees.
Landlord ↔ Tenant lean methodology
- Overall (STATE)
- 87 Strongly Landlord-Friendly
- State Texas
- 87 Strongly Landlord-Friendly · R+5
- County
- — inherits STATE
- City
- — inherits STATE
ZIP-level market 78123
- Home prices YoY
- -0.1%
- Active inventory
- 32
- Price-to-rent
- 10.0×
Monthly cashflow live
- Estimated rent
- $2,887 medium interval (Pro) →
- Mortgage (P&I)
- −$1,809
- Tax from tax record
- −$453 /mo · $5,438/yr
- Insurance
- −$144
- Flood insurance flood zone
- −$427 /mo · $5,118/yr
- HOA
- −$0
- Vacancy / Maint / Mgmt
- −$606
- Net cashflow
- $-552
Break-even live
UW: 25.0% down · 7.5% · 30yr · 1.5% tax · 5.0% vac · 8.0% maint · 8.0% mgmt
Financing live
Cash to close
- Down payment
- $86,250
- Closing costs
- $10,350
- Reserves months
- —
- Total cash needed
- —
Loan-product check · same deal, 3 products live
Conventional
25% down · 7.5% · 30yr
- Down + closing
- —
- Monthly P&I
- —
- Monthly cashflow
- —
- DSCR
- —
- Eligible?
- —
Personal DTI + credit; lowest rate.
DSCR
20% down · 8.5% · 30yr
- Down + closing
- —
- Monthly P&I
- —
- Monthly cashflow
- —
- DSCR
- —
- Eligible?
- —
No personal income docs; deal must DSCR.
Hard money
10% down · 12.0% · 12mo
- Down + closing
- —
- Monthly P&I
- —
- Monthly cashflow
- —
- DSCR
- —
- Eligible?
- —
Short-term bridge; refi at stabilization.
Rent comps 2 comps
| Address | Beds | Baths | Sqft | Rent | $/sqft | DOM | Units | Dist |
|---|---|---|---|---|---|---|---|---|
| 156 Trelawney St McQueeney, TX | 3.0 | 3.0 | 2122 | $2,600 | $1.23 | 1d | 1 | 0.29mi |
| 906 Lakeview Trl Mc Queeney, TX | 3.0 | 2.0 | 1942 | $3,500 | $1.80 | 1d | 1 | 0.57mi |
Listing history 17 events
-
2026-06-18days on market $345,000 Active 489 DOM
-
2026-06-17days on market $345,000 Active 488 DOM
-
2026-06-16days on market $345,000 Active 487 DOM
-
2026-06-13days on market $345,000 Active 484 DOM
-
2026-06-09days on market $345,000 Active 480 DOM
-
2026-06-08days on market $345,000 Active 479 DOM
-
2026-06-07days on market $345,000 Active 478 DOM
-
2026-06-04days on market $345,000 Active 475 DOM
-
2026-06-03days on market $345,000 Active 474 DOM
-
2026-06-02days on market $345,000 Active 473 DOM
-
2026-06-01days on market $345,000 Active 472 DOM
-
2026-05-31days on market $345,000 Active 471 DOM
-
2026-03-26price $345,000 192-char remark
Show marketing remark (192 chars)
Excellent investment opportunity. Four plex on a spacious lot located across from Lake McQueeney. Property features a concrete driveway and ample parking for tenants. Schedule a showing today.
-
2025-08-11price $350,000 192-char remark
Show marketing remark (192 chars)
Excellent investment opportunity. Four plex on a spacious lot located across from Lake McQueeney. Property features a concrete driveway and ample parking for tenants. Schedule a showing today.
-
2025-05-06price $368,000 192-char remark
Show marketing remark (192 chars)
Excellent investment opportunity. Four plex on a spacious lot located across from Lake McQueeney. Property features a concrete driveway and ample parking for tenants. Schedule a showing today.
-
2025-02-14$398,600 Active 192-char remark
Show marketing remark (192 chars)
Excellent investment opportunity. Four plex on a spacious lot located across from Lake McQueeney. Property features a concrete driveway and ample parking for tenants. Schedule a showing today.
-
2018-06-22soldstatus
ⓘ Source: listings_history table (triggers on properties + properties_extension) + one-shot
backfill from property_details.listing_events for pre-trigger history.
Tax reassessment forecast TX · Resets to sale price
- Current annual tax
- $5,438 · $453/mo
- Projected year-2 tax
- $6,314 · $526/mo
- Expected delta
- +$876/yr (+$73/mo · 16.1%)
ⓘ Screening estimate from a state-policy table — verify with the county assessor before closing.
Climate risk First Street
- Flood 9/10 Extreme FEMA zone AE · 99% chance over 30 yrs
- Wildfire 3/10 Moderate
- Heat 8/10 Severe 5 d/yr ≥108°F today · 16 d/yr by 30 yrs out
- Wind 8/10 Severe 80% chance of damaging wind over 30 yrs
- Air quality 1/10 Low 0 unhealthy d/yr today · 0 by 30 yrs out
Nearby sold comps map
Loading sold comps map…
Walkable amenities ~0.75 mi
Loading nearby amenities…
Taxation est. · year 1
- Rental income
- $34,649
- − Mortgage interest
- −$19,325
- − Property taxes
- −$5,438
- − Insurance
- −$6,844
- − Repairs & maintenance
- −$2,772
- − Management
- −$2,772
- − Depreciation
- −$10,036
- Taxable loss
- −$12,538
- Est. tax savings @ 24.0%
- +$3,009
- After-tax cash flow
- $-3,610/yr
For passive investors: Depreciation is non-cash, so a rental often shows a tax loss while cash-flowing — sheltering income. Rental losses are passive: they offset passive income freely, and up to $25,000/yr can offset ordinary (W-2) income if you actively participate and your MAGI is under $100k (phasing out to $0 by $150k); unused losses carry forward. On sale, claimed depreciation is recaptured at up to 25%, and gains may owe capital-gains tax (a 1031 exchange can defer both). Figures are a year-1 estimate at your 24.0% rate — not tax advice; consult a CPA.
Schools (NCES district)
- District
- Seguin ISD
- NCES district ID
- 4839690
- Math proficiency
- 26% ▼ -8.00%
- Reading proficiency
- 30% ▼ -5.00%
- Median HH income
- $46,210
- Composite
- 24.17/100
- National rank
- #7738
- State rank
- #663 of 826 in TX
Livability — McQueeney
- Score
- 67/100
- State rank
- #559
- US rank
- #10747
Category grades
Schools grade is shown separately in the Schools card above.
Census & demographics
- Census place
- McQueeney, TX
- City population
- 2,271
- Population (ZIP)
- 2,271
Population outlook (Guadalupe County) Hauer SSP2
- Today (2025)
- 196,854 people
- By 2030
- 220,210 · +11.9%
- By 2040
- 268,004 · +36.1%
- By 2050
- 316,333 · +60.7%
- By 2075
- 434,747 · +120.8%
- By 2100
- 520,447 · +164.4%
Race, ethnicity, and origin ACS 2023
- Neighborhood character
- Diverse neighborhood (Simpson 0.59)
- Race & ethnicity
- White 55% Hispanic / Latino 32% Two or more races 22% Asian 6% Black 4%
- Hispanic origin (detail)
- Mexican 31%
- Common ancestry
- Lithuanian 5% Iranian 2% Romanian 1%
- Foreign-born
- 6% · Vietnam, Canada
- Languages at home
- 82% English-only · Spanish 11% Other Asian/Pacific 5% Vietnamese 2%
Political lean MEDSL · Guadalupe
- 2024 margin
- Strong R (+29.5) · D 34.8% · R 64.3%
- 2008→2024 swing
- +1.5pp toward D · 2008: -31.0pp · 2024: -29.5pp
- All cycles
- 2024: R+29.5 2020: R+24.2 2016: R+31.8 2012: R+35.1 2008: R+31.0
Not yet ingested
- Civics
- —
Market trends
- HPI YoY
- ▼ -0.27%
- Current HPI
- 179.3354
- Rent YoY
- —
- Metro
- —
- State GDP YoY
- ▲ 3.95%
- F500 in state
- 110
Industry mix (Fortune 500 HQ in TX)
| Industry | F500 HQs | Revenue |
|---|---|---|
| Energy | 16 | $1,198B |
|
||
| Technology | 5 | $198B |
|
||
| Engineering / Construction | 4 | $72B |
|
||
| Energy Services | 3 | $60B |
|
||
| Utilities | 3 | $41B |
|
||
| Healthcare | 2 | $330B |
|
||
Price history
-13.4% since first listed5 events — show timeline
- 2026-03-26 Price Changed $345,000 CTXMLS
- 2025-08-11 Price Changed $350,000 CTXMLS
- 2025-05-06 Price Changed $368,000 CTXMLS
- 2025-02-14 Listed $398,600 CTXMLS
- 2018-06-22 Sold (Public Records) — Public Records
Property tax history
+10.0%/yrLatest (2026): $5,438 · +95.1% YoY. Source: county tax records.
Cash-flow waterfall
monthlySold comps — $/sqft
last 12 mo · ≤1 miLoading sold comps…