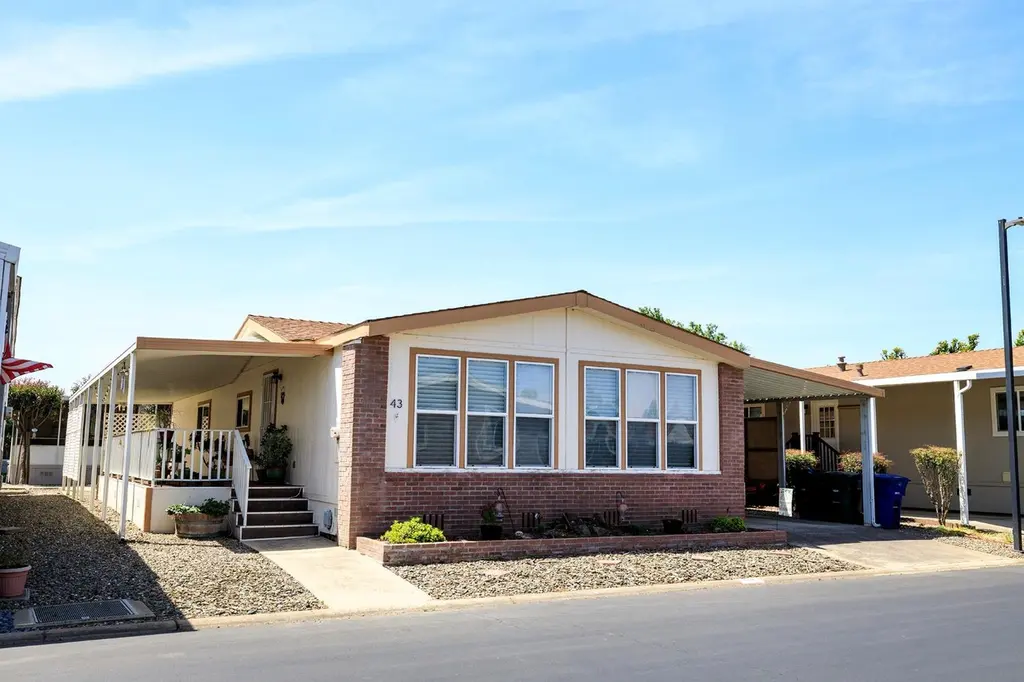
1500 Held Dr #43 · Modesto, CA
Flood risk 1/10 · Minimal
- FEMA flood zone
- X (unshaded)
- Chance of flooding over 30 yrs
- 0.0%
- Est. flood insurance / yr
- $507 – $1,088
Fire risk 7/10 · Major
- Est. fire insurance / yr
- $659 – $1,223
Heat risk 7/10 · Major
- Hot days now (above 102°F)
- 7 days/yr
- Hot days in 30 yrs
- 15 days/yr
Wind risk 1/10 · Minimal
- Chance of severe wind over 30 yrs
- —
Air-quality risk 10/10 · Severe
- Unhealthy air days now
- 36 days/yr
- Unhealthy air days in 30 yrs
- 39 days/yr
Risk factors via First Street. Map © Google.
Why this score? — see what drove the B grade
The composite is a weighted blend of 9 inputs, each scored 0–100. Each bar is that input's sub-score; the figure is the points it added to the 100-point composite (weight × sub-score).
- Cash flow +30.0/30.0
- ARV discount +10.7/15.0
- 1% rule +10.0/10.0
- DSCR +10.0/10.0
- Livability +3.2/5.0
- Rent growth +2.8/5.0
- Condition / age +2.5/5.0
- Schools +2.2/10.0
- Appreciation +0.0/10.0
$99,900
🖨 Deal sheet 📄 Offer letter ✓ Due diligence
Listing remarks
WELCOME TO 1500 HELD DR #43, Beautifully maintained, 2 bedroom, 2 bath with a spacious floor plan. Including vaulted ceilings, breakfast bar and large dining area, perfect for entertaining. Window treatments througout, and nice size laundry room. Exterior features a large front porch and storage shed. Ammenities include a pool, clubhouse and stone orchard fruit trees. 55+ gated community!
Key facts
- Large front porch
- Storage shed
- Pool
Tags
Property features AI
Finance
- HOA & community: No association; Located in a senior community; Land lease: Yes — $925
Exterior
- Parking: Covered parking (no garage)
- Utilities: Electric: Other; Public water; Public sewer
- Home design: Manufactured in park (double wide); Built in 1988; Skirted with wood; Manufactured by Skyline (Palm Springs model)
- Construction: Composition roof
- Exterior features: Porch; Shed(s)
Interior
- Kitchen: Breakfast area; Synthetic countertops; Free-standing gas range; Free-standing refrigerator; Dishwasher; Disposal
- Bedrooms: 2 bedrooms
- Flooring: Carpet; Vinyl
- Bathrooms: 2 full bathrooms; Shower stall(s)
- Heating & cooling: Central heating; Central air; Ceiling fans
- Interior features: Great room; Cathedral/vaulted living area; Porch; Storage area; Dual-pane windows with coverings; Decorative freestanding fireplace
- Laundry & utility: Washer and dryer included (inside area)
Neighborhood map
What this means for you Summary
Snapshot
- This is a 2-bed/2.0-bath manufactured listed at $100k.
Deal economics
- At list price, monthly cash flow is $1k ($13k/yr) — positive.
- The deal already cash-flows at list — no discount required.
- Meets the 1% rule at list price ($2k rent vs $100k).
- Recommended offer: $97k (3.0% below list) — sets the bar for market timing.
- Cap rate 19.0% vs local median 3.2% in Modesto — top-decile yield for the area; either an underpriced asset or a hidden risk that comps aren't pricing in. Stress-test before assuming the spread holds.
Location & tenants
- Location reads 63/100 on livability (#451 in CA) — a middle-class / working-renter tenant base. Strengths: housing A+; Watch: amenities C-, schools D+, health & safety D+.
- Empire Union Elementary (suburban): math 25% / reading 25% proficiency, ranked #398 of 517 in CA (top 77%) — low school quality limits family demand, transient renter base, plan for 1-2y turnover; 67% free/reduced lunch — lower-income household profile, screen leases tightly.
- Market conditions: Rents rising (+1.3%/yr); 222 active listings in the ZIP; 4 comparable units currently listed for rent nearby; rentals leasing fast (median 14d on market — plan ~1-2 weeks tenant-placement turnaround); solid renter incomes; 923 units permitted in Stanislaus County in 2024 (63 in 5+ unit buildings).
- This rent runs 31% of the median local income ($87k/yr) — at the standard rent-burdened threshold; future hikes will face affordability resistance.
Forward outlook
- Local home prices are declining (-3.0%/yr); year-one equity from $691 of loan paydown is wiped out by about $3k of value loss. Plan a longer hold.
- Stanislaus County population projected at +14% by 2050 — modest demand growth; plan on rents tracking national, not racing it.
- At projected returns (-3.0% appreciation + 1.3% rent growth), your $28k cash investment doubles in ~3 years — after that, you're playing with house money.
Negotiation context
- It's been on market 35 days — a 3% lower offer ($97k) is reasonable based on typical stale-listing flexibility.
Risks & watch-outs
- Climate carrying-cost: major wildfire risk; extreme-heat days projected 7→15/yr by 2055 (HVAC capex compounding) — expect insurance premiums to compound above CPI over the hold.
Questions for the listing agent
- It's been on market 35 days. Have you received any prior offers? Is the seller open to a 3% concession, seller financing, or rate buy-down credit?
- Is there a deadline driving the sale (1031 exchange, divorce, estate, relocation)? That informs how much negotiation room exists.
- Schools are D-rated, which usually means shorter tenancies and higher turnover. Who's the typical renter profile here, and what's been the actual vacancy rate?
- Crime grade is F in this area — have there been break-ins, vandalism, or insurance claims at this property in the last 3 years? What carrier currently insures it and at what premium?
- What's the average days-on-market for RENTAL listings here right now (not sales)? A rising rental-DOM trend means longer vacancies and softer asking-rent achievability than the comps imply.
- What's the recent tenant-quality profile in this submarket — average credit score on applications, eviction rate, late-payment / NSF rate, and stable-employment percentage? A property-management company in the area should have these aggregated.
- How much new for-sale + rental construction is in the pipeline within 1–3 miles? Heavy new supply typically softens prices + rents 12–24 months out; constrained supply supports both.
Investment metrics
- 1% rule
- 2.22% ✓
- Cap rate
- 19.00%
- Cash-on-cash
- 45.39%
- DSCR
- 3.02
- GRM
- 3.8
CMA / ARV
- ARV (on-the-fly)
- $107,520
- Comps found
- 12
Show comp detail 12 sales within ~0.75 mi
| Address | Dist | Beds/Ba | Sqft | Sold | Price | $/sf | Match |
|---|---|---|---|---|---|---|---|
| 1500 Held #99 | 0.09mi | 2/2.0 | 1,344 (0%) | 6mo | $107,000 | $80 | 91 |
| 1500 Held Dr #7 | 0.00mi | 3/2.0 (+1) | 1,344 (0%) | 11mo | $80,000 | $60 | 86 |
| 1500 Held Dr #81 | 0.00mi | 3/2.0 (+1) | 1,323 (-2%) | 8mo | $50,000 | $38 | 86 |
| 1428 Playground Way | 0.16mi | 3/2.0 (+1) | 1,344 (0%) | 3mo | $160,000 | $119 | 85 |
| 1544 Playground Way | 0.09mi | 3/2.0 (+1) | 1,344 (0%) | 9mo | $140,000 | $104 | 83 |
| 1500 Held Dr #119 | 0.00mi | 3/2.0 (+1) | 1,440 (+7%) | 1mo | $87,000 | $60 | 82 |
| 1500 Held Dr #135 | 0.09mi | 2/2.0 | 1,248 (-7%) | 8mo | $100,000 | $80 | 78 |
| 1500 Held | 0.00mi | 2/2.0 | 1,529 (+14%) | 3mo | $95,000 | $62 | 74 |
| 1500 Held Dr #84 | 0.09mi | 2/2.0 | 1,529 (+14%) | 3mo | $95,000 | $62 | 70 |
| 1517 Panthers Ln | 0.16mi | 3/2.0 (+1) | 1,248 (-7%) | 11mo | $111,000 | $89 | 66 |
| 1500 Held Dr #124 | 0.00mi | 3/2.0 (+1) | 1,152 (-14%) | 11mo | $84,900 | $74 | 62 |
| 4400 Spartans Ln | 0.18mi | 3/2.0 (+1) | 1,152 (-14%) | 6mo | $111,800 | $97 | 57 |
Match score weights: distance 35% · size 25% · config 20% · recency 20%. Top-matched comps best support the ARV.
Projected returns pro-forma
-3.0% appreciation · 1.28% rent growth · sell at horizon
- IRR
- 40.6%
- Equity multiple
- 2.70×
- Total profit
- $47,466
- Equity at exit
- $14,895
- IRR
- 46.0%
- Equity multiple
- 5.05×
- Total profit
- $113,311
- Equity at exit
- $8,638
Cash invested: $27,972 (down + closing). Projections, not guarantees.
Landlord ↔ Tenant lean methodology
- Overall (STATE)
- 18 Strongly Tenant-Friendly
- State California
- 18 Strongly Tenant-Friendly · D+13
- County
- — inherits STATE
- City
- — inherits STATE
ZIP-level market 95355
- Rents YoY
- 1.3%
- Active inventory
- 222
- Price-to-rent
- 3.8×
Monthly cashflow live
- Estimated rent
- $2,213 medium interval (Pro) →
- Mortgage (P&I)
- −$524
- Tax est. 1.5%
- −$125 /mo · $1,498/yr
- Insurance
- −$42
- HOA
- −$0
- Vacancy / Maint / Mgmt
- −$465
- Net cashflow
- $1,058
Break-even live
UW: 25.0% down · 7.5% · 30yr · 1.5% tax · 5.0% vac · 8.0% maint · 8.0% mgmt
Financing live
Cash to close
- Down payment
- $24,975
- Closing costs
- $2,997
- Reserves months
- —
- Total cash needed
- —
Loan-product check · same deal, 3 products live
Conventional
25% down · 7.5% · 30yr
- Down + closing
- —
- Monthly P&I
- —
- Monthly cashflow
- —
- DSCR
- —
- Eligible?
- —
Personal DTI + credit; lowest rate.
DSCR
20% down · 8.5% · 30yr
- Down + closing
- —
- Monthly P&I
- —
- Monthly cashflow
- —
- DSCR
- —
- Eligible?
- —
No personal income docs; deal must DSCR.
Hard money
10% down · 12.0% · 12mo
- Down + closing
- —
- Monthly P&I
- —
- Monthly cashflow
- —
- DSCR
- —
- Eligible?
- —
Short-term bridge; refi at stabilization.
Rent comps 4 comps
| Address | Beds | Baths | Sqft | Rent | $/sqft | DOM | Units | Dist |
|---|---|---|---|---|---|---|---|---|
| 1108 Cedar Creek Dr #1 Modesto, CA | 2.0 | 2.0 | 1064 | $1,999 | $1.88 | 13d | 1 | 0.91mi |
| 757 Waddell Way Modesto, CA | 3.0 | 2.0 | 1755 | $2,700 | $1.54 | 13d | 1 | 1.31mi |
| 1217 Kara Ln Modesto, CA | 3.0 | 2.0 | 1559 | $2,395 | $1.54 | 23d | 1 | 1.35mi |
| 1500 Lakewood Ave Modesto, CA | 1.0–2.0 | 1.0–2.0 | 820 | $1,900 | $2.32 | 13d | 7 | 1.43mi |
Listing history 15 events
-
2026-06-18days on market $99,900 Active 35 DOM
-
2026-06-17days on market $99,900 Active 34 DOM
-
2026-06-16days on market $99,900 Active 33 DOM
-
2026-06-15days on market $99,900 Active 32 DOM
-
2026-06-14days on market $99,900 Active 30 DOM
-
2026-06-10days on market $99,900 Active 27 DOM
-
2026-06-09days on market $99,900 Active 26 DOM
-
2026-06-08days on market $99,900 Active 25 DOM
-
2026-06-07days on market $99,900 Active 24 DOM
-
2026-06-05days on market $99,900 Active 21 DOM
-
2026-06-03days on market $99,900 Active 20 DOM
-
2026-06-02days on market $99,900 Active 19 DOM
-
2026-06-01days on market $99,900 Active 18 DOM
-
2026-05-31days on market $99,900 Active 17 DOM
-
2026-05-30days on market $99,900 Active 16 DOM
ⓘ Source: listings_history table (triggers on properties + properties_extension) + one-shot
backfill from property_details.listing_events for pre-trigger history.
Climate risk First Street
- Flood 1/10 Low FEMA zone X (unshaded) · 0% chance over 30 yrs
- Wildfire 7/10 Severe
- Heat 7/10 Severe 7 d/yr ≥102°F today · 15 d/yr by 30 yrs out
- Wind 1/10 Low
- Air quality 10/10 Extreme 36 unhealthy d/yr today · 39 by 30 yrs out
Nearby sold comps map
Loading sold comps map…
Walkable amenities ~0.75 mi
Loading nearby amenities…
Taxation est. · year 1
- Rental income
- $26,558
- − Mortgage interest
- −$5,596
- − Property taxes
- −$1,498
- − Insurance
- −$500
- − Repairs & maintenance
- −$2,125
- − Management
- −$2,125
- − Depreciation
- −$2,906
- Taxable income
- $11,809
- Est. tax owed @ 24.0%
- −$2,834
- After-tax cash flow
- $9,862/yr
For passive investors: Depreciation is non-cash, so a rental often shows a tax loss while cash-flowing — sheltering income. Rental losses are passive: they offset passive income freely, and up to $25,000/yr can offset ordinary (W-2) income if you actively participate and your MAGI is under $100k (phasing out to $0 by $150k); unused losses carry forward. On sale, claimed depreciation is recaptured at up to 25%, and gains may owe capital-gains tax (a 1031 exchange can defer both). Figures are a year-1 estimate at your 24.0% rate — not tax advice; consult a CPA.
Schools (NCES district)
- District
- Empire Union Elementary
- NCES district ID
- 0612690
- Math proficiency
- 25% ▼ -6.00%
- Reading proficiency
- 25% ▼ -14.00%
- Median HH income
- $49,808
- Composite
- 22.05/100
- National rank
- #8193
- State rank
- #398 of 517 in CA
Livability — Modesto
- Score
- 63/100
- State rank
- #451
- US rank
- #15229
Category grades
Schools grade is shown separately in the Schools card above.
Census & demographics
- Census place
- Modesto, CA
- County
- Stanislaus County · 445,786 people
- City population
- 225,261
- Metro
- Modesto, CA
- Population (ZIP)
- 60,710
- Household income
- $86,849
- Rent vs Own
- Severe rent burden
- 2521.0
Population outlook (Stanislaus County) Hauer SSP2
- Today (2025)
- 579,493 people
- By 2030
- 598,000 · +3.2%
- By 2040
- 630,930 · +8.9%
- By 2050
- 658,300 · +13.6%
- By 2075
- 712,363 · +22.9%
- By 2100
- 719,805 · +24.2%
Race, ethnicity, and origin ACS 2023
- Neighborhood character
- Diverse neighborhood (Simpson 0.66)
- Race & ethnicity
- White 48% Hispanic / Latino 33% Two or more races 18% Asian 8% Black 4% Native American 1%
- Hispanic origin (detail)
- Mexican 29% Puerto Rican 2%
- Common ancestry
- Russian 3% Italian 3% Lithuanian 2%
- Foreign-born
- 15% · Canada, China, Vietnam
- Languages at home
- 73% English-only · Spanish 16% Other Indo-European 4% Tagalog/Filipino 1%
Political lean MEDSL · Stanislaus
- 2024 margin
- R (+11.0) · D 43.2% · R 54.2% · Other 2.6%
- 2008→2024 swing
- -12.7pp toward R · 2008: 1.7pp · 2024: -11.0pp
- All cycles
- 2024: R+11.0 2020: D+0.8 2016: D+0.6 2012: D+0.7 2008: D+1.7
Not yet ingested
- Civics
- —
Market trends
- HPI YoY
- ▼ -458.02%
- Current HPI
- 277.8565
- Rent YoY
- ▲ 1.28%
- Metro
- Modesto, CA
- State GDP YoY
- ▲ 3.21%
- F500 in state
- 116
Industry mix (Fortune 500 HQ in CA)
| Industry | F500 HQs | Revenue |
|---|---|---|
| Technology | 27 | $1,492B |
|
||
| Financial Services | 3 | $174B |
|
||
| Retail | 3 | $44B |
|
||
| Insurance | 3 | $26B |
|
||
| Media / Entertainment | 2 | $115B |
|
||
| Pharmaceuticals / Biotech | 2 | $62B |
|
||
Cash-flow waterfall
monthlySold comps — $/sqft
last 12 mo · ≤1 miLoading sold comps…