3 Malone Hill Rd · Malone, WA
Flood risk 5/10 · Moderate
- FEMA flood zone
- X (unshaded)
- Chance of flooding over 30 yrs
- 0.24%
- Est. flood insurance / yr
- $507 – $1,088
Fire risk 1/10 · Minimal
- Est. fire insurance / yr
- $604 – $1,122
Heat risk 2/10 · Minimal
- Hot days now (above 88°F)
- 7 days/yr
- Hot days in 30 yrs
- 14 days/yr
Wind risk 1/10 · Minimal
- Chance of severe wind over 30 yrs
- —
Air-quality risk 6/10 · Moderate
- Unhealthy air days now
- 8 days/yr
- Unhealthy air days in 30 yrs
- 8 days/yr
Risk factors via First Street. Map © Google.
Why this score? — see what drove the B- grade
The composite is a weighted blend of 9 inputs, each scored 0–100. Each bar is that input's sub-score; the figure is the points it added to the 100-point composite (weight × sub-score).
- Cash flow +30.0/30.0
- 1% rule +10.0/10.0
- DSCR +10.0/10.0
- ARV discount +7.5/15.0
- Schools +4.5/10.0
- Livability +2.9/5.0
- Rent growth +2.5/5.0
- Condition / age +2.5/5.0
- Appreciation +0.0/10.0
$121,000
🖨 Deal sheet 📄 Offer letter ✓ Due diligence
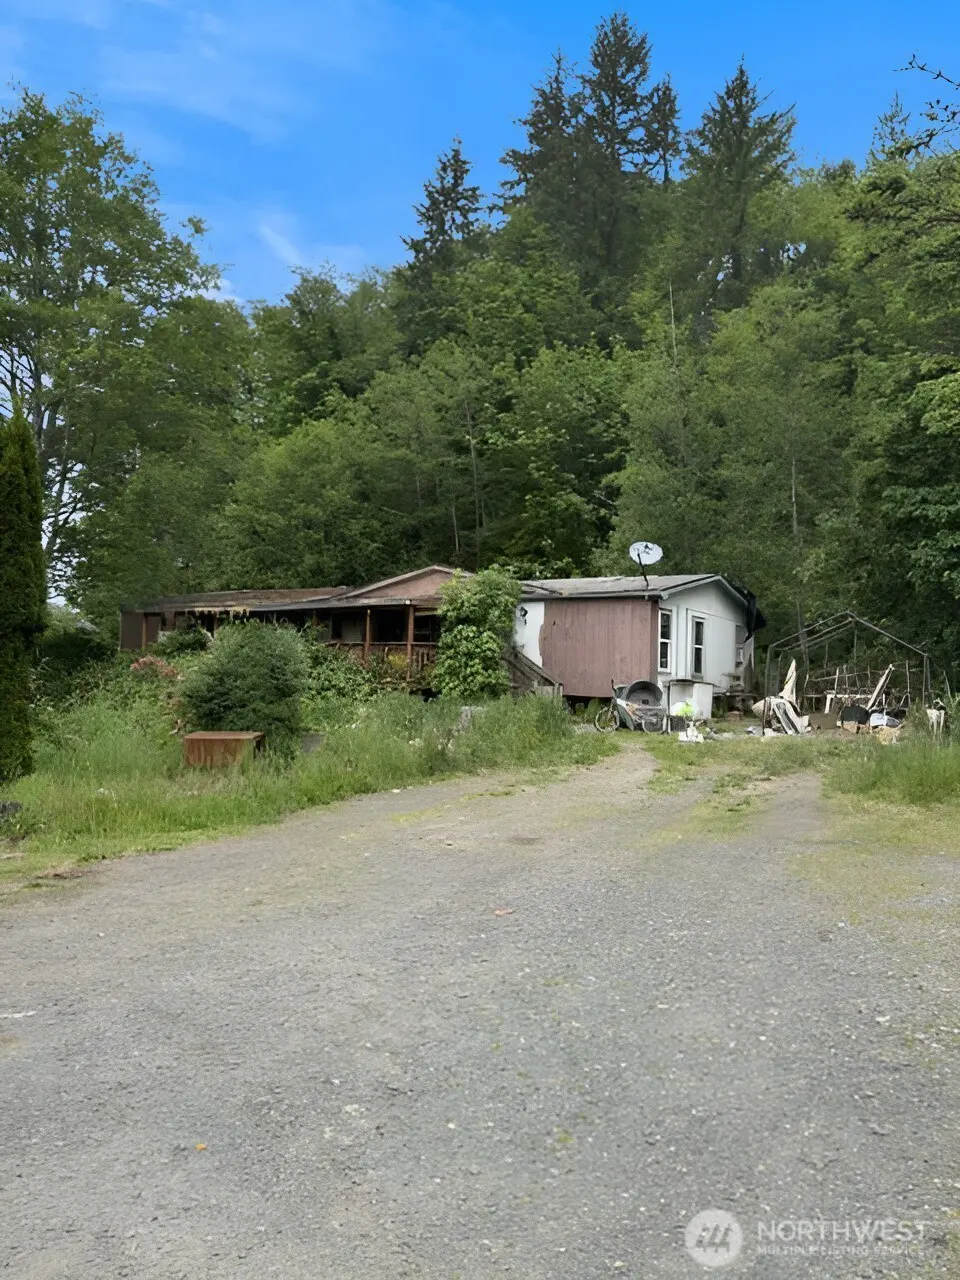
Listing remarks
Elma Malone Area. 4 Bedroom 2 Bath Manufactured Home on 2.96 acres approximately. Poor condition with major deferred maintenance. Being sold strictly "AS IS". Must sign hold harmless agreement before entry can be approved. Recommend to wear safety masks over face for protection. Flooring is weak in areas especially in kitchen area.
Key facts
- 2.96 acre lot
- Built 1990
- Listed 7 days
Property features AI
Finance
- Other: Lot size approximately 2.96 acres
- Financial info: Listing terms: Cash
Exterior
- Parking: No designated parking listed
- Utilities: Electric energy; Community water (Malone Community); Septic sewer
- Home design: Manufactured double-wide home; Single-story with main-level entry; Main entry on the main level; Facing direction not specified
- Construction: Wood construction; Composition roof; Pillar/post/pier foundation; Manufactured house structure; Built as a double wide manufactured home
- Exterior features: Wood exterior products; Property offers a view; Value in land
Interior
- Bedrooms: Four bedrooms (all on the main level)
- Flooring: Vinyl flooring; Carpeted areas
- Bathrooms: Two full bathrooms (one on the main level)
- Heating & cooling: Forced air heating; No central cooling
- Interior features: Vinyl and carpet flooring; Partial slope topography (on property)
Neighborhood map
What this means for you Summary
Snapshot
- This is a 4-bed/2.0-bath manufactured listed at $121k.
Deal economics
- At list price, monthly cash flow is $606 ($7k/yr) — positive.
- The deal already cash-flows at list — no discount required.
- Meets the 1% rule at list price ($2k rent vs $121k).
Location & tenants
- Location reads 58/100 on livability (#516 in WA) — a working-class tenant base; expect higher turnover. Strengths: employment A+, housing A+; Watch: health & safety C-, crime D, cost of living D.
- Elma School District (town): math 45% / reading 56% proficiency, ranked #146 of 291 in WA (top 50%) — acceptable for families but not a draw, mixed tenant base, ~2y average lease.
- Zoned schools: Elma Elementary School (707 students, 77% FRL); Elma High School (542 students, 76% FRL) — zoned schools average 77% FRL vs 52% district-wide (25 pts higher); higher-poverty schools than district average — tighter screening recommended.
- Market conditions: 103 active listings in the ZIP; 297 units permitted in Grays Harbor County in 2024 (17 in 5+ unit buildings).
Forward outlook
- Local home prices are declining (-3.0%/yr); year-one equity from $837 of loan paydown is wiped out by about $4k of value loss. Plan a longer hold.
- Grays Harbor County population projected at -24% by 2050 — secular population decline; favor cash flow + early exit over multi-decade hold.
- At projected returns (-3.0% appreciation + 3.0% rent growth), your $34k cash investment doubles in ~6 years — after that, you're playing with house money.
Negotiation context
- Only 7 days on market — expect competitive offers; lowballing is unlikely to land.
- Current owner paid $99k; 22% above their basis — modest negotiation headroom, anchor on the comps not their cost.
Risks & watch-outs
- Climate carrying-cost: moderate flood risk — expect insurance premiums to compound above CPI over the hold.
Questions for the listing agent
- Is there a deadline driving the sale (1031 exchange, divorce, estate, relocation)? That informs how much negotiation room exists.
- Schools are F-rated, which usually means shorter tenancies and higher turnover. Who's the typical renter profile here, and what's been the actual vacancy rate?
- Crime grade is D in this area — have there been break-ins, vandalism, or insurance claims at this property in the last 3 years? What carrier currently insures it and at what premium?
- What's the average days-on-market for RENTAL listings here right now (not sales)? A rising rental-DOM trend means longer vacancies and softer asking-rent achievability than the comps imply.
- What's the recent tenant-quality profile in this submarket — average credit score on applications, eviction rate, late-payment / NSF rate, and stable-employment percentage? A property-management company in the area should have these aggregated.
- How much new for-sale + rental construction is in the pipeline within 1–3 miles? Heavy new supply typically softens prices + rents 12–24 months out; constrained supply supports both.
Investment metrics
- 1% rule
- 1.53% ✓
- Cap rate
- 12.31%
- Cash-on-cash
- 21.47%
- DSCR
- 1.96
- GRM
- 5.4
CMA / ARV
- ARV (on-the-fly)
- $526,680
- Comps found
- 1
Show comp detail 1 sale within ~0.75 mi
| Address | Dist | Beds/Ba | Sqft | Sold | Price | $/sf | Match |
|---|---|---|---|---|---|---|---|
| 49 Mox Chehalis Rd | 0.24mi | 4/2.0 | 1,662 (-10%) | 9mo | $474,000 | $285 | 64 |
Match score weights: distance 35% · size 25% · config 20% · recency 20%. Top-matched comps best support the ARV.
Projected returns pro-forma
-3.0% appreciation · 3.0% rent growth · sell at horizon
- IRR
- 14.1%
- Equity multiple
- 1.56×
- Total profit
- $19,047
- Equity at exit
- $18,041
- IRR
- 22.9%
- Equity multiple
- 2.96×
- Total profit
- $66,472
- Equity at exit
- $10,462
Cash invested: $33,880 (down + closing). Projections, not guarantees.
Landlord ↔ Tenant lean methodology
- Overall (STATE)
- 28 Tenant-Leaning
- State Washington
- 28 Tenant-Leaning · D+8
- County
- — inherits STATE
- City
- — inherits STATE
ZIP-level market 98541
- Active inventory
- 103
- Price-to-rent
- 5.4×
Monthly cashflow live
- Estimated rent
- $1,853 medium interval (Pro) →
- Mortgage (P&I)
- −$635
- Tax from tax record
- −$172 /mo · $2,069/yr
- Insurance
- −$50
- HOA
- −$0
- Vacancy / Maint / Mgmt
- −$389
- Net cashflow
- $606
Break-even live
UW: 25.0% down · 7.5% · 30yr · 1.5% tax · 5.0% vac · 8.0% maint · 8.0% mgmt
Financing live
Cash to close
- Down payment
- $30,250
- Closing costs
- $3,630
- Reserves months
- —
- Total cash needed
- —
Loan-product check · same deal, 3 products live
Conventional
25% down · 7.5% · 30yr
- Down + closing
- —
- Monthly P&I
- —
- Monthly cashflow
- —
- DSCR
- —
- Eligible?
- —
Personal DTI + credit; lowest rate.
DSCR
20% down · 8.5% · 30yr
- Down + closing
- —
- Monthly P&I
- —
- Monthly cashflow
- —
- DSCR
- —
- Eligible?
- —
No personal income docs; deal must DSCR.
Hard money
10% down · 12.0% · 12mo
- Down + closing
- —
- Monthly P&I
- —
- Monthly cashflow
- —
- DSCR
- —
- Eligible?
- —
Short-term bridge; refi at stabilization.
Listing history 7 events
-
2026-06-17status $121,000 Pending 7 DOM
-
2026-06-16days on market $121,000 Active 7 DOM
-
2026-06-15days on market $121,000 Active 6 DOM
-
2026-06-15days on market $121,000 Active 5 DOM
-
2026-06-13days on market $121,000 Active 4 DOM
-
2026-06-12remarks 333-char remark
-
2026-06-12$121,000 Active 3 DOM
ⓘ Source: listings_history table (triggers on properties + properties_extension) + one-shot
backfill from property_details.listing_events for pre-trigger history.
Tax reassessment forecast WA · Resets to sale price
- Current annual tax
- $2,069 · $172/mo
- Projected year-2 tax
- $2,069 · $172/mo
- Expected delta
- $0/yr ($0/mo · 0.0%)
ⓘ Screening estimate from a state-policy table — verify with the county assessor before closing.
Climate risk First Street
- Flood 5/10 Major FEMA zone X (unshaded) · 24% chance over 30 yrs
- Wildfire 1/10 Low
- Heat 2/10 Low 7 d/yr ≥88°F today · 14 d/yr by 30 yrs out
- Wind 1/10 Low
- Air quality 6/10 Major 8 unhealthy d/yr today · 8 by 30 yrs out
Nearby sold comps map
Loading sold comps map…
Walkable amenities ~0.75 mi
Loading nearby amenities…
Taxation est. · year 1
- Rental income
- $22,233
- − Mortgage interest
- −$6,778
- − Property taxes
- −$2,069
- − Insurance
- −$605
- − Repairs & maintenance
- −$1,779
- − Management
- −$1,779
- − Depreciation
- −$3,520
- Taxable income
- $5,703
- Est. tax owed @ 24.0%
- −$1,369
- After-tax cash flow
- $5,906/yr
For passive investors: Depreciation is non-cash, so a rental often shows a tax loss while cash-flowing — sheltering income. Rental losses are passive: they offset passive income freely, and up to $25,000/yr can offset ordinary (W-2) income if you actively participate and your MAGI is under $100k (phasing out to $0 by $150k); unused losses carry forward. On sale, claimed depreciation is recaptured at up to 25%, and gains may owe capital-gains tax (a 1031 exchange can defer both). Figures are a year-1 estimate at your 24.0% rate — not tax advice; consult a CPA.
Schools (NCES district)
- District
- Elma School District
- NCES district ID
- 5302490
- Math proficiency
- 45% ▲ 5.00%
- Reading proficiency
- 56% ▲ 5.00%
- Median HH income
- $45,658
- Composite
- 44.76/100
- National rank
- #5959
- State rank
- #146 of 291 in WA
Livability — Malone
- Score
- 58/100
- State rank
- #516
- US rank
- #21266
Category grades
Schools grade is shown separately in the Schools card above.
Census & demographics
- Census place
- Malone, WA
- Population (ZIP)
- 10,285
Population outlook (Grays Harbor County) Hauer SSP2
- Today (2025)
- 66,443 people
- By 2030
- 63,255 · -4.8%
- By 2040
- 56,466 · -15.0%
- By 2050
- 50,516 · -24.0%
- By 2075
- 39,296 · -40.9%
- By 2100
- 31,142 · -53.1%
Race, ethnicity, and origin ACS 2023
- Neighborhood character
- Predominantly White (80%)
- Race & ethnicity
- White 80% Hispanic / Latino 13% Two or more races 9% Native American 2%
- Hispanic origin (detail)
- Mexican 12%
- Common ancestry
- Portuguese 6% Slovak 3% Scotch-Irish 2%
- Foreign-born
- 6% · Canada, Jamaica
- Languages at home
- 87% English-only · Spanish 11% Korean 1%
Political lean MEDSL · Grays Harbor
- 2024 margin
- Lean R (+6.0) · D 45.6% · R 51.6% · Other 2.8%
- 2008→2024 swing
- -20.6pp toward R · 2008: 14.6pp · 2024: -6.0pp
- All cycles
- 2024: R+6.0 2020: R+6.6 2016: R+7.1 2012: D+14.0 2008: D+14.6
Not yet ingested
- Civics
- —
Market trends
- HPI YoY
- ▼ -174.43%
- Current HPI
- 199.9988
- Rent YoY
- —
- Metro
- —
- State GDP YoY
- ▲ 4.65%
- F500 in state
- 22
Industry mix (Fortune 500 HQ in WA)
| Industry | F500 HQs | Revenue |
|---|---|---|
| Retail | 2 | $269B |
|
||
| Technology / Retail | 1 | $638B |
|
||
| Technology | 1 | $245B |
|
||
| Telecommunications | 1 | $38B |
|
||
| Food / Beverage | 1 | $36B |
|
||
| Automotive / Trucks | 1 | $34B |
|
||
Price history
+22.1% since first listed2 events — show timeline
- 2026-06-09 Listed $121,000 NWMLS as Distributed by MLS Grid
- 2025-01-28 Sold (Public Records) $99,133 Public Records
Property tax history
+18.9%/yrLatest (2026): $2,069 · +8.4% YoY. Source: county tax records.
Cash-flow waterfall
monthlySold comps — $/sqft
last 12 mo · ≤1 miLoading sold comps…