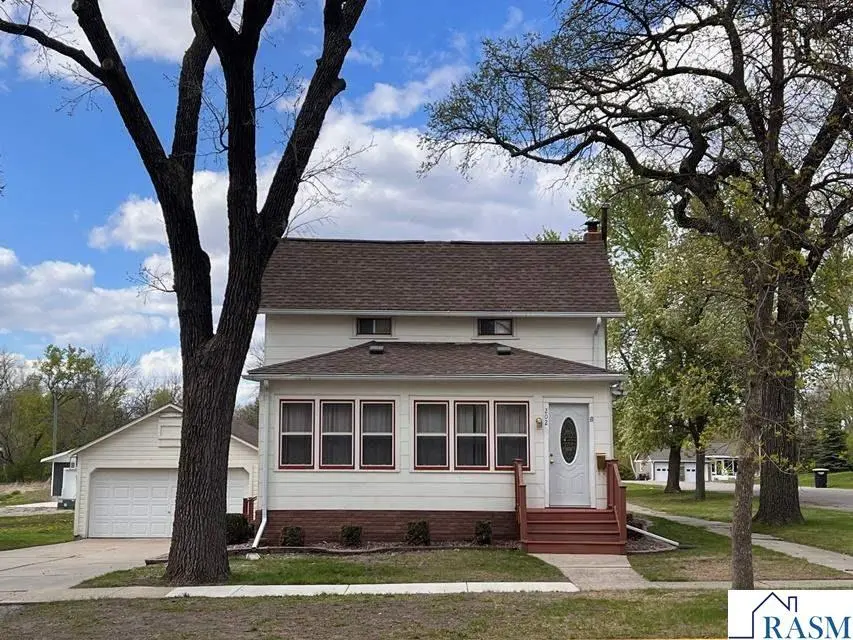
202 W 1st St · Blue Earth, MN
Flood risk 1/10 · Minimal
- FEMA flood zone
- X
- Chance of flooding over 30 yrs
- 0.0%
- Est. flood insurance / yr
- $473 – $860
Fire risk 2/10 · Minimal
- Est. fire insurance / yr
- $888 – $1,650
Heat risk 2/10 · Minimal
- Hot days now (above 99°F)
- 7 days/yr
- Hot days in 30 yrs
- 15 days/yr
Wind risk 2/10 · Minimal
- Chance of severe wind over 30 yrs
- —
Air-quality risk 1/10 · Minimal
- Unhealthy air days now
- 0 days/yr
- Unhealthy air days in 30 yrs
- 0 days/yr
Risk factors via First Street. Map © Google.
Why this score? — see what drove the B grade
The composite is a weighted blend of 9 inputs, each scored 0–100. Each bar is that input's sub-score; the figure is the points it added to the 100-point composite (weight × sub-score).
- Cash flow +25.5/30.0
- ARV discount +12.0/15.0
- Appreciation +10.0/10.0
- DSCR +8.4/10.0
- 1% rule +5.9/10.0
- Livability +3.7/5.0
- Schools +3.1/10.0
- Rent growth +2.5/5.0
- Condition / age +2.5/5.0
$109,900
🖨 Deal sheet (PDF) 📄 Offer letter ✓ Due diligence
Key facts
- 8,712 sq ft lot
- 2 garage spots
- Built 1900
Property features AI
Exterior
- Parking: 2-car garage; Garage door opener
- Utilities: Public water; Public sewer
- Home design: Single-family residence; Residential property
- Construction: Basement (full, partially finished)
- Exterior features: Asphalt roof; Corner lot
Interior
- Kitchen: Dishwasher; Cooktop; Range; Refrigerator; Kitchen island; Breakfast bar
- Bathrooms: 1 full bathroom; 1 three-quarter bathroom
- Heating & cooling: Natural gas forced-air heating; Central air conditioning
- Interior features: Kitchen island; Breakfast bar; Window coverings; Partially finished full basement with sump pump
- Laundry & utility: Washer; Dryer; Electric water heater; Water softener
Neighborhood map
What this means for you Summary
Snapshot
- This is a 3-bed/1.0-bath single-family listed at $110k.
Deal economics
- At list price, monthly cash flow is $256 ($3k/yr) — positive.
- The deal already cash-flows at list — no discount required.
- Meets the 1% rule at list price ($1k rent vs $110k).
- Recommended offer: $107k (3.0% below list) — sets the bar for market timing.
Location & tenants
- Location reads 73/100 on livability (#259 in MN) — a middle-class / working-renter tenant base. Strengths: cost of living A+, housing A+, health & safety A+; Watch: employment C-, amenities F, commute F.
- Blue Earth Area Public School (town): math 29% / reading 44% proficiency, ranked #245 of 301 in MN (top 81%) — families likely to look elsewhere, expect single-tenant / working-renter base with shorter leases.
- Market conditions: 36 active listings in the ZIP; 4 units permitted in Faribault County in 2024 (0 in 5+ unit buildings).
Forward outlook
- In year one you build about $12k of equity ($760 loan paydown + $11k appreciation (10.0% local appreciation)).
- Faribault County population projected at -11% by 2050 — secular population decline; favor cash flow + early exit over multi-decade hold.
- At projected returns (10.0% appreciation + 3.0% rent growth), your $31k cash investment doubles in ~2 years — after that, you're playing with house money.
- By year 4, paydown + projected appreciation supports a ~$42k cash-out refi (75% LTV) — recoverable capital for the next deal without selling this one.
Negotiation context
- It's been on market 39 days — a 3% lower offer ($107k) is reasonable based on typical stale-listing flexibility.
- 2 sale attempts with the ask held roughly flat each time — persistent listings suggest the price (not the market) is what's stuck; bring a comps-based counter.
Risks & watch-outs
- Watch-outs: built in 1900 — expect roof / HVAC / electrical / plumbing capex.
Questions for the listing agent
- It's been on market 39 days. Have you received any prior offers? Is the seller open to a 3% concession, seller financing, or rate buy-down credit?
- Built in 1900 — when were the roof, HVAC, electrical panel, plumbing, and water heater last replaced?
- Is there a deadline driving the sale (1031 exchange, divorce, estate, relocation)? That informs how much negotiation room exists.
- What's the average days-on-market for RENTAL listings here right now (not sales)? A rising rental-DOM trend means longer vacancies and softer asking-rent achievability than the comps imply.
- What's the recent tenant-quality profile in this submarket — average credit score on applications, eviction rate, late-payment / NSF rate, and stable-employment percentage? A property-management company in the area should have these aggregated.
- How much new for-sale + rental construction is in the pipeline within 1–3 miles? Heavy new supply typically softens prices + rents 12–24 months out; constrained supply supports both.
Investment metrics
- 1% rule
- 1.09% ✓
- Cap rate
- 9.09%
- Cash-on-cash
- 9.98%
- DSCR
- 1.44
- GRM
- 7.6
CMA / ARV
- ARV (on-the-fly)
- $122,175
- Comps found
- 7
Show comp detail 7 sales within ~0.75 mi
| Address | Dist | Beds/Ba | Sqft | Sold | Price | $/sf | Match |
|---|---|---|---|---|---|---|---|
| 419 N Linton St | 0.14mi | 3/3.0 | 1,553 (-5%) | 21mo | $125,000 | $80 | 60 |
| 304 W 6th St | 0.36mi | 3/1.0 | 1,712 (+5%) | 20mo | $70,000 | $41 | 58 |
| 729 E 3rd St | 0.60mi | 3/1.5 | 1,736 (+7%) | 2mo | $130,000 | $75 | 58 |
| 803 E 6th St | 0.70mi | 3/1.5 | 1,548 (-5%) | 4mo | $74,900 | $48 | 53 |
| 306 E 7th St | 0.53mi | 3/2.0 | 1,580 (-3%) | 17mo | $215,000 | $136 | 52 |
| 309 N Nicollet St | 0.21mi | 3/3.0 | 1,781 (+9%) | 22mo | $121,000 | $68 | 48 |
| 115 E 10th St | 0.66mi | 3/2.0 | 1,736 (+7%) | 20mo | $220,000 | $127 | 38 |
Match score weights: distance 35% · size 25% · config 20% · recency 20%. Top-matched comps best support the ARV.
Projected returns pro-forma
10.0% appreciation · 3.0% rent growth · sell at horizon
- IRR
- 31.6%
- Equity multiple
- 3.47×
- Total profit
- $76,130
- Equity at exit
- $99,007
- IRR
- 27.3%
- Equity multiple
- 7.87×
- Total profit
- $211,328
- Equity at exit
- $213,512
Cash invested: $30,772 (down + closing). Projections, not guarantees.
Landlord ↔ Tenant lean methodology
- Overall (STATE)
- 46 Balanced
- State Minnesota
- 46 Balanced · D+2
- County
- — inherits STATE
- City
- — inherits STATE
ZIP-level market 56013
- Home prices YoY
- 6.7%
- Active inventory
- 36
- Price-to-rent
- 7.6×
Monthly cashflow live
- Estimated rent
- $1,201 medium interval (Pro) →
- Mortgage (P&I)
- −$576
- Tax from tax record
- −$71 /mo · $854/yr
- Insurance
- −$46
- HOA
- −$0
- Vacancy / Maint / Mgmt
- −$252
- Net cashflow
- $256
Break-even live
Sensitivity live
| Price | -10% $318 | -5% $287 | +0% $256 | +5% $225 | +10% $194 |
|---|---|---|---|---|---|
| Rent | -10% $161 | -5% $208 | +0% $256 | +5% $303 | +10% $351 |
| Rate | -1.0pp $311 | -0.5pp $284 | base $256 | +0.5pp $227 | +1.0pp $198 |
UW: 25.0% down · 7.5% · 30yr · 1.5% tax · 5.0% vac · 8.0% maint · 8.0% mgmt
Financing live
Cash to close
- Down payment
- $27,475
- Closing costs
- $3,297
- Reserves months
- —
- Total cash needed
- —
Loan-product check · same deal, 3 products live
Conventional
25% down · 7.5% · 30yr
- Down + closing
- —
- Monthly P&I
- —
- Monthly cashflow
- —
- DSCR
- —
- Eligible?
- —
Personal DTI + credit; lowest rate.
DSCR
20% down · 8.5% · 30yr
- Down + closing
- —
- Monthly P&I
- —
- Monthly cashflow
- —
- DSCR
- —
- Eligible?
- —
No personal income docs; deal must DSCR.
Hard money
10% down · 12.0% · 12mo
- Down + closing
- —
- Monthly P&I
- —
- Monthly cashflow
- —
- DSCR
- —
- Eligible?
- —
Short-term bridge; refi at stabilization.
Listing history 14 events
-
2026-06-12statusdays on market $109,900 Pending 39 DOM
-
2026-06-09days on market $109,900 Active Under Contract 38 DOM
-
2026-06-08days on market $109,900 Active Under Contract 37 DOM
-
2026-06-07days on market $109,900 Active Under Contract 36 DOM
-
2026-06-05days on market $109,900 Active Under Contract 34 DOM
-
2026-06-04days on market $109,900 Active Under Contract 32 DOM
-
2026-06-02days on market $109,900 Active Under Contract 31 DOM
-
2026-06-01days on market $109,900 Active Under Contract 30 DOM
-
2026-05-31days on market $109,900 Active Under Contract 29 DOM
-
2026-05-31days on market $109,900 Active Under Contract 28 DOM
-
2026-05-24historical Active Under Contract
-
2026-05-18status Active
-
2026-05-08historical Active Under Contract
-
2026-05-01$109,900 Active
ⓘ Source: listings_history table (triggers on properties + properties_extension) + one-shot
backfill from property_details.listing_events for pre-trigger history.
Tax reassessment forecast MN · Partial reset (capped growth)
- Current annual tax
- $854 · $71/mo
- Projected year-2 tax
- $1,042 · $87/mo
- Expected delta
- +$188/yr (+$16/mo · 22.1%)
ⓘ Screening estimate from a state-policy table — verify with the county assessor before closing.
Climate risk First Street
- Flood 1/10 Low FEMA zone X · 0% chance over 30 yrs
- Wildfire 2/10 Low
- Heat 2/10 Low 7 d/yr ≥99°F today · 15 d/yr by 30 yrs out
- Wind 2/10 Low
- Air quality 1/10 Low 0 unhealthy d/yr today · 0 by 30 yrs out
Nearby sold comps map
Loading sold comps map…
Walkable amenities ~0.75 mi
Loading nearby amenities…
Taxation est. · year 1
- Rental income
- $14,418
- − Mortgage interest
- −$6,156
- − Property taxes
- −$854
- − Insurance
- −$550
- − Repairs & maintenance
- −$1,153
- − Management
- −$1,153
- − Depreciation
- −$3,197
- Taxable income
- $1,354
- Est. tax owed @ 24.0%
- −$325
- After-tax cash flow
- $2,746/yr
For passive investors: Depreciation is non-cash, so a rental often shows a tax loss while cash-flowing — sheltering income. Rental losses are passive: they offset passive income freely, and up to $25,000/yr can offset ordinary (W-2) income if you actively participate and your MAGI is under $100k (phasing out to $0 by $150k); unused losses carry forward. On sale, claimed depreciation is recaptured at up to 25%, and gains may owe capital-gains tax (a 1031 exchange can defer both). Figures are a year-1 estimate at your 24.0% rate — not tax advice; consult a CPA.
Schools (NCES district)
- District
- Blue Earth Area Public School
- NCES district ID
- 2700130
- Math proficiency
- 29% ▼ -19.00%
- Reading proficiency
- 44% ▼ -10.00%
- Median HH income
- $44,434
- Composite
- 31.0/100
- National rank
- #6095
- State rank
- #245 of 301 in MN
Livability — Blue Earth
- Score
- 73/100
- State rank
- #259
- US rank
- #5617
Category grades
Schools grade is shown separately in the Schools card above.
Census & demographics
- Census place
- Blue Earth, MN
- Population (ZIP)
- 4,534
Population outlook (Faribault County) Hauer SSP2
- Today (2025)
- 13,474 people
- By 2030
- 13,112 · -2.7%
- By 2040
- 12,454 · -7.6%
- By 2050
- 11,973 · -11.1%
- By 2075
- 11,565 · -14.2%
- By 2100
- 10,844 · -19.5%
Race, ethnicity, and origin ACS 2023
- Neighborhood character
- Predominantly White (86%)
- Race & ethnicity
- White 86% Hispanic / Latino 10% Two or more races 7% Asian 1%
- Hispanic origin (detail)
- Mexican 10%
- Common ancestry
- Portuguese 23% Scottish 5% Iranian 3%
- Foreign-born
- 3% · Canada
- Languages at home
- 92% English-only · Spanish 6% Other Asian/Pacific 1%
Political lean MEDSL · Faribault
- 2024 margin
- Solid R (+37.4) · D 30.4% · R 67.8% · Other 1.8%
- 2008→2024 swing
- -31.8pp toward R · 2008: -5.6pp · 2024: -37.4pp
- All cycles
- 2024: R+37.4 2020: R+33.6 2016: R+34.1 2012: R+9.1 2008: R+5.6
Not yet ingested
- Civics
- —
Market trends
- HPI YoY
- ▲ 15.36%
- Current HPI
- 244.2912
- Rent YoY
- —
- Metro
- —
- State GDP YoY
- ▲ 2.41%
- F500 in state
- 34
Industry mix (Fortune 500 HQ in MN)
| Industry | F500 HQs | Revenue |
|---|---|---|
| Healthcare | 2 | $407B |
|
||
| Retail | 2 | $150B |
|
||
| Consumer Goods | 2 | $32B |
|
||
| Industrial Machinery | 2 | $6B |
|
||
| Agriculture | 1 | $40B |
|
||
| Healthcare / Medical Devices | 1 | $32B |
|
||
Price history
4 events — show timeline
- 2026-05-24 Contingent — RASM
- 2026-05-18 Relisted — RASM
- 2026-05-08 Contingent — RASM
- 2026-05-01 Listed $109,900 RASM
Property tax history
+5.3%/yrLatest (2025): $854 · -9.1% YoY. Source: county tax records.
Cash-flow waterfall
monthlySold comps — $/sqft
last 12 mo · ≤1 miLoading sold comps…