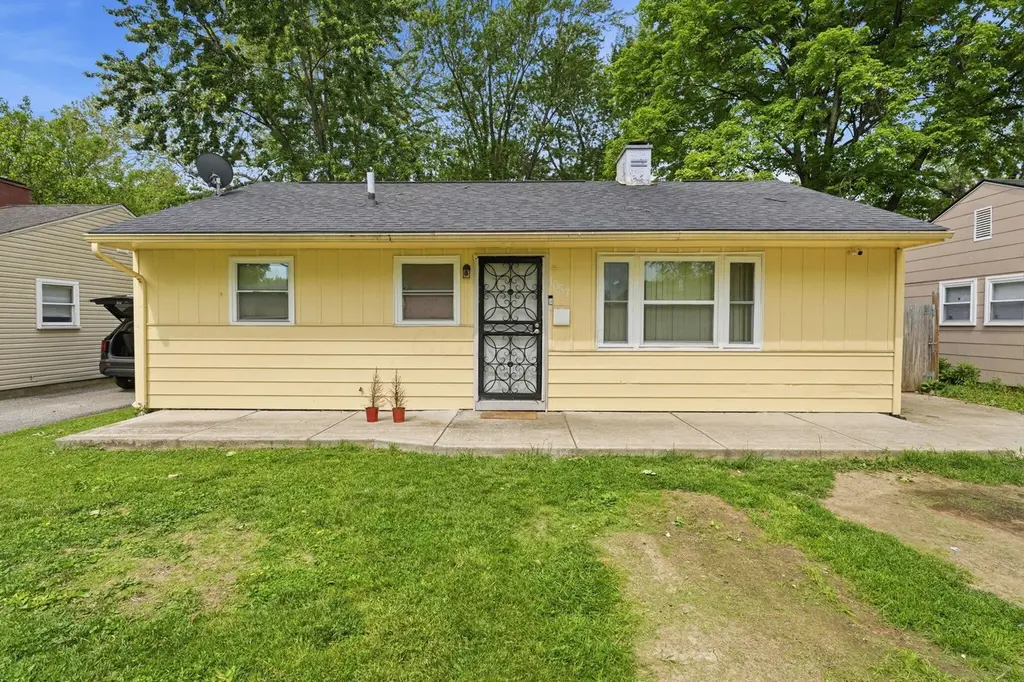
1057 S Hampton Rd · Columbus, OH
Flood risk 1/10 · Minimal
- FEMA flood zone
- X (unshaded)
- Chance of flooding over 30 yrs
- 0.0%
- Est. flood insurance / yr
- $507 – $1,088
Fire risk 1/10 · Minimal
- Est. fire insurance / yr
- $713 – $1,323
Heat risk 3/10 · Minor
- Hot days now (above 99°F)
- 7 days/yr
- Hot days in 30 yrs
- 18 days/yr
Wind risk 2/10 · Minimal
- Chance of severe wind over 30 yrs
- 1.0%
Air-quality risk 2/10 · Minimal
- Unhealthy air days now
- 1 days/yr
- Unhealthy air days in 30 yrs
- 1 days/yr
Risk factors via First Street. Map © Google.
Why this score? — see what drove the F grade
The composite is a weighted blend of 9 inputs, each scored 0–100. Each bar is that input's sub-score; the figure is the points it added to the 100-point composite (weight × sub-score).
- Cash flow +13.9/30.0
- DSCR +4.2/10.0
- Livability +4.0/5.0
- Rent growth +3.8/5.0
- 1% rule +3.5/10.0
- Condition / age +2.5/5.0
- Schools +1.7/10.0
- ARV discount +0.0/15.0
- Appreciation +0.0/10.0
$159,990
🖨 Deal sheet (PDF) 📄 Offer letter ✓ Due diligence
Listing remarks MLS
Don't miss this opportunity! This home is ideal for the for the first time home buyer, owner occupant, or an investor looking for a great return on investment.
Key facts
- 6,098 sq ft lot
- 2 garage spots
- Built 1952
Property features AI
Finance
- Other: Standard listing conditions
Exterior
- Parking: Detached 2-car garage
- Utilities: Public water; Public sewer
- Home design: Single family residence; One story; Built in 1952; No shared/common walls
- Construction: Built in 1952; Slab foundation
- Exterior features: Slab foundation; Lot approximately 0.14 acres; Subdivision: EASTHAMPTON
Interior
- Bedrooms: Three bedrooms on the main level
- Flooring: Vinyl
- Bathrooms: One full bathroom
- Heating & cooling: Central air conditioning; Forced air heating
- Interior features: Vinyl flooring; 864 finished living area
Neighborhood map
What this means for you Summary
Snapshot
- This is a 3-bed/1.0-bath single-family listed at $160k.
Deal economics
- At list price, monthly cash flow is $19 ($227/yr) — positive.
- The deal already cash-flows at list — no discount required.
- To meet the 1% rule (rent ≥ 1% of price), the offer needs to be $137k (14.6% below list).
- Recommended offer: $137k (14.6% below list) — sets the bar for 1% rule.
- Cap rate 6.4% vs local median 3.8% in Columbus — top-decile yield for the area; either an underpriced asset or a hidden risk that comps aren't pricing in. Stress-test before assuming the spread holds.
Location & tenants
- Location reads 81/100 on livability (#97 in OH, #1,491 nationally) — a professional / high-income tenant draw. Strengths: commute A+, cost of living A+, housing A+; Watch: employment C-, crime F.
- Columbus City School District (urban): math 15% / reading 26% proficiency, ranked #626 of 656 in OH (top 95%) — low school quality limits family demand, transient renter base, plan for 1-2y turnover; 72% free/reduced lunch — lower-income household profile, screen leases tightly.
- Zoned schools: Indianola Informal K-8 School (math 43% / reading 58%, grade D+, #896 of 1,584 statewide, top 57%, 684 students, 0% FRL); Arts Impact Middle School (Aims) (math 17% / reading 25%, grade F, #608 of 654 statewide, top 93%, 532 students, 0% FRL); Columbus Alternative High School (math 27% / reading 74%, grade D+, #380 of 781 statewide, top 49%, 758 students, 0% FRL) — zoned schools average 0% FRL vs 72% district-wide (72 pts lower); this property's tenant base skews higher-income than the district average.
- Zoned-school proficiency averages 41% at this address vs 20% district-wide (+20 pts) — the actual schools serving this property are materially stronger than the Columbus City School District average implies; a family-tenant draw the district grade alone would hide.
- Market conditions: Rents rising fast (+5.2%/yr); 65 active listings in the ZIP; 40 comparable units currently listed for rent nearby; rentals at typical pace (median 26d on market — plan ~3-4 weeks tenant-placement turnaround); 8,139 units permitted in Franklin County in 2024 (5,940 in 5+ unit buildings).
- This rent runs 34% of the median local income ($48k/yr) — at the standard rent-burdened threshold; future hikes will face affordability resistance.
Forward outlook
- Local home prices are declining (-3.0%/yr); year-one equity from $1k of loan paydown is wiped out by about $5k of value loss. Plan a longer hold.
- Franklin County population projected at +34% by 2050 — long-run rental-demand tailwind backs the buy-and-hold thesis.
Negotiation context
- It's been on market 20 days — a 2% lower offer ($158k) is reasonable based on typical stale-listing flexibility.
- 2 sale attempts since 7y ago with the ask held roughly flat each time — persistent listings suggest the price (not the market) is what's stuck; bring a comps-based counter.
- Current owner paid $80k; list at $160k implies a 100% gain — meaningful room to come down on a strong offer.
Risks & watch-outs
- Watch-outs: built in 1952 — expect roof / HVAC / electrical / plumbing capex.
Questions for the listing agent
- Built in 1952 — when were the roof, HVAC, electrical panel, plumbing, and water heater last replaced?
- Is there a deadline driving the sale (1031 exchange, divorce, estate, relocation)? That informs how much negotiation room exists.
- Crime grade is F in this area — have there been break-ins, vandalism, or insurance claims at this property in the last 3 years? What carrier currently insures it and at what premium?
- The area grade is low — what's the realistic commute time and amenity access for the typical tenant pool here? Any planned neighborhood developments (good or bad) we should know about?
- What's the average days-on-market for RENTAL listings here right now (not sales)? A rising rental-DOM trend means longer vacancies and softer asking-rent achievability than the comps imply.
- What's the recent tenant-quality profile in this submarket — average credit score on applications, eviction rate, late-payment / NSF rate, and stable-employment percentage? A property-management company in the area should have these aggregated.
- How much new for-sale + rental construction is in the pipeline within 1–3 miles? Heavy new supply typically softens prices + rents 12–24 months out; constrained supply supports both.
Investment metrics
- 1% rule
- 0.85% ✗
- Cap rate
- 6.43%
- Cash-on-cash
- 0.51%
- DSCR
- 1.02
- GRM
- 9.8
CMA / ARV
- ARV (on-the-fly)
- $128,736
- Comps found
- 12
Show comp detail 12 sales within ~0.75 mi
| Address | Dist | Beds/Ba | Sqft | Sold | Price | $/sf | Match |
|---|---|---|---|---|---|---|---|
| 1042 S Hampton Rd | 0.04mi | 3/1.0 | 864 (0%) | 3mo | $144,000 | $167 | 95 |
| 957 S Ashburton Rd | 0.17mi | 3/1.0 | 864 (0%) | 6mo | $104,100 | $120 | 87 |
| 891 S Hampton Rd | 0.25mi | 3/1.0 | 864 (0%) | 3mo | $120,000 | $139 | 86 |
| 941 Elizabeth Ave | 0.17mi | 3/1.0 | 864 (0%) | 9mo | $135,000 | $156 | 84 |
| 857 S Waverly St | 0.33mi | 3/1.0 | 850 (-2%) | 3mo | $127,000 | $149 | 80 |
| 3353 Towers Ct S | 0.26mi | 3/1.0 | 900 (+4%) | 6mo | $134,000 | $149 | 76 |
| 824 S Ashburton Rd | 0.33mi | 3/2.0 | 925 (+7%) | 1mo | $165,000 | $178 | 68 |
| 892 Ruby Ave | 0.42mi | 2/2.0 (-1) | 884 (+2%) | 3mo | $108,000 | $122 | 65 |
| 845 S Hampton Rd | 0.32mi | 3/1.0 | 979 (+13%) | 1mo | $120,000 | $123 | 62 |
| 685 S James Rd | 0.54mi | 4/2.5 (+1) | 884 (+2%) | 0mo | $79,900 | $90 | 59 |
| 711 S Waverly St | 0.54mi | 3/2.0 | 984 (+14%) | 6mo | $221,875 | $225 | 43 |
| 647 S Napoleon Ave | 0.69mi | 3/1.0 | 979 (+13%) | 6mo | $175,000 | $179 | 40 |
Match score weights: distance 35% · size 25% · config 20% · recency 20%. Top-matched comps best support the ARV.
Projected returns pro-forma
-3.0% appreciation · 5.22% rent growth · sell at horizon
- IRR
- -13.1%
- Equity multiple
- 0.52×
- Total profit
- $-21,608
- Equity at exit
- $23,855
- IRR
- -1.2%
- Equity multiple
- 0.91×
- Total profit
- $-3,895
- Equity at exit
- $13,833
Cash invested: $44,797 (down + closing). Projections, not guarantees.
Landlord ↔ Tenant lean methodology
- Overall (STATE)
- 73 Landlord-Friendly
- State Ohio
- 73 Landlord-Friendly · R+6
- County
- — inherits STATE
- City
- — inherits STATE
ZIP-level market 43227
- Rents YoY
- 5.2%
- Active inventory
- 65
- Price-to-rent
- 9.8×
Monthly cashflow live
- Estimated rent
- $1,367 high interval (Pro) →
- Mortgage (P&I)
- −$839
- Tax from tax record
- −$155 /mo · $1,860/yr
- Insurance
- −$67
- HOA
- −$0
- Vacancy / Maint / Mgmt
- −$287
- Net cashflow
- $19
Break-even live
Sensitivity live
| Price | -10% $109 | -5% $64 | +0% $19 | +5% $-26 | +10% $-72 |
|---|---|---|---|---|---|
| Rent | -10% $-89 | -5% $-35 | +0% $19 | +5% $73 | +10% $127 |
| Rate | -1.0pp $99 | -0.5pp $60 | base $19 | +0.5pp $-23 | +1.0pp $-65 |
UW: 25.0% down · 7.5% · 30yr · 1.5% tax · 5.0% vac · 8.0% maint · 8.0% mgmt
Financing live
Cash to close
- Down payment
- $39,998
- Closing costs
- $4,800
- Reserves months
- —
- Total cash needed
- —
Loan-product check · same deal, 3 products live
Conventional
25% down · 7.5% · 30yr
- Down + closing
- —
- Monthly P&I
- —
- Monthly cashflow
- —
- DSCR
- —
- Eligible?
- —
Personal DTI + credit; lowest rate.
DSCR
20% down · 8.5% · 30yr
- Down + closing
- —
- Monthly P&I
- —
- Monthly cashflow
- —
- DSCR
- —
- Eligible?
- —
No personal income docs; deal must DSCR.
Hard money
10% down · 12.0% · 12mo
- Down + closing
- —
- Monthly P&I
- —
- Monthly cashflow
- —
- DSCR
- —
- Eligible?
- —
Short-term bridge; refi at stabilization.
Rent comps 40 comps
| Address | Beds | Baths | Sqft | Rent | $/sqft | DOM | Units | Dist |
|---|---|---|---|---|---|---|---|---|
| 925 S Ashburton Rd Columbus, OH | 3.0 | 1.0 | 963 | $1,500 | $1.56 | 25d | 1 | 0.20mi |
| 1079 S James Rd Columbus, OH | 2.0 | 1.0 | 768 | $995 | $1.30 | 45d | 1 | 0.22mi |
| 3287 E Mound St Columbus, OH | 2.0 | 1.5 | 1100 | $1,300 | $1.18 | 23d | 1 | 0.26mi |
| 914 S Weyant Ave Columbus, OH | 3.0 | 1.5 | 1089 | $1,099 | $1.01 | 19d | 1 | 0.28mi |
| 3103 Clairpoint Ct Columbus, OH | 2.0 | 1.0 | 1000 | $1,060 | $1.06 | 45d | 1 | 0.30mi |
| 857 S Waverly St Columbus, OH | 3.0 | 1.0 | 850 | $1,250 | $1.47 | 45d | 1 | 0.31mi |
| 849 Byron Ave Columbus, OH | 3.0 | 1.5 | 936 | $1,400 | $1.50 | 9d | 1 | 0.40mi |
| 892 Ruby Ave Columbus, OH | 2.0 | 2.0 | 1100 | $1,500 | $1.36 | 45d | 1 | 0.40mi |
| 1303 Barnett Rd Columbus, OH | 2.0 | 1.0 | 1020 | $1,150 | $1.13 | 0d | 1 | 0.43mi |
| 1303 Barnett Rd Unit 1303 Columbus, OH | 2.0 | 1.0 | 1020 | $1,150 | $1.13 | 14d | 1 | 0.43mi |
| 1317 Barnett Rd Columbus, OH | 3.0 | 1.0 | 1057 | $1,299 | $1.23 | 14d | 1 | 0.44mi |
| 802 Ruby Ave Columbus, OH | 3.0 | 2.0 | 1004 | $1,875 | $1.87 | 45d | 1 | 0.50mi |
| 694-696 S Everett Ave Columbus, OH | 2.0 | 1.0 | 896 | $1,195 | $1.33 | 45d | 1 | 0.51mi |
| 3540 E Main St Columbus, OH | 2.0 | 1.0 | 914 | $1,074 | $1.18 | 5d | 5 | 0.62mi |
| 1256 Rand Ave Columbus, OH | 2.0 | 1.0 | 967 | $1,299 | $1.34 | 45d | 1 | 0.65mi |
| 802 Kenwick Rd Columbus, OH | 2.0 | 1.0 | 950 | $995 | $1.05 | 0d | 1 | 0.68mi |
| 3600 Cushing Dr Unit C Columbus, OH | 2.0 | 1.0 | 810 | $900 | $1.11 | 45d | 1 | 0.77mi |
| 522 Eastmoor Blvd Unit B Columbus, OH | 2.0 | 1.0 | 1000 | $1,200 | $1.20 | 0d | 1 | 0.79mi |
| 3605 Cushing Dr Unit A Columbus, OH | 2.0 | 1.0 | 900 | $815 | $0.91 | 12d | 1 | 0.79mi |
| 3632 Cushing Dr Columbus, OH | 2.0 | 1.0 | 950 | $1,050 | $1.11 | 14d | 1 | 0.81mi |
| 3632 Cushing Dr Unit B Columbus, OH | 2.0 | 1.0 | 900 | $950 | $1.06 | 22d | 1 | 0.81mi |
| 3632 Cushing Dr Unit D Columbus, OH | 2.0 | 1.0 | 950 | $1,050 | $1.11 | 18d | 1 | 0.81mi |
| 461 Eastmoor Blvd Columbus, OH | 2.0 | 1.0 | 1100 | $1,295 | $1.18 | 19d | 1 | 0.88mi |
| 1634 S James Rd Columbus, OH | 3.0 | 1.5 | 1120 | $1,945 | $1.74 | 45d | 1 | 0.89mi |
| 1246 Arkwood Ave Columbus, OH | 3.0 | 1.0 | 1094 | $1,740 | $1.59 | 45d | 1 | 0.89mi |
| 3486 Roswell Dr Columbus, OH | 3.0 | 2.0 | 1116 | $1,625 | $1.46 | 45d | 1 | 0.92mi |
| 416 S Weyant Ave Columbus, OH | 2.0 | 1.0 | 720 | $1,149 | $1.60 | 25d | 1 | 0.98mi |
| 3409 Bexvie Ave Columbus, OH | 2.0–3.0 | 1.5 | 990 | $1,400 | $1.41 | 4d | 3 | 1.00mi |
| 3417 Bexvie Ave Unit 3417-E Columbus, OH | 2.0 | 1.5 | 880 | $1,000 | $1.14 | 0d | 1 | 1.03mi |
| 3170 Melissa Pl Columbus, OH | 2.0 | 1.0 | 850 | $1,000 | $1.18 | 5d | 1 | 1.05mi |
| 393 Barnett Rd Columbus, OH | 2.0 | 1.5 | 840 | $975 | $1.16 | 25d | 1 | 1.06mi |
| 1303 Dellwood Ave Columbus, OH | 3.0 | 1.0 | 900 | $1,500 | $1.67 | 45d | 1 | 1.06mi |
| 3170 Melissa Pl Unit MR 3175A Columbus, OH | 2.0 | 1.0 | 850 | $1,000 | $1.18 | 25d | 1 | 1.07mi |
| 3170 Melissa Pl Unit El Columbus, OH | 2.0 | 1.0 | 850 | $1,000 | $1.18 | 0d | 1 | 1.07mi |
| 3974 Andrus Ave Columbus, OH | 2.0 | 1.5 | 950 | $1,235 | $1.30 | 25d | 3 | 1.14mi |
| 301 S Napoleon Ave Unit D Columbus, OH | 2.0 | 1.0 | 860 | $1,000 | $1.16 | 25d | 1 | 1.17mi |
| 301 S Napoleon Ave Unit D Columbus, OH | 2.0 | 1.0 | 860 | $1,000 | $1.16 | 45d | 1 | 1.17mi |
| 3974 Andrus Ct E Unit 3982D Columbus, OH | 2.0 | 1.5 | 950 | $1,285 | $1.35 | 25d | 1 | 1.17mi |
| 3974 Andrus Ct E Unit 3996C Columbus, OH | 2.0 | 1.5 | 950 | $1,185 | $1.25 | 25d | 1 | 1.17mi |
| 281 S Napoleon Ave Columbus, OH | 2.0 | 1.0 | 850 | $900 | $1.06 | 9d | 1 | 1.19mi |
Listing history 12 events
-
2026-06-08status $159,990 Pending 20 DOM
-
2026-06-07days on market $159,990 Active 20 DOM
-
2026-06-05days on market $159,990 Active 17 DOM
-
2026-06-03days on market $159,990 Active 16 DOM
-
2026-06-02days on market $159,990 Active 15 DOM
-
2026-06-01days on market $159,990 Active 14 DOM
-
2026-05-31days on market $159,990 Active 13 DOM
-
2026-05-18$159,990 Active
-
2019-05-10soldstatus $80,000
-
2019-05-01soldstatus $80,000 Closed 159-char remark
Show marketing remark (159 chars)
Don't miss this opportunity! This home is ideal for the for the first time home buyer, owner occupant, or an investor looking for a great return on investment.
-
2019-04-06historical Contingent Finance and Inspection 159-char remark
Show marketing remark (159 chars)
Don't miss this opportunity! This home is ideal for the for the first time home buyer, owner occupant, or an investor looking for a great return on investment.
-
2019-04-02$75,900 Active 159-char remark
Show marketing remark (159 chars)
Don't miss this opportunity! This home is ideal for the for the first time home buyer, owner occupant, or an investor looking for a great return on investment.
ⓘ Source: listings_history table (triggers on properties + properties_extension) + one-shot
backfill from property_details.listing_events for pre-trigger history.
Tax reassessment forecast OH · Partial reset (capped growth)
- Current annual tax
- $1,860 · $155/mo
- Projected year-2 tax
- $2,178 · $182/mo
- Expected delta
- +$318/yr (+$26/mo · 17.1%)
ⓘ Screening estimate from a state-policy table — verify with the county assessor before closing.
Climate risk First Street
- Flood 1/10 Low FEMA zone X (unshaded) · 0% chance over 30 yrs
- Wildfire 1/10 Low
- Heat 3/10 Moderate 7 d/yr ≥99°F today · 18 d/yr by 30 yrs out
- Wind 2/10 Low 100% chance of damaging wind over 30 yrs
- Air quality 2/10 Low 1 unhealthy d/yr today · 1 by 30 yrs out
Nearby sold comps map
Loading sold comps map…
Walkable amenities ~0.75 mi
Loading nearby amenities…
Taxation est. · year 1
- Rental income
- $16,399
- − Mortgage interest
- −$8,962
- − Property taxes
- −$1,860
- − Insurance
- −$800
- − Repairs & maintenance
- −$1,312
- − Management
- −$1,312
- − Depreciation
- −$4,654
- Taxable loss
- −$2,501
- Est. tax savings @ 24.0%
- +$600
- After-tax cash flow
- $827/yr
For passive investors: Depreciation is non-cash, so a rental often shows a tax loss while cash-flowing — sheltering income. Rental losses are passive: they offset passive income freely, and up to $25,000/yr can offset ordinary (W-2) income if you actively participate and your MAGI is under $100k (phasing out to $0 by $150k); unused losses carry forward. On sale, claimed depreciation is recaptured at up to 25%, and gains may owe capital-gains tax (a 1031 exchange can defer both). Figures are a year-1 estimate at your 24.0% rate — not tax advice; consult a CPA.
Schools (NCES district)
- District
- Columbus City School District
- NCES district ID
- 3904380
- Math proficiency
- 15% ▼ -17.00%
- Reading proficiency
- 26% ▼ -12.00%
- Median HH income
- $38,483
- Composite
- 17.19/100
- National rank
- #9105
- State rank
- #626 of 656 in OH
Livability — Columbus
- Score
- 81/100
- State rank
- #97
- US rank
- #1491
Category grades
Schools grade is shown separately in the Schools card above.
Census & demographics
- Census place
- Columbus, OH
- County
- Franklin County · 1,351,780 people
- City population
- 612,189
- Metro
- Columbus, OH
- Population (ZIP)
- 25,358
- Household income
- $48,159
- Rent vs Own
- Severe rent burden
- 1467.0
Population outlook (Franklin County) Hauer SSP2
- Today (2025)
- 1,456,139 people
- By 2030
- 1,556,890 · +6.9%
- By 2040
- 1,757,349 · +20.7%
- By 2050
- 1,950,539 · +34.0%
- By 2075
- 2,376,171 · +63.2%
- By 2100
- 2,636,796 · +81.1%
Race, ethnicity, and origin ACS 2023
- Neighborhood character
- Majority Black (63%)
- Race & ethnicity
- Black 63% White 23% Hispanic / Latino 9% Two or more races 5%
- Hispanic origin (detail)
- Mexican 3%
- Common ancestry
- Swiss 1% Slovak 1%
- Foreign-born
- 11% · Canada
- Languages at home
- 87% English-only · Spanish 7% French/Haitian/Cajun 1%
Political lean MEDSL · Franklin
- 2024 margin
- Strong D (+28.4) · D 63.7% · R 35.3% · Other 1.0%
- 2008→2024 swing
- +7.7pp toward D · 2008: 20.7pp · 2024: 28.4pp
- All cycles
- 2024: D+28.4 2020: D+31.4 2016: D+25.9 2012: D+21.7 2008: D+20.7
Not yet ingested
- Civics
- —
Market trends
- HPI YoY
- ▼ -193.50%
- Current HPI
- 301.3767
- Rent YoY
- ▲ 5.22%
- Metro
- Columbus, OH
- State GDP YoY
- ▲ 1.98%
- F500 in state
- 48
Industry mix (Fortune 500 HQ in OH)
| Industry | F500 HQs | Revenue |
|---|---|---|
| Insurance | 3 | $145B |
|
||
| Industrial Machinery | 3 | $49B |
|
||
| Financial Services | 3 | $24B |
|
||
| Consumer Goods | 2 | $93B |
|
||
| Aerospace / Defense | 2 | $47B |
|
||
| Utilities | 2 | $33B |
|
||
Price history
+110.8% since first listed5 events — show timeline
- 2026-05-18 Listed $159,990 CBRMLS
- 2019-05-10 Sold (Public Records) $80,000 Public Records
- 2019-05-01 Sold (MLS) $80,000 CBRMLS
- 2019-04-06 Contingent — CBRMLS
- 2019-04-02 Listed $75,900 CBRMLS
Property tax history
+7.0%/yrLatest (2024): $1,860 · +1.3% YoY. Source: county tax records.
Cash-flow waterfall
monthlySold comps — $/sqft
last 12 mo · ≤1 miLoading sold comps…