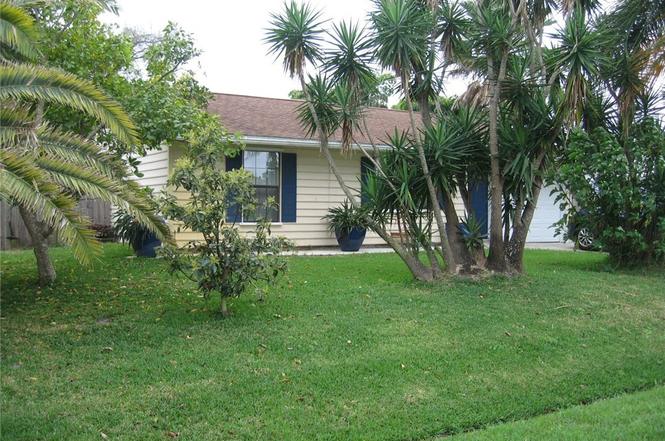
655 Chesser Ave · Sebastian, FL
Flood risk 1/10 · Minimal
- FEMA flood zone
- X (unshaded)
- Chance of flooding over 30 yrs
- 0.0%
- Est. flood insurance / yr
- $507 – $1,088
Fire risk 2/10 · Minimal
- Est. fire insurance / yr
- $947 – $1,759
Heat risk 10/10 · Severe
- Hot days now (above 106°F)
- 7 days/yr
- Hot days in 30 yrs
- 23 days/yr
Wind risk 10/10 · Severe
- Chance of severe wind over 30 yrs
- 99.0%
Air-quality risk 1/10 · Minimal
- Unhealthy air days now
- 0 days/yr
- Unhealthy air days in 30 yrs
- 0 days/yr
Risk factors via First Street. Map © Google.
Why this score? — see what drove the D grade
The composite is a weighted blend of 9 inputs, each scored 0–100. Each bar is that input's sub-score; the figure is the points it added to the 100-point composite (weight × sub-score).
- Cash flow +12.8/30.0
- ARV discount +10.6/15.0
- Schools +4.2/10.0
- Rent growth +4.1/5.0
- Livability +4.0/5.0
- DSCR +3.8/10.0
- 1% rule +2.8/10.0
- Condition / age +2.5/5.0
- Appreciation +0.0/10.0
$279,900
🖨 Deal sheet (PDF) 📄 Offer letter ✓ Due diligence
Listing remarks MLS
ABSOLUTELY ADORABLE! 2/2 WITH LARGE FAMILY ROOM WITH DINING ROOM INCLUDING. UPDATE KITCHENS AND BATHS. FENCED YARD WITH SHED. POURED CONCRETE PATIO IN THE BACK YARD ALONG WITH BOAT OR SMALL RV PARKING IN THE FRONT YARD. CHARMING AND COZY.
Key facts
- Fenced backyard
- Access to dining
- 0.24 acre lot
Tags
Property features AI
Finance
- Financial info: Pets allowed
- HOA & community: No association
Exterior
- Parking: Driveway
- Utilities: Public water; Private sewer
- Home design: Single-story; North-facing
- Construction: Frame construction; Shingle roof
- Exterior features: Fence; Shed(s); Paved road access; Has view; Less than quarter-acre lot
Interior
- Kitchen: Dishwasher; Disposal; Microwave; Range
- Bedrooms: Converted bedroom (13 x 11); Bedroom (13 x 12); Bedroom (19 x 13)
- Flooring: Laminate; Tile; Wood
- Bathrooms: 2 full bathrooms
- Heating & cooling: Central heating; Central air conditioning
- Interior features: Single-hung windows; Unfurnished
- Laundry & utility: Laundry room; Washer; Dryer
Neighborhood map
What this means for you Summary
Snapshot
- This is a 2-bed/2.0-bath single-family listed at $280k.
Deal economics
- At list price, monthly cash flow is $-27 ($-324/yr) — negative.
- To cash-flow at today's rent, offer at most $275k (1.7% below list).
- To meet the 1% rule (rent ≥ 1% of price), the offer needs to be $219k (21.6% below list).
- Recommended offer: $219k (21.6% below list) — sets the bar for 1% rule.
- Cap rate 6.2% vs local median 4.4% in Sebastian — top-decile yield for the area; either an underpriced asset or a hidden risk that comps aren't pricing in. Stress-test before assuming the spread holds.
Location & tenants
- Location reads 81/100 on livability (#89 in FL, #1,421 nationally) — a professional / high-income tenant draw. Strengths: housing A+, crime A, health & safety A; Watch: amenities D-.
- Indian River (other): math 48% / reading 52% proficiency, ranked #35 of 73 in FL (top 48%) — acceptable for families but not a draw, mixed tenant base, ~2y average lease.
- Zoned schools: Sebastian Elementary School (math 37% / reading 42%, grade F, #1,513 of 2,144 statewide, top 73%, 329 students, 72% FRL); Sebastian River Middle School (math 46% / reading 44%, grade D, #310 of 571 statewide, top 56%, 862 students, 65% FRL); Sebastian River High School (math 29% / reading 45%, grade F, #340 of 667 statewide, top 52%, 1,843 students, 52% FRL).
- Market conditions: Rents rising fast (+6.2%/yr); 411 active listings in the ZIP; 15 comparable units currently listed for rent nearby; rentals at typical pace (median 23d on market — plan ~3-4 weeks tenant-placement turnaround); 564 units permitted in Indian River County in 2024 (281 in 5+ unit buildings).
- This rent runs 39% of the median local income ($67k/yr) — at the standard rent-burdened threshold; future hikes will face affordability resistance.
Forward outlook
- Local home prices are declining (-3.0%/yr); year-one equity from $2k of loan paydown is wiped out by about $8k of value loss. Plan a longer hold.
- Indian River County population projected at +18% by 2050 — long-run rental-demand tailwind backs the buy-and-hold thesis.
Negotiation context
- It's been on market 119 days — a 9% lower offer ($255k) is reasonable based on typical stale-listing flexibility.
- 4 sale attempts since 12y ago; this cycle's ask has dropped $20k (7%) from the opening price — seller is motivated, your offer sets the floor, not the list.
- Current owner paid $169k; list at $280k implies a 66% gain — meaningful room to come down on a strong offer.
Risks & watch-outs
- Climate carrying-cost: severe wind risk, 99% chance of damaging wind over 30y; extreme-heat days projected 7→23/yr by 2055 (HVAC capex compounding) — expect insurance premiums to compound above CPI over the hold.
Questions for the listing agent
- What do current leases actually rent for vs. the listed asking? Can we see a recent rent roll and the last 12 months of T-12 income?
- It's been on market 119 days. Have you received any prior offers? Is the seller open to a 22% concession, seller financing, or rate buy-down credit?
- Why hasn't it sold? Are there any deal-killer items the seller is aware of (foundation, flood, title, zoning, code violations)?
- Is there a deadline driving the sale (1031 exchange, divorce, estate, relocation)? That informs how much negotiation room exists.
- Schools are D-rated, which usually means shorter tenancies and higher turnover. Who's the typical renter profile here, and what's been the actual vacancy rate?
- The area grade is low — what's the realistic commute time and amenity access for the typical tenant pool here? Any planned neighborhood developments (good or bad) we should know about?
- What's the average days-on-market for RENTAL listings here right now (not sales)? A rising rental-DOM trend means longer vacancies and softer asking-rent achievability than the comps imply.
- What's the recent tenant-quality profile in this submarket — average credit score on applications, eviction rate, late-payment / NSF rate, and stable-employment percentage? A property-management company in the area should have these aggregated.
- How much new for-sale + rental construction is in the pipeline within 1–3 miles? Heavy new supply typically softens prices + rents 12–24 months out; constrained supply supports both.
Investment metrics
- 1% rule
- 0.78% ✗
- Cap rate
- 6.18%
- Cash-on-cash
- -0.41%
- DSCR
- 0.98
- GRM
- 10.6
CMA / ARV
- ARV (on-the-fly)
- $300,840
- Comps found
- 12
Show comp detail 12 sales within ~0.75 mi
| Address | Dist | Beds/Ba | Sqft | Sold | Price | $/sf | Match |
|---|---|---|---|---|---|---|---|
| 397 Warren St | 0.11mi | 2/3.0 | 1,329 (-4%) | 2mo | $190,000 | $143 | 84 |
| 502 Park Ave | 0.40mi | 2/2.0 | 1,402 (+2%) | 3mo | $295,000 | $210 | 76 |
| 333 Benschop St | 0.20mi | 3/2.0 (+1) | 1,294 (-6%) | 1mo | $327,500 | $253 | 74 |
| 358 Benschop St | 0.15mi | 2/2.0 | 1,230 (-11%) | 2mo | $335,000 | $272 | 74 |
| 572 Citrus Ave | 0.38mi | 3/2.0 (+1) | 1,445 (+5%) | 0mo | $285,000 | $197 | 69 |
| 474 Thomas St | 0.21mi | 3/2.0 (+1) | 1,520 (+10%) | 1mo | $255,000 | $168 | 67 |
| 549 Layport Dr | 0.59mi | 2/2.0 | 1,423 (+3%) | 1mo | $350,000 | $246 | 66 |
| 390 Main St | 0.25mi | 2/2.0 | 1,209 (-12%) | 2mo | $265,000 | $219 | 66 |
| 572 Orange Ave | 0.34mi | 2/2.0 | 1,218 (-12%) | 3mo | $265,000 | $218 | 62 |
| 441 Columbus St | 0.67mi | 3/2.0 (+1) | 1,418 (+3%) | 4mo | $250,000 | $176 | 56 |
| 495 Easy St | 0.61mi | 3/2.0 (+1) | 1,276 (-8%) | 3mo | $255,500 | $200 | 51 |
| 382 Easy St | 0.51mi | 3/2.0 (+1) | 1,194 (-14%) | 2mo | $325,000 | $272 | 47 |
Match score weights: distance 35% · size 25% · config 20% · recency 20%. Top-matched comps best support the ARV.
Projected returns pro-forma
-3.0% appreciation · 6.22% rent growth · sell at horizon
- IRR
- -13.8%
- Equity multiple
- 0.49×
- Total profit
- $-39,807
- Equity at exit
- $41,734
- IRR
- -0.8%
- Equity multiple
- 0.94×
- Total profit
- $-4,992
- Equity at exit
- $24,201
Cash invested: $78,372 (down + closing). Projections, not guarantees.
Landlord ↔ Tenant lean methodology
- Overall (STATE)
- 87 Strongly Landlord-Friendly
- State Florida
- 87 Strongly Landlord-Friendly · R+3
- County
- — inherits STATE
- City
- — inherits STATE
ZIP-level market 32958
- Home prices YoY
- -13.1%
- Rents YoY
- 6.2%
- Active inventory
- 411
- Price-to-rent
- 10.6×
Monthly cashflow live
- Estimated rent
- $2,195 high interval (Pro) →
- Mortgage (P&I)
- −$1,468
- Tax from tax record
- −$176 /mo · $2,117/yr
- Insurance
- −$117
- HOA
- −$0
- Vacancy / Maint / Mgmt
- −$461
- Net cashflow
- $-27
Break-even live
Sensitivity live
| Price | -10% $131 | -5% $52 | +0% $-27 | +5% $-106 | +10% $-185 |
|---|---|---|---|---|---|
| Rent | -10% $-200 | -5% $-114 | +0% $-27 | +5% $60 | +10% $146 |
| Rate | -1.0pp $114 | -0.5pp $44 | base $-27 | +0.5pp $-99 | +1.0pp $-173 |
UW: 25.0% down · 7.5% · 30yr · 1.5% tax · 5.0% vac · 8.0% maint · 8.0% mgmt
Financing live
Cash to close
- Down payment
- $69,975
- Closing costs
- $8,397
- Reserves months
- —
- Total cash needed
- —
Loan-product check · same deal, 3 products live
Conventional
25% down · 7.5% · 30yr
- Down + closing
- —
- Monthly P&I
- —
- Monthly cashflow
- —
- DSCR
- —
- Eligible?
- —
Personal DTI + credit; lowest rate.
DSCR
20% down · 8.5% · 30yr
- Down + closing
- —
- Monthly P&I
- —
- Monthly cashflow
- —
- DSCR
- —
- Eligible?
- —
No personal income docs; deal must DSCR.
Hard money
10% down · 12.0% · 12mo
- Down + closing
- —
- Monthly P&I
- —
- Monthly cashflow
- —
- DSCR
- —
- Eligible?
- —
Short-term bridge; refi at stabilization.
Rent comps 15 comps
| Address | Beds | Baths | Sqft | Rent | $/sqft | DOM | Units | Dist |
|---|---|---|---|---|---|---|---|---|
| 462 Lloyd St Sebastian, FL | 3.0 | 2.0 | 1564 | $2,400 | $1.53 | 23d | 1 | 0.16mi |
| 586 Gerald St Sebastian, FL | 3.0 | 3.0 | 936 | $1,600 | $1.71 | 15d | 1 | 0.38mi |
| 422 Avocado Ave Sebastian, FL | 3.0 | 2.0 | 1698 | $3,900 | $2.30 | 23d | 1 | 0.61mi |
| 11171 Airport Dr Sebastian, FL | 2.0 | 2.0 | 1191 | $1,900 | $1.60 | 23d | 1 | 0.71mi |
| 362 Del Monte Rd Unit A Sebastian, FL | 2.0 | 2.0 | 1045 | $1,600 | $1.53 | 23d | 1 | 0.73mi |
| 351 Del Monte Rd Unit B Sebastian, FL | 3.0 | 2.0 | 1416 | $1,900 | $1.34 | 15d | 1 | 0.76mi |
| 351 Del Monte Rd Unit B Sebastian, FL | 3.0 | 2.0 | 1416 | $1,900 | $1.34 | 23d | 1 | 0.76mi |
| 393 S Wimbrow Dr Apt A Sebastian, FL | 2.0 | 2.0 | 1700 | $1,900 | $1.12 | 23d | 1 | 0.80mi |
| 371 Keen Ter Unit A Sebastian, FL | 2.0 | 2.0 | 1037 | $1,650 | $1.59 | 23d | 1 | 0.81mi |
| 741 Smith St Sebastian, FL | 2.0 | 1.5 | 891 | $1,900 | $2.13 | 23d | 1 | 0.89mi |
| 243 Harp Ter Unit A Sebastian, FL | 2.0 | 2.0 | 1150 | $1,885 | $1.64 | 23d | 1 | 0.95mi |
| 882 Foster Ave Sebastian, FL | 3.0 | 2.0 | 1080 | $2,450 | $2.27 | 23d | 1 | 1.04mi |
| 246 S Wimbrow Dr Sebastian, FL | 3.0 | 2.0 | 1364 | $3,000 | $2.20 | 15d | 1 | 1.11mi |
| 832 Carnation Dr Sebastian, FL | 3.0 | 2.0 | 1400 | $2,800 | $2.00 | 15d | 1 | 1.29mi |
| 950 Louisiana Ave Sebastian, FL | 2.0 | 1.5 | 990 | $1,550 | $1.57 | 23d | 1 | 1.32mi |
Listing history 27 events
-
2026-06-16days on market $279,900 Active 119 DOM
-
2026-06-15days on market $279,900 Active 118 DOM
-
2026-06-14days on market $279,900 Active 116 DOM
-
2026-06-13days on market $279,900 Active 115 DOM
-
2026-06-10days on market $279,900 Active 113 DOM
-
2026-06-09days on market $279,900 Active 112 DOM
-
2026-06-08days on market $279,900 Active 111 DOM
-
2026-06-07days on market $279,900 Active 110 DOM
-
2026-06-05days on market $279,900 Active 107 DOM
-
2026-06-02days on market $279,900 Active 105 DOM
-
2026-06-01days on market $279,900 Active 104 DOM
-
2026-05-31days on market $279,900 Active 103 DOM
-
2026-05-30days on market $279,900 Active 102 DOM
-
2026-04-09price $279,900
-
2026-02-16$299,900 Active
-
2019-04-04soldstatus $169,000
-
2019-03-29soldstatus $169,000 238-char remark
Show marketing remark (238 chars)
ABSOLUTELY ADORABLE! 2/2 WITH LARGE FAMILY ROOM WITH DINING ROOM INCLUDING. UPDATE KITCHENS AND BATHS. FENCED YARD WITH SHED. POURED CONCRETE PATIO IN THE BACK YARD ALONG WITH BOAT OR SMALL RV PARKING IN THE FRONT YARD. CHARMING AND COZY.
-
2019-03-29soldstatus $169,000 Sold 238-char remark
Show marketing remark (238 chars)
ABSOLUTELY ADORABLE! 2/2 WITH LARGE FAMILY ROOM WITH DINING ROOM INCLUDING. UPDATE KITCHENS AND BATHS. FENCED YARD WITH SHED. POURED CONCRETE PATIO IN THE BACK YARD ALONG WITH BOAT OR SMALL RV PARKING IN THE FRONT YARD. CHARMING AND COZY.
-
2019-03-11historical Contingent 238-char remark
Show marketing remark (238 chars)
ABSOLUTELY ADORABLE! 2/2 WITH LARGE FAMILY ROOM WITH DINING ROOM INCLUDING. UPDATE KITCHENS AND BATHS. FENCED YARD WITH SHED. POURED CONCRETE PATIO IN THE BACK YARD ALONG WITH BOAT OR SMALL RV PARKING IN THE FRONT YARD. CHARMING AND COZY.
-
2019-02-25$174,800 Active 238-char remark
Show marketing remark (238 chars)
ABSOLUTELY ADORABLE! 2/2 WITH LARGE FAMILY ROOM WITH DINING ROOM INCLUDING. UPDATE KITCHENS AND BATHS. FENCED YARD WITH SHED. POURED CONCRETE PATIO IN THE BACK YARD ALONG WITH BOAT OR SMALL RV PARKING IN THE FRONT YARD. CHARMING AND COZY.
-
2019-02-25$174,800 238-char remark
Show marketing remark (238 chars)
ABSOLUTELY ADORABLE! 2/2 WITH LARGE FAMILY ROOM WITH DINING ROOM INCLUDING. UPDATE KITCHENS AND BATHS. FENCED YARD WITH SHED. POURED CONCRETE PATIO IN THE BACK YARD ALONG WITH BOAT OR SMALL RV PARKING IN THE FRONT YARD. CHARMING AND COZY.
-
2014-06-25soldstatus $89,000
-
2014-05-20historical
-
2014-04-19$95,999
-
2005-09-26soldstatus $175,000
-
2004-07-15soldstatus $125,000
-
1988-08-01soldstatus $48,000
ⓘ Source: listings_history table (triggers on properties + properties_extension) + one-shot
backfill from property_details.listing_events for pre-trigger history.
Tax reassessment forecast FL · Resets to sale price
- Current annual tax
- $2,117 · $176/mo
- Projected year-2 tax
- $2,323 · $194/mo
- Expected delta
- +$207/yr (+$17/mo · 9.8%)
ⓘ Screening estimate from a state-policy table — verify with the county assessor before closing.
Climate risk First Street
- Flood 1/10 Low FEMA zone X (unshaded) · 0% chance over 30 yrs
- Wildfire 2/10 Low
- Heat 10/10 Extreme 7 d/yr ≥106°F today · 23 d/yr by 30 yrs out
- Wind 10/10 Extreme 99% chance of damaging wind over 30 yrs
- Air quality 1/10 Low 0 unhealthy d/yr today · 0 by 30 yrs out
Nearby sold comps map
Loading sold comps map…
Walkable amenities ~0.75 mi
Loading nearby amenities…
Taxation est. · year 1
- Rental income
- $26,337
- − Mortgage interest
- −$15,679
- − Property taxes
- −$2,117
- − Insurance
- −$1,400
- − Repairs & maintenance
- −$2,107
- − Management
- −$2,107
- − Depreciation
- −$8,143
- Taxable loss
- −$5,214
- Est. tax savings @ 24.0%
- +$1,251
- After-tax cash flow
- $928/yr
For passive investors: Depreciation is non-cash, so a rental often shows a tax loss while cash-flowing — sheltering income. Rental losses are passive: they offset passive income freely, and up to $25,000/yr can offset ordinary (W-2) income if you actively participate and your MAGI is under $100k (phasing out to $0 by $150k); unused losses carry forward. On sale, claimed depreciation is recaptured at up to 25%, and gains may owe capital-gains tax (a 1031 exchange can defer both). Figures are a year-1 estimate at your 24.0% rate — not tax advice; consult a CPA.
Schools (NCES district)
- District
- Indian River
- NCES district ID
- 1200930
- Math proficiency
- 48% ▼ -9.00%
- Reading proficiency
- 52% ▼ -3.00%
- Median HH income
- $46,597
- Composite
- 42.45/100
- National rank
- #3218
- State rank
- #35 of 73 in FL
Livability — Sebastian
- Score
- 81/100
- State rank
- #89
- US rank
- #1421
Category grades
Schools grade is shown separately in the Schools card above.
Census & demographics
- Census place
- Sebastian, FL
- County
- Indian River County · 143,738 people
- City population
- 30,023
- Metro
- Sebastian-Vero Beach, FL
- Population (ZIP)
- 30,023
- Household income
- $66,840
- Rent vs Own
- Severe rent burden
- 646.0
Population outlook (Indian River County) Hauer SSP2
- Today (2025)
- 165,104 people
- By 2030
- 172,869 · +4.7%
- By 2040
- 185,640 · +12.4%
- By 2050
- 194,465 · +17.8%
- By 2075
- 211,115 · +27.9%
- By 2100
- 211,781 · +28.3%
Race, ethnicity, and origin ACS 2023
- Neighborhood character
- Predominantly White (86%)
- Race & ethnicity
- White 86% Hispanic / Latino 9% Two or more races 7% Black 2% Asian 1%
- Hispanic origin (detail)
- Mexican 1% Puerto Rican 2% Cuban 3%
- Common ancestry
- Lithuanian 4% Slovak 4% Romanian 3%
- Foreign-born
- 7% · Canada, Jamaica
- Languages at home
- 91% English-only · Spanish 6% Other Indo-European 1% Russian/Polish/Slavic 1%
Political lean MEDSL · Indian River
- 2024 margin
- Strong R (+27.4) · D 36.0% · R 63.4%
- 2008→2024 swing
- -12.5pp toward R · 2008: -14.8pp · 2024: -27.4pp
- All cycles
- 2024: R+27.4 2020: R+21.6 2016: R+24.5 2012: R+22.3 2008: R+14.8
Not yet ingested
- Civics
- —
Market trends
- HPI YoY
- ▼ -49.85%
- Current HPI
- 330.1691
- Rent YoY
- ▲ 6.22%
- Metro
- Sebastian-Vero Beach, FL
- State GDP YoY
- ▲ 3.28%
- F500 in state
- 36
Industry mix (Fortune 500 HQ in FL)
| Industry | F500 HQs | Revenue |
|---|---|---|
| Industrial Technology | 2 | $29B |
|
||
| Insurance | 2 | $17B |
|
||
| Retail | 1 | $60B |
|
||
| Technology Distribution | 1 | $58B |
|
||
| Homebuilding | 1 | $35B |
|
||
| Technology Manufacturing | 1 | $35B |
|
||
Price history
+483.1% since first listed14 events — show timeline
- 2026-04-09 Price Changed $279,900 RAIRCMLS
- 2026-02-16 Listed $299,900 RAIRCMLS
- 2019-04-04 Sold (Public Records) $169,000 Public Records
- 2019-03-29 Sold (MLS) $169,000 RAIRCMLS
- 2019-03-29 Sold (MLS) $169,000 SCMLS
- 2019-03-11 Contingent — RAIRCMLS
- 2019-02-25 Listed $174,800 RAIRCMLS
- 2019-02-25 Listed $174,800 SCMLS
- 2014-06-25 Sold (MLS) $89,000 Beaches MLS
- 2014-05-20 Listing Removed — Beaches MLS
- 2014-04-19 Listed $95,999 Beaches MLS
- 2005-09-26 Sold (Public Records) $175,000 Public Records
- 2004-07-15 Sold (Public Records) $125,000 Public Records
- 1988-08-01 Sold (Public Records) $48,000 Public Records
Property tax history
+11.4%/yrLatest (2025): $2,117 · +9.7% YoY. Source: county tax records.
Cash-flow waterfall
monthlySold comps — $/sqft
last 12 mo · ≤1 miLoading sold comps…