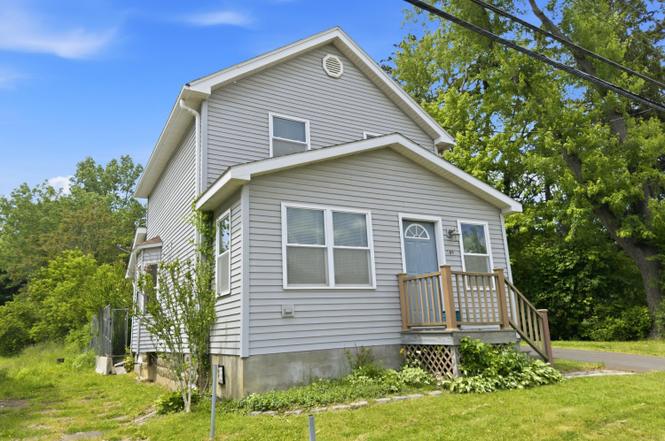
189 River Rd · Albany, NY
Flood risk 1/10 · Minimal
- FEMA flood zone
- X (unshaded)
- Chance of flooding over 30 yrs
- 0.0%
- Est. flood insurance / yr
- $473 – $860
Fire risk 2/10 · Minimal
- Est. fire insurance / yr
- $691 – $1,283
Heat risk 4/10 · Minor
- Hot days now (above 99°F)
- 7 days/yr
- Hot days in 30 yrs
- 16 days/yr
Wind risk 3/10 · Minor
- Chance of severe wind over 30 yrs
- 7.0%
Air-quality risk 1/10 · Minimal
- Unhealthy air days now
- 0 days/yr
- Unhealthy air days in 30 yrs
- 0 days/yr
Risk factors via First Street. Map © Google.
Why this score? — see what drove the C- grade
The composite is a weighted blend of 9 inputs, each scored 0–100. Each bar is that input's sub-score; the figure is the points it added to the 100-point composite (weight × sub-score).
- ARV discount +15.0/15.0
- Cash flow +12.7/30.0
- Schools +6.5/10.0
- Livability +4.0/5.0
- 1% rule +3.8/10.0
- DSCR +3.8/10.0
- Rent growth +2.5/5.0
- Condition / age +2.5/5.0
- Appreciation +0.0/10.0
$249,000
🖨 Deal sheet (PDF) 📄 Offer letter ✓ Due diligence
Listing remarks
Super neat and clean in Bethlehem Schools! Move-in ready, hardwoods, upstairs laundry, many updates! Garage, new oil tank, quiet setting. USDA financing eligible!
Key facts
- Many updates
- Hardwoods
- Quiet setting
Tags
Property features AI
Exterior
- Parking: Has detached garage; One garage space; Total of six parking spaces; Off-street parking and driveway
- Utilities: Public water; Septic tank sewer
- Home design: Single family residence; Facing direction not specified
- Construction: Vinyl siding
- Exterior features: Asphalt roof; Back yard fencing; Paved driveway
Interior
- Kitchen: Built-in electric oven; Dishwasher; Refrigerator
- Bedrooms: Three bedrooms on the second level
- Flooring: Vinyl flooring; Hardwood flooring
- Bathrooms: One full bathroom on the second level; One half bathroom on the first level
- Heating & cooling: Hot water heating; Oil heating
- Interior features: Six total rooms; Full basement
- Laundry & utility: Washer and dryer located on the main level
Neighborhood map
What this means for you Summary
Snapshot
- This is a 3-bed/1.0-bath single-family listed at $249k.
Deal economics
- At list price, monthly cash flow is $-28 ($-337/yr) — negative.
- To cash-flow at today's rent, offer at most $244k (2.0% below list).
- To meet the 1% rule (rent ≥ 1% of price), the offer needs to be $218k (12.3% below list).
- Recommended offer: $218k (12.3% below list) — sets the bar for 1% rule.
Location & tenants
- Location reads 79/100 on livability (#129 in NY, #2,083 nationally) — a middle-class / working-renter tenant base. Strengths: amenities A+, commute A+, housing A+; Watch: employment C-, crime F.
- Bethlehem Central School District (suburban): math 70% / reading 74% proficiency, ranked #90 of 590 in NY (top 15%) — strong family-tenant draw, lease renewals of 3-5y typical; only 7% free/reduced lunch — higher-income household profile.
- Zoned schools: Bethlehem Central Middle School (math 50% / reading 69%, grade B, #161 of 729 statewide, top 24%, 923 students, 14% FRL); Bethlehem Central Senior High School (math 100% / reading 87%, grade A+, #141 of 1,100 statewide, top 13%, 1,364 students, 13% FRL).
- Market conditions: 25 active listings in the ZIP; 3 comparable units currently listed for rent nearby; rentals at typical pace (median 17d on market — plan ~3-4 weeks tenant-placement turnaround); 675 units permitted in Albany County in 2024 (451 in 5+ unit buildings).
Forward outlook
- Local home prices are declining (-3.0%/yr); year-one equity from $2k of loan paydown is wiped out by about $7k of value loss. Plan a longer hold.
- Albany County population projected at +9% by 2050 — modest demand growth; plan on rents tracking national, not racing it.
Negotiation context
- Only 11 days on market — expect competitive offers; lowballing is unlikely to land.
- Current owner paid $78k; list at $249k implies a 221% gain — meaningful room to come down on a strong offer.
Risks & watch-outs
- Watch-outs: built in 1932 — expect roof / HVAC / electrical / plumbing capex.
Questions for the listing agent
- What do current leases actually rent for vs. the listed asking? Can we see a recent rent roll and the last 12 months of T-12 income?
- Built in 1932 — when were the roof, HVAC, electrical panel, plumbing, and water heater last replaced?
- Is there a deadline driving the sale (1031 exchange, divorce, estate, relocation)? That informs how much negotiation room exists.
- Crime grade is F in this area — have there been break-ins, vandalism, or insurance claims at this property in the last 3 years? What carrier currently insures it and at what premium?
- What's the average days-on-market for RENTAL listings here right now (not sales)? A rising rental-DOM trend means longer vacancies and softer asking-rent achievability than the comps imply.
- What's the recent tenant-quality profile in this submarket — average credit score on applications, eviction rate, late-payment / NSF rate, and stable-employment percentage? A property-management company in the area should have these aggregated.
- How much new for-sale + rental construction is in the pipeline within 1–3 miles? Heavy new supply typically softens prices + rents 12–24 months out; constrained supply supports both.
Investment metrics
- 1% rule
- 0.88% ✗
- Cap rate
- 6.16%
- Cash-on-cash
- -0.48%
- DSCR
- 0.98
- GRM
- 9.5
CMA / ARV
- ARV (on-the-fly)
- $372,792
- Comps found
- 2
Show comp detail 2 sales within ~0.75 mi
| Address | Dist | Beds/Ba | Sqft | Sold | Price | $/sf | Match |
|---|---|---|---|---|---|---|---|
| 133 Retreat House Rd | 0.16mi | 3/1.0 | 1,328 (+5%) | 17mo | $245,000 | $184 | 71 |
| 18 Joshua Pl | 0.65mi | 2/2.0 (-1) | 1,260 (-1%) | 10mo | $370,000 | $294 | 51 |
Match score weights: distance 35% · size 25% · config 20% · recency 20%. Top-matched comps best support the ARV.
Projected returns pro-forma
-3.0% appreciation · 3.0% rent growth · sell at horizon
- IRR
- -17.1%
- Equity multiple
- 0.40×
- Total profit
- $-42,085
- Equity at exit
- $37,127
- IRR
- -8.9%
- Equity multiple
- 0.44×
- Total profit
- $-38,738
- Equity at exit
- $21,529
Cash invested: $69,720 (down + closing). Projections, not guarantees.
Landlord ↔ Tenant lean methodology
- Overall (STATE)
- 15 Strongly Tenant-Friendly
- State New York
- 15 Strongly Tenant-Friendly · D+10
- County
- — inherits STATE
- City
- — inherits STATE
ZIP-level market 12077
- Home prices YoY
- -18.3%
- Active inventory
- 25
- Price-to-rent
- 9.5×
Monthly cashflow live
- Estimated rent
- $2,183 medium interval (Pro) →
- Mortgage (P&I)
- −$1,306
- Tax from tax record
- −$343 /mo · $4,116/yr
- Insurance
- −$104
- HOA
- −$0
- Lot rent
- −$0
- Vacancy / Maint / Mgmt
- −$458
- Net cashflow
- $-28
Break-even live
Sensitivity live
| Price | -10% $113 | -5% $42 | +0% $-28 | +5% $-99 | +10% $-169 |
|---|---|---|---|---|---|
| Rent | -10% $-201 | -5% $-114 | +0% $-28 | +5% $58 | +10% $144 |
| Rate | -1.0pp $97 | -0.5pp $35 | base $-28 | +0.5pp $-93 | +1.0pp $-158 |
UW: 25.0% down · 7.5% · 30yr · 1.5% tax · 5.0% vac · 8.0% maint · 8.0% mgmt
Financing live
Cash to close
- Down payment
- $62,250
- Closing costs
- $7,470
- Reserves months
- —
- Total cash needed
- —
Loan-product check · same deal, 3 products live
Conventional
25% down · 7.5% · 30yr
- Down + closing
- —
- Monthly P&I
- —
- Monthly cashflow
- —
- DSCR
- —
- Eligible?
- —
Personal DTI + credit; lowest rate.
DSCR
20% down · 8.5% · 30yr
- Down + closing
- —
- Monthly P&I
- —
- Monthly cashflow
- —
- DSCR
- —
- Eligible?
- —
No personal income docs; deal must DSCR.
Hard money
10% down · 12.0% · 12mo
- Down + closing
- —
- Monthly P&I
- —
- Monthly cashflow
- —
- DSCR
- —
- Eligible?
- —
Short-term bridge; refi at stabilization.
Rent comps 3 comps
| Address | Beds | Baths | Sqft | Rent | $/sqft | DOM | Units | Dist |
|---|---|---|---|---|---|---|---|---|
| 4 Weiser St Glenmont, NY | 3.0 | 1.0 | 988 | $2,700 | $2.73 | 23d | 1 | 1.05mi |
| 371 Route 9W Glenmont, NY | 1.0–2.0 | 1.0–2.0 | 937 | $1,749 | $1.87 | 16d | 1 | 1.26mi |
| 7 Patterson Dr Glenmont, NY | 2.0 | 1.0–1.5 | 1146 | $1,992 | $1.74 | 16d | 1 | 1.33mi |
Listing history 8 events
-
2026-06-23days on market $249,000 Active 11 DOM
-
2026-06-22days on market $249,000 Active 10 DOM
-
2026-06-18days on market $249,000 Active 7 DOM
-
2026-06-17days on market $249,000 Active 6 DOM
-
2026-06-16days on market $249,000 Active 5 DOM
-
2026-06-15days on market $249,000 Active 4 DOM
-
2026-06-14remarks 162-char remark
-
2026-06-14$249,000 Active 2 DOM
ⓘ Source: listings_history table (triggers on properties + properties_extension) + one-shot
backfill from property_details.listing_events for pre-trigger history.
Tax reassessment forecast NY · Partial reset (capped growth)
- Current annual tax
- $4,116 · $343/mo
- Projected year-2 tax
- $4,162 · $347/mo
- Expected delta
- +$46/yr (+$4/mo · 1.1%)
ⓘ Screening estimate from a state-policy table — verify with the county assessor before closing.
Climate risk First Street
- Flood 1/10 Low FEMA zone X (unshaded) · 0% chance over 30 yrs
- Wildfire 2/10 Low
- Heat 4/10 Moderate 7 d/yr ≥99°F today · 16 d/yr by 30 yrs out
- Wind 3/10 Moderate 7% chance of damaging wind over 30 yrs
- Air quality 1/10 Low 0 unhealthy d/yr today · 0 by 30 yrs out
Nearby sold comps map
Loading sold comps map…
Walkable amenities ~0.75 mi
Loading nearby amenities…
Taxation est. · year 1
- Rental income
- $26,193
- − Mortgage interest
- −$13,948
- − Property taxes
- −$4,116
- − Insurance
- −$1,245
- − Repairs & maintenance
- −$2,095
- − Management
- −$2,095
- − Depreciation
- −$7,244
- Taxable loss
- −$4,550
- Est. tax savings @ 24.0%
- +$1,092
- After-tax cash flow
- $755/yr
For passive investors: Depreciation is non-cash, so a rental often shows a tax loss while cash-flowing — sheltering income. Rental losses are passive: they offset passive income freely, and up to $25,000/yr can offset ordinary (W-2) income if you actively participate and your MAGI is under $100k (phasing out to $0 by $150k); unused losses carry forward. On sale, claimed depreciation is recaptured at up to 25%, and gains may owe capital-gains tax (a 1031 exchange can defer both). Figures are a year-1 estimate at your 24.0% rate — not tax advice; consult a CPA.
Schools (NCES district)
- District
- Bethlehem Central School District
- NCES district ID
- 3604710
- Math proficiency
- 70% ▼ -8.00%
- Reading proficiency
- 74% ▲ 7.00%
- Median HH income
- $94,967
- Composite
- 65.31/100
- National rank
- #488
- State rank
- #90 of 590 in NY
Livability — Albany
- Score
- 79/100
- State rank
- #129
- US rank
- #2083
Category grades
Schools grade is shown separately in the Schools card above.
Census & demographics
- City population
- 116,921
- Population (ZIP)
- 6,733
Population outlook (Albany County) Hauer SSP2
- Today (2025)
- 320,794 people
- By 2030
- 327,401 · +2.1%
- By 2040
- 338,218 · +5.4%
- By 2050
- 348,467 · +8.6%
- By 2075
- 381,693 · +19.0%
- By 2100
- 393,809 · +22.8%
Race, ethnicity, and origin ACS 2023
- Neighborhood character
- Predominantly White (82%)
- Race & ethnicity
- White 82% Asian 6% Hispanic / Latino 6% Black 5% Two or more races 3%
- Hispanic origin (detail)
- Mexican 3% Puerto Rican 2%
- Common ancestry
- Scotch-Irish 4% Romanian 4% Italian 4%
- Foreign-born
- 9% · Canada, China
- Languages at home
- 86% English-only · German/W. Germanic 3% Spanish 3% Other Indo-European 3%
Political lean MEDSL · Albany
- 2024 margin
- Strong D (+25.8) · D 62.9% · R 37.1%
- 2008→2024 swing
- -3.6pp toward R · 2008: 29.4pp · 2024: 25.8pp
- All cycles
- 2024: D+25.8 2020: D+31.4 2016: D+24.3 2012: D+31.0 2008: D+29.4
Not yet ingested
- Civics
- —
Market trends
- HPI YoY
- ▼ -65.41%
- Current HPI
- 291.4513
- Rent YoY
- —
- Metro
- —
- State GDP YoY
- ▲ 2.60%
- F500 in state
- 92
Industry mix (Fortune 500 HQ in NY)
| Industry | F500 HQs | Revenue |
|---|---|---|
| Financial Services | 10 | $950B |
|
||
| Consumer Goods | 9 | $162B |
|
||
| Insurance | 4 | $225B |
|
||
| Telecommunications | 2 | $144B |
|
||
| Pharmaceuticals | 2 | $112B |
|
||
| Media / Entertainment | 2 | $69B |
|
||
Price history
+221.3% since first listed2 events — show timeline
- 2026-06-11 Listed $249,000 Global MLS
- 2004-11-05 Sold (Public Records) $77,500 Public Records
Property tax history
+5.4%/yrLatest (2025): $4,116 · +1.1% YoY. Source: county tax records.
Cash-flow waterfall
monthlySold comps — $/sqft
last 12 mo · ≤1 miLoading sold comps…