 Duplex
29253 Des Moines St · Wayland, MO
Flood risk 4/10 · Minor
- FEMA flood zone
- X (unshaded)
- Chance of flooding over 30 yrs
- 0.22%
- Est. flood insurance / yr
- $473 – $860
Fire risk 1/10 · Minimal
- Est. fire insurance / yr
- $1,054 – $1,958
Heat risk 3/10 · Minor
- Hot days now (above 106°F)
- 7 days/yr
- Hot days in 30 yrs
- 16 days/yr
Wind risk 2/10 · Minimal
- Chance of severe wind over 30 yrs
- 0.0%
Air-quality risk 2/10 · Minimal
- Unhealthy air days now
- 1 days/yr
- Unhealthy air days in 30 yrs
- 1 days/yr
Risk factors via First Street. Map © Google.
Why this score? — see what drove the B grade
The composite is a weighted blend of 9 inputs, each scored 0–100. Each bar is that input's sub-score; the figure is the points it added to the 100-point composite (weight × sub-score).
- Cash flow +29.4/30.0
- DSCR +10.0/10.0
- 1% rule +8.2/10.0
- ARV discount +7.5/15.0
- Appreciation +5.0/10.0
- Condition / age +4.0/5.0
- Schools +2.6/10.0
- Livability +2.6/5.0
- Rent growth +2.5/5.0
$155,000
🖨 Deal sheet 📄 Offer letter ✓ Due diligence
Multi-family units
County records classify this as Multi-Family (2-4 Unit). Listing-text estimate: 2 units. confirmed
Listing remarks
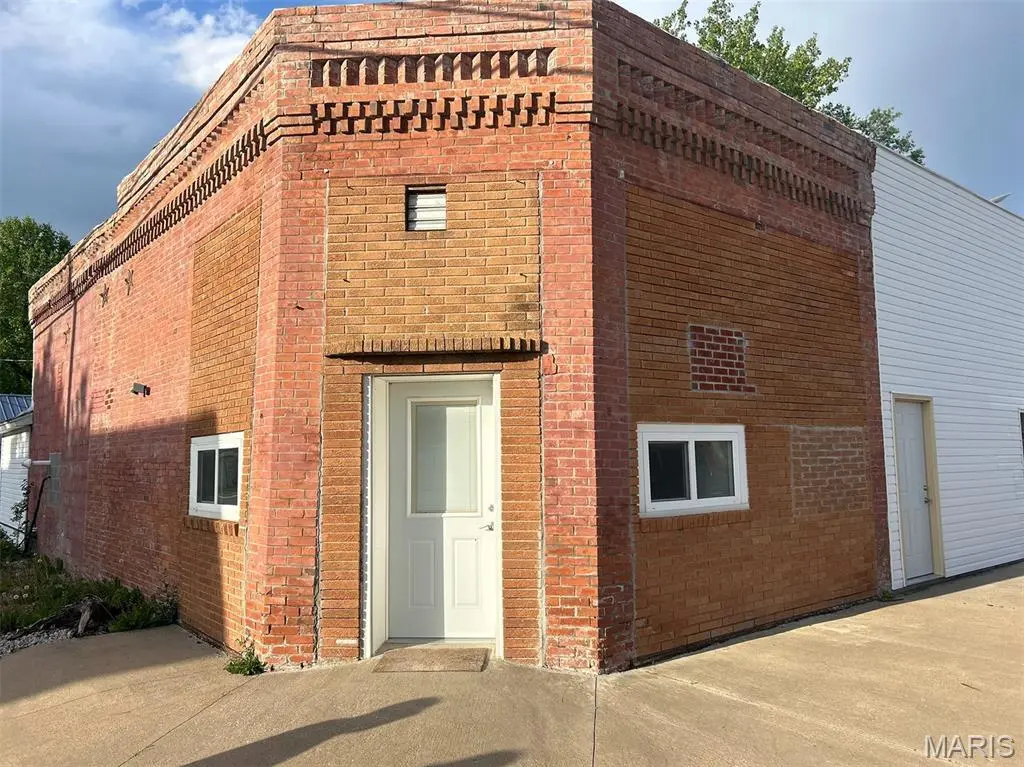
Brick building apartments right in the heart of Wayland, Missouri that date back into the 1900s! Each unit is 2,246 square feet with a single level. One unit is 3-bedrooms and 1-bath while the other is 2-bedroom and -1-bath. They were recently renovated with all new drywall, laminate flooring, cabinets, stove, refrigerator, bathroom, and new heating and air in one unit! Both apartments offer finished kitchens and living rooms for comfortable living and dining! Electric heating and air in Apartment B and natural gas furnace in Apartment A. Both apartments are currently rented and are move-in-ready without lifting a finger! Don't miss out on this beautiful investment property!
Key facts
- Move-in-ready
- Finished kitchens
- Brick building
Tags
Property features AI
Finance
- Other: Private ownership
- Financial info: All units leased (2 of 2)
Exterior
- Parking: No garage; On-street parking
- Utilities: Public water; Sewer connected; Natural gas connected; Electricity connected (220 volts available)
- Home design: Residential income property; 2–4 unit property (two units); Apartment building / multi-family (single building)
- Construction: Brick and concrete construction; Concrete roof
- Exterior features: City lot; Asphalt road frontage on a city street
Interior
- Kitchen: Electric cooktop; Electric oven; Refrigerator
- Bedrooms: One 3-bedroom unit; One 2-bedroom unit
- Flooring: Laminate flooring
- Bathrooms: Each unit has 1 bathroom
- Heating & cooling: Electric heating; Electric cooling
- Interior features: Updated/remodeled condition; Electric water heater
- Laundry & utility: 220-volt electric service
Neighborhood map
What this means for you Summary
Snapshot
- This is a 1×2bd/1.0ba + 1×3bd/1.0ba units multifamily listed at $155k. Condition is rated good.
Deal economics
- At list price, monthly cash flow is $551 ($7k/yr) — positive. Per door: $275/mo.
- The deal already cash-flows at list — no discount required.
- Meets the 1% rule at list price ($2k rent vs $155k).
- Recommended offer: $150k (3.0% below list) — sets the bar for market timing.
Location & tenants
- Location reads 52/100 on livability (#868 in MO) — a working-class tenant base; expect higher turnover. Strengths: cost of living A+, crime A; Watch: health & safety C-, amenities F, commute F.
- Clark County R-I (rural): math 29% / reading 32% proficiency, ranked #268 of 324 in MO (top 83%) — families likely to look elsewhere, expect single-tenant / working-renter base with shorter leases.
- Zoned schools: Black Hawk Elem. (math 32% / reading 27%, grade F, #813 of 1,115 statewide, top 75%, 365 students, 56% FRL); Clark Co. High (math 27% / reading 42%, grade F, #321 of 521 statewide, top 67%, 308 students, 46% FRL).
- Market conditions: 1 active listings in the ZIP; 2 units permitted in Clark County in 2024 (0 in 5+ unit buildings).
Forward outlook
- In year one you build about $6k of equity ($1k loan paydown + $5k appreciation (3.0% local appreciation)).
- Clark County population projected at -26% by 2050 — secular population decline; favor cash flow + early exit over multi-decade hold.
- At projected returns (3.0% appreciation + 3.0% rent growth), your $43k cash investment doubles in ~4 years — after that, you're playing with house money.
- By year 6, paydown + projected appreciation supports a ~$30k cash-out refi (75% LTV) — recoverable capital for the next deal without selling this one.
Negotiation context
- It's been on market 49 days — a 3% lower offer ($150k) is reasonable based on typical stale-listing flexibility.
- 2 sale attempts with the ask held roughly flat each time — persistent listings suggest the price (not the market) is what's stuck; bring a comps-based counter.
Risks & watch-outs
- Watch-outs: built in 1900 — expect roof / HVAC / electrical / plumbing capex.
Questions for the listing agent
- It's been on market 49 days. Have you received any prior offers? Is the seller open to a 3% concession, seller financing, or rate buy-down credit?
- Can we see the unit-by-unit rent roll, current vacancy, and any below-market leases? What's the average tenancy length?
- What capital expenditures (roof, boiler, parking lot, exteriors) have been made in the last 5 years, and what's planned in the next 2?
- Built in 1900 — when were the roof, HVAC, electrical panel, plumbing, and water heater last replaced?
- Is there a deadline driving the sale (1031 exchange, divorce, estate, relocation)? That informs how much negotiation room exists.
- Schools are F-rated, which usually means shorter tenancies and higher turnover. Who's the typical renter profile here, and what's been the actual vacancy rate?
- What's the average days-on-market for RENTAL listings here right now (not sales)? A rising rental-DOM trend means longer vacancies and softer asking-rent achievability than the comps imply.
- What's the recent tenant-quality profile in this submarket — average credit score on applications, eviction rate, late-payment / NSF rate, and stable-employment percentage? A property-management company in the area should have these aggregated.
- How much new apartment / multifamily construction is in the pipeline within 1–3 miles? Heavy new supply (>2% of stock underway) typically softens rents 12–24 months out; light construction supports rent growth.
Investment metrics
- 1% rule
- 1.32% ✓
- Cap rate
- 10.56%
- Cash-on-cash
- 15.23%
- DSCR
- 1.68
- GRM
- 6.3
CMA / ARV
No comps found within radius.
Projected returns pro-forma
3.0% appreciation · 3.0% rent growth · sell at horizon
- IRR
- 21.8%
- Equity multiple
- 2.24×
- Total profit
- $53,777
- Equity at exit
- $69,695
- IRR
- 22.8%
- Equity multiple
- 4.28×
- Total profit
- $142,354
- Equity at exit
- $107,408
Cash invested: $43,400 (down + closing). Projections, not guarantees.
Landlord ↔ Tenant lean methodology
- Overall (STATE)
- 81 Strongly Landlord-Friendly
- State Missouri
- 81 Strongly Landlord-Friendly · R+10
- County
- — inherits STATE
- City
- — inherits STATE
ZIP-level market 63472
- Active inventory
- 1
- Price-to-rent
- 13.0×
Monthly cashflow live
- Estimated rent
- $2,053 medium interval (Pro) →
- Mortgage (P&I)
- −$813
- Tax est. 1.5%
- −$194 /mo · $2,325/yr
- Insurance
- −$65
- HOA
- −$0
- Vacancy / Maint / Mgmt
- −$431
- Net cashflow
- $551
Break-even live
2-unit breakdown (identical units grouped — click to expand)
| Units | Beds | Baths | Est. rent |
|---|---|---|---|
| 1× unit | 2 | 1 | $994 |
| 1× unit | 3 | 1 | $1,059 |
| Total (2 units) | $2,053 | ||
UW: 25.0% down · 7.5% · 30yr · 1.5% tax · 5.0% vac · 8.0% maint · 8.0% mgmt
Financing live
Cash to close
- Down payment
- $38,750
- Closing costs
- $4,650
- Reserves months
- —
- Total cash needed
- —
Loan-product check · same deal, 3 products live
Conventional
25% down · 7.5% · 30yr
- Down + closing
- —
- Monthly P&I
- —
- Monthly cashflow
- —
- DSCR
- —
- Eligible?
- —
Personal DTI + credit; lowest rate.
DSCR
20% down · 8.5% · 30yr
- Down + closing
- —
- Monthly P&I
- —
- Monthly cashflow
- —
- DSCR
- —
- Eligible?
- —
No personal income docs; deal must DSCR.
Hard money
10% down · 12.0% · 12mo
- Down + closing
- —
- Monthly P&I
- —
- Monthly cashflow
- —
- DSCR
- —
- Eligible?
- —
Short-term bridge; refi at stabilization.
Listing history 15 events
-
2026-06-18days on market $155,000 Active 49 DOM
-
2026-06-17days on market $155,000 Active 48 DOM
-
2026-06-16days on market $155,000 Active 47 DOM
-
2026-06-15days on market $155,000 Active 46 DOM
-
2026-06-13days on market $155,000 Active 44 DOM
-
2026-06-12days on market $155,000 Active 43 DOM
-
2026-06-09days on market $155,000 Active 40 DOM
-
2026-06-08days on market $155,000 Active 39 DOM
-
2026-06-07days on market $155,000 Active 38 DOM
-
2026-06-04days on market $155,000 Active 34 DOM
-
2026-06-02days on market $155,000 Active 33 DOM
-
2026-06-01days on market $155,000 Active 32 DOM
-
2026-05-31days on market $155,000 Active 31 DOM
-
2026-04-30status Active 685-char remark
-
2026-04-29$155,000 Active 685-char remark
ⓘ Source: listings_history table (triggers on properties + properties_extension) + one-shot
backfill from property_details.listing_events for pre-trigger history.
Climate risk First Street
- Flood 4/10 Moderate FEMA zone X (unshaded) · 22% chance over 30 yrs
- Wildfire 1/10 Low
- Heat 3/10 Moderate 7 d/yr ≥106°F today · 16 d/yr by 30 yrs out
- Wind 2/10 Low 0% chance of damaging wind over 30 yrs
- Air quality 2/10 Low 1 unhealthy d/yr today · 1 by 30 yrs out
Nearby sold comps map
Loading sold comps map…
Walkable amenities ~0.75 mi
Loading nearby amenities…
Taxation est. · year 1
- Rental income
- $24,636
- − Mortgage interest
- −$8,682
- − Property taxes
- −$2,325
- − Insurance
- −$775
- − Repairs & maintenance
- −$1,971
- − Management
- −$1,971
- − Depreciation
- −$4,509
- Taxable income
- $4,403
- Est. tax owed @ 24.0%
- −$1,057
- After-tax cash flow
- $5,552/yr
For passive investors: Depreciation is non-cash, so a rental often shows a tax loss while cash-flowing — sheltering income. Rental losses are passive: they offset passive income freely, and up to $25,000/yr can offset ordinary (W-2) income if you actively participate and your MAGI is under $100k (phasing out to $0 by $150k); unused losses carry forward. On sale, claimed depreciation is recaptured at up to 25%, and gains may owe capital-gains tax (a 1031 exchange can defer both). Figures are a year-1 estimate at your 24.0% rate — not tax advice; consult a CPA.
Condition & rehab AI · 13 photos
This multi-family property is in good condition with recent renovations, making it move-in ready and suitable for both resale and rental purposes.
Value-add opportunities
- Both Painting the exterior brick — Enhances curb appeal and can increase both resale and rental value.
- Both Landscaping the front yard — Improves curb appeal and can increase both resale and rental value.
Renovation cost estimate screening
Value-add ROI direction
- Both Painting the exterior brick — Enhances curb appeal and can increase both resale and rental value. ↑
- Both Landscaping the front yard — Improves curb appeal and can increase both resale and rental value. ↑
ⓘ Cost ranges are severity-bucket heuristics (US national rule-of-thumb). Get contractor quotes + a written scope before underwriting a rehab budget.
Schools (NCES district)
- District
- Clark County R-I
- NCES district ID
- 2916380
- Math proficiency
- 29% ▼ -8.00%
- Reading proficiency
- 32% ▼ -11.00%
- Median HH income
- $41,836
- Composite
- 25.83/100
- National rank
- #7355
- State rank
- #268 of 324 in MO
Livability — Wayland
- Score
- 52/100
- State rank
- #868
- US rank
- #25122
Category grades
Schools grade is shown separately in the Schools card above.
Census & demographics
- Census place
- Wayland, MO
- Population (ZIP)
- 472
Population outlook (Clark County) Hauer SSP2
- Today (2025)
- 6,211 people
- By 2030
- 5,858 · -5.7%
- By 2040
- 5,211 · -16.1%
- By 2050
- 4,620 · -25.6%
- By 2075
- 3,595 · -42.1%
- By 2100
- 2,927 · -52.9%
Race, ethnicity, and origin ACS 2023
- Neighborhood character
- Predominantly White (100%)
- Race & ethnicity
- White 100%
- Common ancestry
- Iranian 2%
Political lean MEDSL · Clark
- 2024 margin
- Solid R (+61.5) · D 18.8% · R 80.4%
- 2008→2024 swing
- -55.5pp toward R · 2008: -6.1pp · 2024: -61.5pp
- All cycles
- 2024: R+61.5 2020: R+58.8 2016: R+52.3 2012: R+10.3 2008: R+6.1
Not yet ingested
- Civics
- —
Market trends
- HPI YoY
- —
- Current HPI
- —
- Rent YoY
- —
- Metro
- —
- State GDP YoY
- ▲ 1.84%
- F500 in state
- 20
Industry mix (Fortune 500 HQ in MO)
| Industry | F500 HQs | Revenue |
|---|---|---|
| Healthcare | 1 | $163B |
|
||
| Insurance | 1 | $21B |
|
||
| Industrial Technology | 1 | $17B |
|
||
| Retail | 1 | $16B |
|
||
| Industrial Distribution | 1 | $10B |
|
||
| Utilities | 1 | $9B |
|
||
Price history
2 events — show timeline
- 2026-04-30 Relisted — MARIS as Distributed by MLS Grid
- 2026-04-29 Listed $155,000 MARIS as Distributed by MLS Grid
Cash-flow waterfall
monthlySold comps — $/sqft
last 12 mo · ≤1 miLoading sold comps…