1600 NE 1st Ave #1605 · Miami, FL
Flood risk 5/10 · Moderate
- FEMA flood zone
- X (unshaded)
- Chance of flooding over 30 yrs
- 0.24%
- Est. flood insurance / yr
- $507 – $1,088
Fire risk 1/10 · Minimal
- Est. fire insurance / yr
- $947 – $1,759
Heat risk 10/10 · Severe
- Hot days now (above 103°F)
- 7 days/yr
- Hot days in 30 yrs
- 28 days/yr
Wind risk 10/10 · Severe
- Chance of severe wind over 30 yrs
- 99.0%
Air-quality risk 2/10 · Minimal
- Unhealthy air days now
- 1 days/yr
- Unhealthy air days in 30 yrs
- 1 days/yr
Risk factors via First Street. Map © Google.
Why this score? — see what drove the F grade
The composite is a weighted blend of 9 inputs, each scored 0–100. Each bar is that input's sub-score; the figure is the points it added to the 100-point composite (weight × sub-score).
- ARV discount +7.5/15.0
- Cash flow +6.0/30.0
- Schools +4.2/10.0
- Livability +3.9/5.0
- 1% rule +3.7/10.0
- Appreciation +3.7/10.0
- Rent growth +2.7/5.0
- Condition / age +2.5/5.0
- DSCR +0.4/10.0
$479,000
🖨 Deal sheet (PDF) 📄 Offer letter ✓ Due diligence
Listing remarks MLS
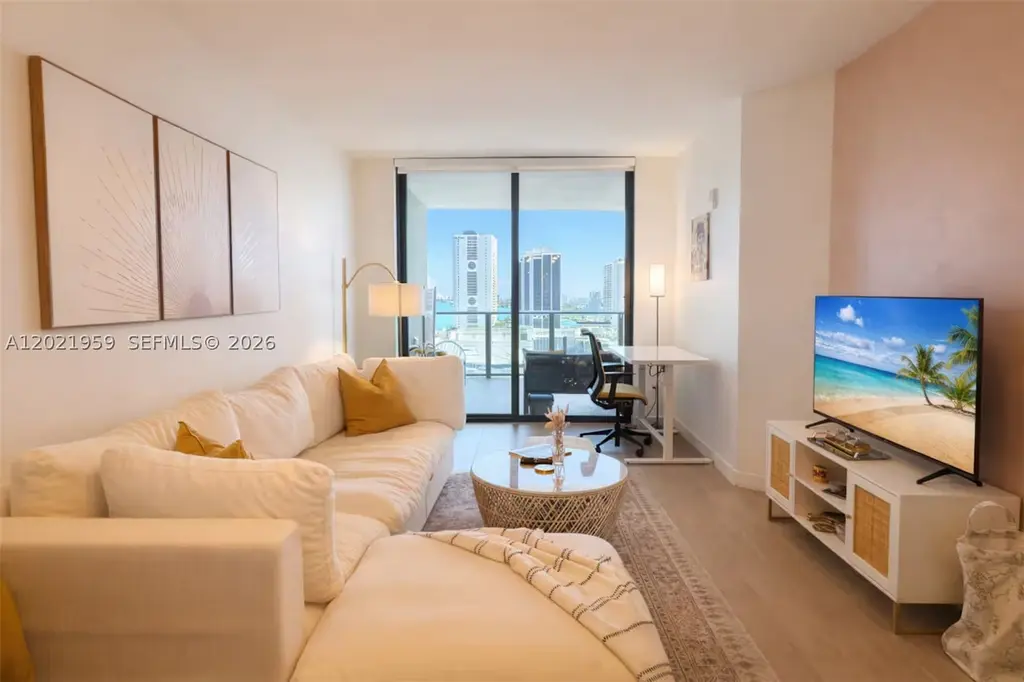
Fabulous 1 bedroom plus den apartment at Canvas with an open living floor plan. Live right in the heart of the Arts & Entertainment district of Miami, while enjoying the stunning views of the city and the bay from your balcony. The apartment has top-of-the-line finishes, a gourmet-quality kitchen, and floor-to-ceiling windows. Easily convert this into a 2 bedroom! Amenity-rich lifestyle. 30,000 sq. ft. amenity deck with a sunrise and sunset pool, a 3,000 sq. ft. cutting edge fitness center, zen spa/sauna, yoga garden, glass-enclosed racquetball court, and more a true club experience complementing the rooftop with more features to enjoy - a sky plunge pool, stunning city and bay views. You can live or rent 12 times a year!! JUST DRASTICALLY REDUCED! BEST PRICED IN THE BUILDING!
Key facts
- $851 HOA
- Garage
- Community pool
Property features AI
Finance
- Other: Association-maintained heated pool
- Financial info: Pets allowed (conditional; restrictions may apply)
- HOA & community: Monthly association fee; Association fee covers common areas, insurance, pool(s), sewer, security, trash and water; Association amenities include billiard room, business center, clubhouse, fitness center, pool, sauna, spa/hot tub and elevators
Exterior
- Parking: Covered parking; Detached 1-car garage; One designated parking space
- Security: Secured lobby
- Utilities: Has water; Has sewer; Has power
- Home design: High-rise building (38 stories); Entry on level 16; Attached property; Has a view
- Construction: Block construction; Resale property
- Exterior features: Balcony; Open balcony/patio; Bay front waterfront
Interior
- Kitchen: Electric range; Dishwasher; Refrigerator
- Flooring: Ceramic tile; Tile
- Bathrooms: 1 full bathroom; 1 half bathroom
- Heating & cooling: Central heating; Central air conditioning
- Interior features: Built-in features; Walk-in closet(s)
- Laundry & utility: Washer; Dryer
Neighborhood map
What this means for you Summary
Snapshot
- This is a 1-bed/1.0-bath condo listed at $479k.
Deal economics
- At list price, monthly cash flow is $-910 ($-11k/yr) — negative.
- To cash-flow at today's rent, offer at most $318k (33.6% below list).
- To meet the 1% rule (rent ≥ 1% of price), the offer needs to be $418k (12.7% below list).
- Recommended offer: $318k (33.6% below list) — sets the bar for cash-flow.
- Cap rate 4.0% vs local median 1.9% in Miami — top-decile yield for the area; either an underpriced asset or a hidden risk that comps aren't pricing in. Stress-test before assuming the spread holds.
Location & tenants
- Location reads 78/100 on livability (#177 in FL, #2,724 nationally) — a middle-class / working-renter tenant base. Strengths: amenities A+, commute A+, health & safety A+; Watch: employment C-, crime F, cost of living F.
- Miami-Dade (suburban): math 45% / reading 54% proficiency, ranked #40 of 73 in FL (top 55%) — families likely to look elsewhere, expect single-tenant / working-renter base with shorter leases; 64% free/reduced lunch — lower-income household profile, screen leases tightly.
- Zoned schools: Phyllis Wheatley Elementary School (math 17% / reading 17%, grade F, #2,121 of 2,144 statewide, top 99%, 189 students, 88% FRL); Jose De Diego Middle School (math 20% / reading 24%, grade F, #549 of 571 statewide, top 97%, 868 students, 68% FRL); Booker T. Washington Senior High (math 12% / reading 19%, grade F, #604 of 667 statewide, top 91%, 1,014 students, 60% FRL).
- Zoned-school proficiency averages 18% at this address vs 50% district-wide (-31 pts) — the specific schools serving this property underperform the Miami-Dade average; the district grade overstates school quality for this exact location.
- Market conditions: Rents flat; 882 active listings in the ZIP; 3 comparable units currently listed for rent nearby; rentals leasing fast (median 1d on market — plan ~1-2 weeks tenant-placement turnaround); solid renter incomes; 10,051 units permitted in Miami-Dade County in 2024 (7,758 in 5+ unit buildings).
- At $4,181/mo this rent would consume 46% of the median local household income ($109k/yr) (locally 2260% of renters already pay >50% of income on rent) — very limited rent-growth headroom before tenants either downsize or default.
Forward outlook
- Local home prices are declining (-2.5%/yr); year-one equity from $3k of loan paydown is wiped out by about $12k of value loss. Plan a longer hold.
- Miami-Dade County population projected at +28% by 2050 — long-run rental-demand tailwind backs the buy-and-hold thesis.
Negotiation context
- Only 10 days on market — expect competitive offers; lowballing is unlikely to land.
- 4 sale attempts since 6y ago with the ask held roughly flat each time — persistent listings suggest the price (not the market) is what's stuck; bring a comps-based counter.
Risks & watch-outs
- Watch-outs: HOA is 20% of rent.
- Climate carrying-cost: moderate flood risk; severe wind risk, 99% chance of damaging wind over 30y; extreme-heat days projected 7→28/yr by 2055 (HVAC capex compounding) — expect insurance premiums to compound above CPI over the hold.
Questions for the listing agent
- What do current leases actually rent for vs. the listed asking? Can we see a recent rent roll and the last 12 months of T-12 income?
- What does the HOA fee cover, when was the last increase, and are there any pending special assessments or reserve-fund shortfalls?
- Any open or pending special assessments — roof, HVAC, plumbing, elevator, façade? What's the per-unit balance and payoff schedule, and is the seller paying it off at close or rolling it to the buyer?
- Is there a deadline driving the sale (1031 exchange, divorce, estate, relocation)? That informs how much negotiation room exists.
- Schools are B-rated — typically a magnet for longer-tenancy family renters. What's the average tenant stay here, and is there a school-zone premium baked into asking?
- Crime grade is F in this area — have there been break-ins, vandalism, or insurance claims at this property in the last 3 years? What carrier currently insures it and at what premium?
- The area grade is low — what's the realistic commute time and amenity access for the typical tenant pool here? Any planned neighborhood developments (good or bad) we should know about?
- What's the average days-on-market for RENTAL listings here right now (not sales)? A rising rental-DOM trend means longer vacancies and softer asking-rent achievability than the comps imply.
- What's the recent tenant-quality profile in this submarket — average credit score on applications, eviction rate, late-payment / NSF rate, and stable-employment percentage? A property-management company in the area should have these aggregated.
- How much new apartment / multifamily construction is in the pipeline within 1–3 miles? Heavy new supply (>2% of stock underway) typically softens rents 12–24 months out; light construction supports rent growth.
Investment metrics
- 1% rule
- 0.87% ✗
- Cap rate
- 4.01%
- Cash-on-cash
- -8.14%
- DSCR
- 0.64
- GRM
- 9.5
CMA / ARV
No comps found within radius.
Projected returns pro-forma
-2.52% appreciation · 0.74% rent growth · sell at horizon
- IRR
- -29.2%
- Equity multiple
- -0.00×
- Total profit
- $-134,708
- Equity at exit
- $81,593
- IRR
- -35.9%
- Equity multiple
- -0.62×
- Total profit
- $-217,604
- Equity at exit
- $59,102
Cash invested: $134,120 (down + closing). Projections, not guarantees.
Landlord ↔ Tenant lean methodology
- Overall (STATE)
- 87 Strongly Landlord-Friendly
- State Florida
- 87 Strongly Landlord-Friendly · R+3
- County
- — inherits STATE
- City
- — inherits STATE
ZIP-level market 33132
- Home prices YoY
- -0.8%
- Rents YoY
- 0.7%
- Active inventory
- 882
- Price-to-rent
- 9.5×
Monthly cashflow live
- Estimated rent
- $4,181 medium interval (Pro) →
- Mortgage (P&I)
- −$2,512
- Tax from tax record
- −$651 /mo · $7,810/yr
- Insurance
- −$200
- HOA
- −$851
- Vacancy / Maint / Mgmt
- −$878
- Net cashflow
- $-910
Break-even live
Sensitivity live
| Price | -10% $-639 | -5% $-775 | +0% $-910 | +5% $-1,046 | +10% $-1,181 |
|---|---|---|---|---|---|
| Rent | -10% $-1,241 | -5% $-1,075 | +0% $-910 | +5% $-745 | +10% $-580 |
| Rate | -1.0pp $-669 | -0.5pp $-788 | base $-910 | +0.5pp $-1,034 | +1.0pp $-1,161 |
UW: 25.0% down · 7.5% · 30yr · 1.5% tax · 5.0% vac · 8.0% maint · 8.0% mgmt
Financing live
Cash to close
- Down payment
- $119,750
- Closing costs
- $14,370
- Reserves months
- —
- Total cash needed
- —
Loan-product check · same deal, 3 products live
Conventional
25% down · 7.5% · 30yr
- Down + closing
- —
- Monthly P&I
- —
- Monthly cashflow
- —
- DSCR
- —
- Eligible?
- —
Personal DTI + credit; lowest rate.
DSCR
20% down · 8.5% · 30yr
- Down + closing
- —
- Monthly P&I
- —
- Monthly cashflow
- —
- DSCR
- —
- Eligible?
- —
No personal income docs; deal must DSCR.
Hard money
10% down · 12.0% · 12mo
- Down + closing
- —
- Monthly P&I
- —
- Monthly cashflow
- —
- DSCR
- —
- Eligible?
- —
Short-term bridge; refi at stabilization.
Rent comps 3 comps
| Address | Beds | Baths | Sqft | Rent | $/sqft | DOM | Units | Dist |
|---|---|---|---|---|---|---|---|---|
| 601 NE 1st Ave Unit 1227496P Miami, FL | 3.0 | 1.0–3.0 | 904 | $8,354 | $9.24 | 1d | 4 | 0.72mi |
| 2900 Biscayne Blvd Miami, FL | 3.0 | 1.0–3.5 | 1260 | $8,110 | $6.44 | 4d | 13 | 0.96mi |
| 555 NE 34th St Miami, FL | 1.0–4.0 | 1.5–4.0 | 2653 | $3,780 | $1.42 | 0d | 19 | 1.32mi |
HOA detail condo
- Monthly dues
- $851 · $10,212/yr
- Likely covers
- poolgym
- Assessments
- None detected in remarks — confirm with the listing agent.
Listing history 7 events
-
2026-06-21days on market $479,000 Active 10 DOM
-
2026-06-18days on market $479,000 Active 7 DOM
-
2026-06-17days on market $479,000 Active 6 DOM
-
2026-06-16days on market $479,000 Active 5 DOM
-
2026-06-15days on market $479,000 Active 4 DOM
-
2026-06-13remarks 689-char remark
-
2026-06-13$479,000 Active 2 DOM
ⓘ Source: listings_history table (triggers on properties + properties_extension) + one-shot
backfill from property_details.listing_events for pre-trigger history.
Tax reassessment forecast FL · Resets to sale price
- Current annual tax
- $7,810 · $651/mo
- Projected year-2 tax
- $7,810 · $651/mo
- Expected delta
- $0/yr ($0/mo · 0.0%)
ⓘ Screening estimate from a state-policy table — verify with the county assessor before closing.
Climate risk First Street
- Flood 5/10 Major FEMA zone X (unshaded) · 24% chance over 30 yrs
- Wildfire 1/10 Low
- Heat 10/10 Extreme 7 d/yr ≥103°F today · 28 d/yr by 30 yrs out
- Wind 10/10 Extreme 99% chance of damaging wind over 30 yrs
- Air quality 2/10 Low 1 unhealthy d/yr today · 1 by 30 yrs out
Nearby sold comps map
Loading sold comps map…
Walkable amenities ~0.75 mi
Loading nearby amenities…
Taxation est. · year 1
- Rental income
- $50,175
- − Mortgage interest
- −$26,831
- − Property taxes
- −$7,810
- − Insurance
- −$2,395
- − Repairs & maintenance
- −$4,014
- − Management
- −$4,014
- − HOA
- −$10,212
- − Depreciation
- −$13,935
- Taxable loss
- −$19,037
- Est. tax savings @ 24.0%
- +$4,569
- After-tax cash flow
- $-6,354/yr
For passive investors: Depreciation is non-cash, so a rental often shows a tax loss while cash-flowing — sheltering income. Rental losses are passive: they offset passive income freely, and up to $25,000/yr can offset ordinary (W-2) income if you actively participate and your MAGI is under $100k (phasing out to $0 by $150k); unused losses carry forward. On sale, claimed depreciation is recaptured at up to 25%, and gains may owe capital-gains tax (a 1031 exchange can defer both). Figures are a year-1 estimate at your 24.0% rate — not tax advice; consult a CPA.
Schools (NCES district)
- District
- Miami-Dade
- NCES district ID
- 1200390
- Math proficiency
- 45% ▼ -16.00%
- Reading proficiency
- 54% ▼ -5.00%
- Median HH income
- $43,928
- Composite
- 41.76/100
- National rank
- #3397
- State rank
- #40 of 73 in FL
Livability — Miami
- Score
- 78/100
- State rank
- #177
- US rank
- #2724
Category grades
Schools grade is shown separately in the Schools card above.
Census & demographics
- Census place
- Miami, FL
- County
- Miami-Dade County · 2,697,751 people
- City population
- 827,308
- Metro
- Miami-Fort Lauderdale-Pompano Beach, FL
- Population (ZIP)
- 20,253
- Household income
- $109,109
- Rent vs Own
- Severe rent burden
- 2260.0
Population outlook (Miami-Dade County) Hauer SSP2
- Today (2025)
- 3,126,439 people
- By 2030
- 3,325,765 · +6.4%
- By 2040
- 3,697,561 · +18.3%
- By 2050
- 4,012,134 · +28.3%
- By 2075
- 4,605,612 · +47.3%
- By 2100
- 4,866,598 · +55.7%
Race, ethnicity, and origin ACS 2023
- Neighborhood character
- Diverse neighborhood (Simpson 0.63)
- Race & ethnicity
- Hispanic / Latino 53% Two or more races 39% White 29% Black 7% Asian 6%
- Hispanic origin (detail)
- Mexican 3% Puerto Rican 4% Cuban 9% Dominican 2% Salvadoran 1%
- Common ancestry
- Estonian 2% Scotch-Irish 2% Romanian 1%
- Foreign-born
- 50% · Canada, Jamaica, Dominican Republic
- Languages at home
- 35% English-only · Spanish 49% Other Indo-European 6% Other Asian/Pacific 2%
Political lean MEDSL · Miami-Dade
- 2024 margin
- R (+11.4) · D 43.9% · R 55.4%
- 2008→2024 swing
- -27.6pp toward R · 2008: 16.1pp · 2024: -11.4pp
- All cycles
- 2024: R+11.4 2020: D+7.3 2016: D+29.6 2012: D+23.7 2008: D+16.1
Not yet ingested
- Civics
- —
Market trends
- HPI YoY
- ▼ -2.52%
- Current HPI
- 294.3744
- Rent YoY
- ▲ 0.74%
- Metro
- Miami-Fort Lauderdale-Pompano Beach, FL
- State GDP YoY
- ▲ 3.28%
- F500 in state
- 36
Industry mix (Fortune 500 HQ in FL)
| Industry | F500 HQs | Revenue |
|---|---|---|
| Industrial Technology | 2 | $29B |
|
||
| Insurance | 2 | $17B |
|
||
| Retail | 1 | $60B |
|
||
| Technology Distribution | 1 | $58B |
|
||
| Homebuilding | 1 | $35B |
|
||
| Technology Manufacturing | 1 | $35B |
|
||
Price history
-7.9% since first listed10 events — show timeline
- 2026-06-11 Listed $479,000 MARMLS
- 2022-04-18 Pending — MARMLS
- 2022-04-18 Sold (MLS) $465,000 MARMLS
- 2022-03-15 Contingent — MARMLS
- 2022-02-25 Price Changed $465,000 MARMLS
- 2021-10-20 Listed $487,000 MARMLS
- 2021-10-18 Listing Removed — MARMLS
- 2021-07-03 Listed $550,000 MARMLS
- 2021-04-13 Listing Removed — MARMLS
- 2020-04-29 Listed $520,000 MARMLS
Property tax history
+3.0%/yrLatest (2025): $7,810 · -8.4% YoY. Source: county tax records.
Cash-flow waterfall
monthlySold comps — $/sqft
last 12 mo · ≤1 miLoading sold comps…