5 Union St · New Baltimore, NY
Flood risk 1/10 · Minimal
- FEMA flood zone
- X
- Chance of flooding over 30 yrs
- 0.0%
- Est. flood insurance / yr
- $507 – $1,088
Fire risk 1/10 · Minimal
- Est. fire insurance / yr
- $691 – $1,283
Heat risk 4/10 · Minor
- Hot days now (above 99°F)
- 7 days/yr
- Hot days in 30 yrs
- 16 days/yr
Wind risk 3/10 · Minor
- Chance of severe wind over 30 yrs
- 6.0%
Air-quality risk 2/10 · Minimal
- Unhealthy air days now
- 0 days/yr
- Unhealthy air days in 30 yrs
- 1 days/yr
Risk factors via First Street. Map © Google.
Why this score? — see what drove the B+ grade
The composite is a weighted blend of 9 inputs, each scored 0–100. Each bar is that input's sub-score; the figure is the points it added to the 100-point composite (weight × sub-score).
- Cash flow +30.0/30.0
- 1% rule +10.0/10.0
- DSCR +10.0/10.0
- Appreciation +10.0/10.0
- ARV discount +7.5/15.0
- Schools +4.8/10.0
- Rent growth +2.5/5.0
- Livability +2.5/5.0
- Condition / age +2.5/5.0
$155,000
🖨 Deal sheet 📄 Offer letter ✓ Due diligence
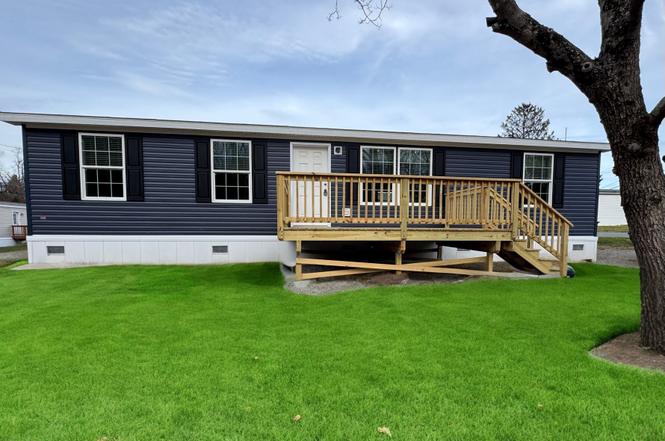
Listing remarks
This charming 3-bedroom, 2 bathroom manufactured home is perfectly situated on prime corner parcel. The welcoming front porch is perfect for enjoying your morning coffee or unwinding in the evenings. Step inside to an open floor plan with a bright airy living area that flows into the dining space and kitchen. The kitchen features modern appliances, ample cabinet and counter space, with a convenient kitchen island. Each bedroom is generously sized, and combines cozy comfort with all the amenities you need for modern living!
Key facts
- Built 2025
- Listed 204 days
Property features AI
Finance
- Financial info: List price $155,000; Active listing (modified Apr 28, 2026)
Exterior
- Utilities: Forced air heating (utility present)
- Home design: Single-family (spec plan named "5 Union")
- Exterior features: Asphalt roof
Interior
- Kitchen: Dishwasher; Microwave; Refrigerator
- Bedrooms: 3 bedrooms
- Bathrooms: 2 full bathrooms
- Heating & cooling: Forced air heating
- Interior features: Dishwasher; Microwave; Refrigerator
Neighborhood map
What this means for you Summary
Snapshot
- This is a 3-bed/2.0-bath manufactured listed at $155k.
Deal economics
- At list price, monthly cash flow is $904 ($11k/yr) — positive.
- The deal already cash-flows at list — no discount required.
- Meets the 1% rule at list price ($2k rent vs $155k).
- Recommended offer: $136k (12.0% below list) — sets the bar for market timing.
Location & tenants
- Location reads: area grade B — affects rentability + tenant quality, not the cash-flow math above.
- Kinderhook Central School District (rural): math 49% / reading 59% proficiency, ranked #294 of 590 in NY (top 50%) — acceptable for families but not a draw, mixed tenant base, ~2y average lease.
- Market conditions: 22 active listings in the ZIP; 1 comparable units currently listed for rent nearby; 136 units permitted in Columbia County in 2024 (0 in 5+ unit buildings).
Forward outlook
- In year one you build about $17k of equity ($1k loan paydown + $16k appreciation (10.0% local appreciation)).
- Columbia County population projected at -22% by 2050 — secular population decline; favor cash flow + early exit over multi-decade hold.
- At projected returns (10.0% appreciation + 3.0% rent growth), your $43k cash investment doubles in ~2 years — after that, you're playing with house money.
- By year 3, paydown + projected appreciation supports a ~$42k cash-out refi (75% LTV) — recoverable capital for the next deal without selling this one.
Negotiation context
- It's been on market 205 days — a 12% lower offer ($136k) is reasonable based on typical stale-listing flexibility.
Questions for the listing agent
- It's been on market 205 days. Have you received any prior offers? Is the seller open to a 12% concession, seller financing, or rate buy-down credit?
- Why hasn't it sold? Are there any deal-killer items the seller is aware of (foundation, flood, title, zoning, code violations)?
- Is there a deadline driving the sale (1031 exchange, divorce, estate, relocation)? That informs how much negotiation room exists.
- What's the average days-on-market for RENTAL listings here right now (not sales)? A rising rental-DOM trend means longer vacancies and softer asking-rent achievability than the comps imply.
- What's the recent tenant-quality profile in this submarket — average credit score on applications, eviction rate, late-payment / NSF rate, and stable-employment percentage? A property-management company in the area should have these aggregated.
- How much new for-sale + rental construction is in the pipeline within 1–3 miles? Heavy new supply typically softens prices + rents 12–24 months out; constrained supply supports both.
Investment metrics
- 1% rule
- 1.61% ✓
- Cap rate
- 13.29%
- Cash-on-cash
- 24.99%
- DSCR
- 2.11
- GRM
- 5.2
CMA / ARV
No comps found within radius.
Projected returns pro-forma
10.0% appreciation · 3.0% rent growth · sell at horizon
- IRR
- 43.1%
- Equity multiple
- 4.27×
- Total profit
- $142,020
- Equity at exit
- $139,636
- IRR
- 37.3%
- Equity multiple
- 9.60×
- Total profit
- $373,032
- Equity at exit
- $301,131
Cash invested: $43,400 (down + closing). Projections, not guarantees.
Landlord ↔ Tenant lean methodology
- Overall (STATE)
- 15 Strongly Tenant-Friendly
- State New York
- 15 Strongly Tenant-Friendly · D+10
- County
- — inherits STATE
- City
- — inherits STATE
ZIP-level market 12173
- Home prices YoY
- 8.6%
- Active inventory
- 22
- Price-to-rent
- 5.2×
Monthly cashflow live
- Estimated rent
- $2,500 medium interval (Pro) →
- Mortgage (P&I)
- −$813
- Tax est. 1.5%
- −$194 /mo · $2,325/yr
- Insurance
- −$65
- HOA
- −$0
- Vacancy / Maint / Mgmt
- −$525
- Net cashflow
- $904
Break-even live
UW: 25.0% down · 7.5% · 30yr · 1.5% tax · 5.0% vac · 8.0% maint · 8.0% mgmt
Financing live
Cash to close
- Down payment
- $38,750
- Closing costs
- $4,650
- Reserves months
- —
- Total cash needed
- —
Loan-product check · same deal, 3 products live
Conventional
25% down · 7.5% · 30yr
- Down + closing
- —
- Monthly P&I
- —
- Monthly cashflow
- —
- DSCR
- —
- Eligible?
- —
Personal DTI + credit; lowest rate.
DSCR
20% down · 8.5% · 30yr
- Down + closing
- —
- Monthly P&I
- —
- Monthly cashflow
- —
- DSCR
- —
- Eligible?
- —
No personal income docs; deal must DSCR.
Hard money
10% down · 12.0% · 12mo
- Down + closing
- —
- Monthly P&I
- —
- Monthly cashflow
- —
- DSCR
- —
- Eligible?
- —
Short-term bridge; refi at stabilization.
Rent comps 1 comps
| Address | Beds | Baths | Sqft | Rent | $/sqft | DOM | Units | Dist |
|---|---|---|---|---|---|---|---|---|
| 100 Summerset Rd Stuyvesant, NY | 2.0 | 2.0 | 1560 | $2,500 | $1.60 | 14d | 1 | 0.31mi |
Listing history 16 events
-
2026-06-19days on market $155,000 Active 205 DOM
-
2026-06-18days on market $155,000 Active 204 DOM
-
2026-06-17days on market $155,000 Active 203 DOM
-
2026-06-16days on market $155,000 Active 202 DOM
-
2026-06-15days on market $155,000 Active 201 DOM
-
2026-06-14days on market $155,000 Active 199 DOM
-
2026-06-12days on market $155,000 Active 198 DOM
-
2026-06-09days on market $155,000 Active 195 DOM
-
2026-06-08days on market $155,000 Active 194 DOM
-
2026-06-07days on market $155,000 Active 193 DOM
-
2026-06-07days on market $155,000 Active 192 DOM
-
2026-06-04days on market $155,000 Active 189 DOM
-
2026-06-02days on market $155,000 Active 188 DOM
-
2026-06-01days on market $155,000 Active 187 DOM
-
2026-05-31days on market $155,000 Active 186 DOM
-
2026-05-31days on market $155,000 Active 185 DOM
ⓘ Source: listings_history table (triggers on properties + properties_extension) + one-shot
backfill from property_details.listing_events for pre-trigger history.
Climate risk First Street
- Flood 1/10 Low FEMA zone X · 0% chance over 30 yrs
- Wildfire 1/10 Low
- Heat 4/10 Moderate 7 d/yr ≥99°F today · 16 d/yr by 30 yrs out
- Wind 3/10 Moderate 6% chance of damaging wind over 30 yrs
- Air quality 2/10 Low 0 unhealthy d/yr today · 1 by 30 yrs out
Nearby sold comps map
Loading sold comps map…
Walkable amenities ~0.75 mi
Loading nearby amenities…
Taxation est. · year 1
- Rental income
- $30,000
- − Mortgage interest
- −$8,682
- − Property taxes
- −$2,325
- − Insurance
- −$775
- − Repairs & maintenance
- −$2,400
- − Management
- −$2,400
- − Depreciation
- −$4,509
- Taxable income
- $8,908
- Est. tax owed @ 24.0%
- −$2,138
- After-tax cash flow
- $8,708/yr
For passive investors: Depreciation is non-cash, so a rental often shows a tax loss while cash-flowing — sheltering income. Rental losses are passive: they offset passive income freely, and up to $25,000/yr can offset ordinary (W-2) income if you actively participate and your MAGI is under $100k (phasing out to $0 by $150k); unused losses carry forward. On sale, claimed depreciation is recaptured at up to 25%, and gains may owe capital-gains tax (a 1031 exchange can defer both). Figures are a year-1 estimate at your 24.0% rate — not tax advice; consult a CPA.
Schools (NCES district)
- District
- Kinderhook Central School District
- NCES district ID
- 3615210
- Math proficiency
- 49% ▼ -10.00%
- Reading proficiency
- 59% ▲ 1.00%
- Median HH income
- $68,409
- Composite
- 47.82/100
- National rank
- #2223
- State rank
- #294 of 590 in NY
Livability — New Baltimore
No livability data for this city. (Only ~50 U.S. cities are tracked.)
Census & demographics
- City population
- 182
- Population (ZIP)
- 2,040
Population outlook (Columbia County) Hauer SSP2
- Today (2025)
- 58,662 people
- By 2030
- 56,557 · -3.6%
- By 2040
- 51,324 · -12.5%
- By 2050
- 45,790 · -21.9%
- By 2075
- 35,232 · -39.9%
- By 2100
- 25,846 · -55.9%
Race, ethnicity, and origin ACS 2023
- Neighborhood character
- Predominantly White (86%)
- Race & ethnicity
- White 86% Hispanic / Latino 11% Two or more races 2% Black 1%
- Hispanic origin (detail)
- Mexican 8% Cuban 2%
- Common ancestry
- Iranian 12% Romanian 6% Lithuanian 3%
- Foreign-born
- 1% · Canada
- Languages at home
- 92% English-only · Spanish 8%
Political lean MEDSL · Columbia
- 2024 margin
- D (+14.7) · D 57.4% · R 42.6%
- 2008→2024 swing
- +1.3pp toward D · 2008: 13.4pp · 2024: 14.7pp
- All cycles
- 2024: D+14.7 2020: D+16.7 2016: D+1.4 2012: D+11.7 2008: D+13.4
Not yet ingested
- Civics
- —
Market trends
- HPI YoY
- ▲ 31.11%
- Current HPI
- 393.6279
- Rent YoY
- —
- Metro
- —
- State GDP YoY
- ▲ 2.60%
- F500 in state
- 92
Industry mix (Fortune 500 HQ in NY)
| Industry | F500 HQs | Revenue |
|---|---|---|
| Financial Services | 10 | $950B |
|
||
| Consumer Goods | 9 | $162B |
|
||
| Insurance | 4 | $225B |
|
||
| Telecommunications | 2 | $144B |
|
||
| Pharmaceuticals | 2 | $112B |
|
||
| Media / Entertainment | 2 | $69B |
|
||
Cash-flow waterfall
monthlySold comps — $/sqft
last 12 mo · ≤1 miLoading sold comps…