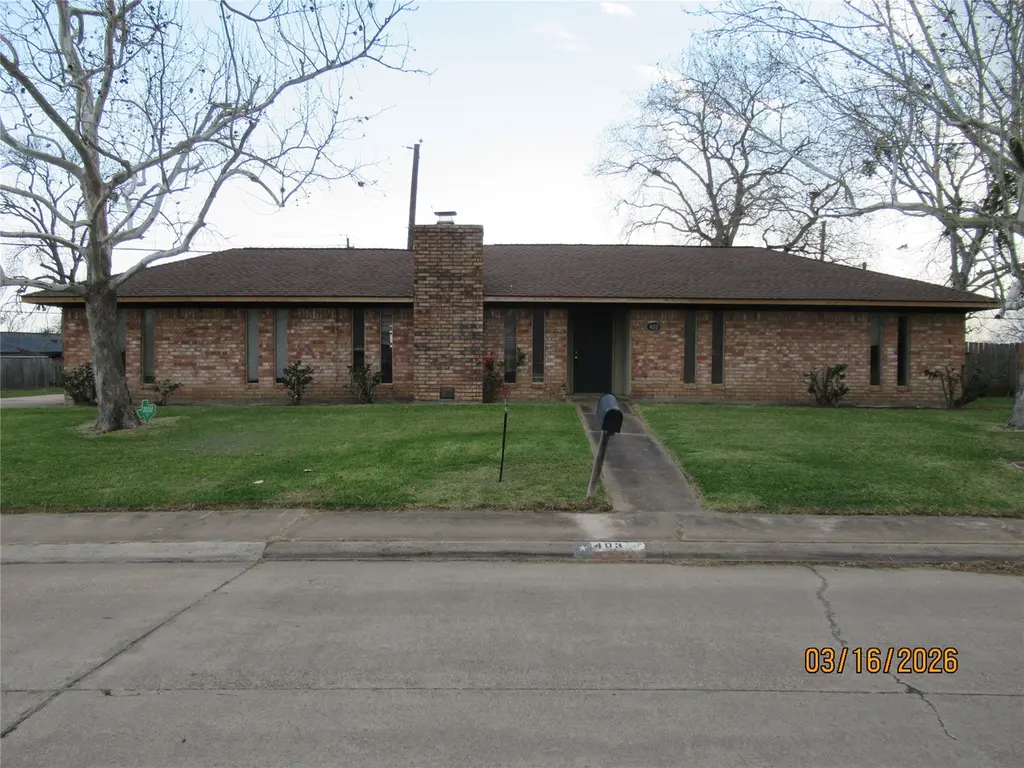
403 Lotus St · Lake Jackson, TX
Flood risk 6/10 · Moderate
- FEMA flood zone
- X (unshaded)
- Chance of flooding over 30 yrs
- 0.55%
- Est. flood insurance / yr
- $507 – $1,088
Fire risk 4/10 · Minor
- Est. fire insurance / yr
- $1,222 – $2,270
Heat risk 10/10 · Severe
- Hot days now (above 114°F)
- 7 days/yr
- Hot days in 30 yrs
- 26 days/yr
Wind risk 9/10 · Severe
- Chance of severe wind over 30 yrs
- 99.0%
Air-quality risk 2/10 · Minimal
- Unhealthy air days now
- 1 days/yr
- Unhealthy air days in 30 yrs
- 1 days/yr
Risk factors via First Street. Map © Google.
Why this score? — see what drove the C grade
The composite is a weighted blend of 9 inputs, each scored 0–100. Each bar is that input's sub-score; the figure is the points it added to the 100-point composite (weight × sub-score).
- Cash flow +19.2/30.0
- ARV discount +15.0/15.0
- 1% rule +6.2/10.0
- DSCR +6.0/10.0
- Livability +3.9/5.0
- Schools +3.7/10.0
- Condition / age +2.5/5.0
- Rent growth +2.2/5.0
- Appreciation +0.0/10.0
$175,000
🖨 Deal sheet (PDF) 📄 Offer letter ✓ Due diligence
Listing remarks MLS
Great opportunity. Spacious 4BR home in central location with roof replacement in 2004. Needs some updating, but nice home for a family wanting more room. Recent foundation engineer reports available.
Key facts
- Roof replacement
- 9,726 sq ft lot
- 2 garage spots
Tags
Neighborhood map
What this means for you Summary
Snapshot
- This is a 4-bed/2.0-bath single-family listed at $175k.
Deal economics
- At list price, monthly cash flow is $188 ($2k/yr) — positive.
- The deal already cash-flows at list — no discount required.
- Meets the 1% rule at list price ($2k rent vs $175k).
- Recommended offer: $164k (6.0% below list) — sets the bar for market timing.
- Cap rate 7.6% vs local median 3.8% in Lake Jackson — top-decile yield for the area; either an underpriced asset or a hidden risk that comps aren't pricing in. Stress-test before assuming the spread holds.
Location & tenants
- Location reads 78/100 on livability (#76 in TX, #2,709 nationally) — a middle-class / working-renter tenant base. Strengths: employment A+, cost of living A+, housing A+; Watch: amenities C-, commute F.
- Brazosport ISD (suburban): math 43% / reading 41% proficiency, ranked #305 of 826 in TX (top 37%) — families likely to look elsewhere, expect single-tenant / working-renter base with shorter leases.
- Market conditions: Rents soft (-1.1%/yr); 231 active listings in the ZIP; 6 comparable units currently listed for rent nearby; rentals lingering (median 45d on market — plan ~5-8 weeks vacancy on turnover, expect pricing pressure); 83% of comp listings sitting > 30 days — soft ceiling on asking rent; solid renter incomes; 3,960 units permitted in Brazoria County in 2024 (593 in 5+ unit buildings).
Forward outlook
- Local home prices are declining (-3.0%/yr); year-one equity from $1k of loan paydown is wiped out by about $5k of value loss. Plan a longer hold.
- Brazoria County population projected at +44% by 2050 — long-run rental-demand tailwind backs the buy-and-hold thesis.
Negotiation context
- It's been on market 73 days — a 6% lower offer ($164k) is reasonable based on typical stale-listing flexibility.
- 4 sale attempts since 11y ago with the ask held roughly flat each time — persistent listings suggest the price (not the market) is what's stuck; bring a comps-based counter.
Risks & watch-outs
- Watch-outs: property tax is 2.5% of price.
- Climate carrying-cost: major flood risk; severe wind risk, 99% chance of damaging wind over 30y; extreme-heat days projected 7→26/yr by 2055 (HVAC capex compounding) — expect insurance premiums to compound above CPI over the hold.
Questions for the listing agent
- It's been on market 73 days. Have you received any prior offers? Is the seller open to a 6% concession, seller financing, or rate buy-down credit?
- Property tax is high relative to price — has the assessment been appealed recently, and will the sale trigger a re-assessment?
- Why hasn't it sold? Are there any deal-killer items the seller is aware of (foundation, flood, title, zoning, code violations)?
- Is there a deadline driving the sale (1031 exchange, divorce, estate, relocation)? That informs how much negotiation room exists.
- What's the average days-on-market for RENTAL listings here right now (not sales)? A rising rental-DOM trend means longer vacancies and softer asking-rent achievability than the comps imply.
- What's the recent tenant-quality profile in this submarket — average credit score on applications, eviction rate, late-payment / NSF rate, and stable-employment percentage? A property-management company in the area should have these aggregated.
- How much new for-sale + rental construction is in the pipeline within 1–3 miles? Heavy new supply typically softens prices + rents 12–24 months out; constrained supply supports both.
Investment metrics
- 1% rule
- 1.12% ✓
- Cap rate
- 7.58%
- Cash-on-cash
- 4.60%
- DSCR
- 1.20
- GRM
- 7.4
CMA / ARV
- ARV (median comp)
- $224,862
- List price
- $175,000
- Delta
- -22.17%
- Verdict
- UNDERPRICED
- Comps
- 20 within 1.0 mi
Show comp detail 12 sales within ~0.75 mi
| Address | Dist | Beds/Ba | Sqft | Sold | Price | $/sf | Match |
|---|---|---|---|---|---|---|---|
| 107 Maple St | 0.07mi | 3/2.5 (-1) | 1,708 (+5%) | 4mo | $254,900 | $149 | 79 |
| 51 Lotus Ct | 0.11mi | 3/2.0 (-1) | 1,748 (+7%) | 5mo | $288,000 | $165 | 74 |
| 137 Silverbell Cir | 0.27mi | 3/2.0 (-1) | 1,558 (-4%) | 2mo | $259,999 | $167 | 73 |
| 55 Sweetgum Ct | 0.44mi | 3/2.0 (-1) | 1,654 (+2%) | 1mo | $235,000 | $142 | 71 |
| 155 Silverbell Cir | 0.23mi | 3/2.0 (-1) | 1,482 (-9%) | 1mo | $259,900 | $175 | 68 |
| 119 Bois D'arc | 0.15mi | 4/2.5 | 1,845 (+13%) | 1mo | $219,000 | $119 | 68 |
| 122 Bumelia St | 0.45mi | 3/2.0 (-1) | 1,568 (-4%) | 5mo | $245,000 | $156 | 63 |
| 501 Elm St | 0.66mi | 4/2.0 | 1,722 (+6%) | 1mo | $267,000 | $155 | 59 |
| 119 Basswood St | 0.55mi | 3/2.0 (-1) | 1,554 (-5%) | 4mo | $224,000 | $144 | 58 |
| 411 Center Way | 0.61mi | 4/2.0 | 1,432 (-12%) | 2mo | $117,000 | $82 | 49 |
| 107 Gardenia St | 0.66mi | 4/2.0 | 1,811 (+11%) | 2mo | $194,000 | $107 | 49 |
| 232 Laurel St | 0.66mi | 4/2.0 | 1,834 (+12%) | 4mo | $239,999 | $131 | 45 |
Match score weights: distance 35% · size 25% · config 20% · recency 20%. Top-matched comps best support the ARV.
Projected returns pro-forma
-3.0% appreciation · 0.0% rent growth · sell at horizon
- IRR
- -12.9%
- Equity multiple
- 0.55×
- Total profit
- $-22,018
- Equity at exit
- $26,093
- IRR
- -10.0%
- Equity multiple
- 0.48×
- Total profit
- $-25,463
- Equity at exit
- $15,131
Cash invested: $49,000 (down + closing). Projections, not guarantees.
Landlord ↔ Tenant lean methodology
- Overall (STATE)
- 87 Strongly Landlord-Friendly
- State Texas
- 87 Strongly Landlord-Friendly · R+5
- County
- — inherits STATE
- City
- — inherits STATE
ZIP-level market 77566
- Home prices YoY
- -25.2%
- Rents YoY
- -1.1%
- Active inventory
- 231
- Price-to-rent
- 7.4×
Monthly cashflow live
- Estimated rent
- $1,958 high interval (Pro) →
- Mortgage (P&I)
- −$918
- Tax from tax record
- −$369 /mo · $4,425/yr
- Insurance
- −$73
- HOA
- −$0
- Vacancy / Maint / Mgmt
- −$411
- Net cashflow
- $188
Break-even live
Sensitivity live
| Price | -10% $287 | -5% $237 | +0% $188 | +5% $138 | +10% $89 |
|---|---|---|---|---|---|
| Rent | -10% $33 | -5% $110 | +0% $188 | +5% $265 | +10% $342 |
| Rate | -1.0pp $276 | -0.5pp $232 | base $188 | +0.5pp $142 | +1.0pp $96 |
UW: 25.0% down · 7.5% · 30yr · 1.5% tax · 5.0% vac · 8.0% maint · 8.0% mgmt
Financing live
Cash to close
- Down payment
- $43,750
- Closing costs
- $5,250
- Reserves months
- —
- Total cash needed
- —
Loan-product check · same deal, 3 products live
Conventional
25% down · 7.5% · 30yr
- Down + closing
- —
- Monthly P&I
- —
- Monthly cashflow
- —
- DSCR
- —
- Eligible?
- —
Personal DTI + credit; lowest rate.
DSCR
20% down · 8.5% · 30yr
- Down + closing
- —
- Monthly P&I
- —
- Monthly cashflow
- —
- DSCR
- —
- Eligible?
- —
No personal income docs; deal must DSCR.
Hard money
10% down · 12.0% · 12mo
- Down + closing
- —
- Monthly P&I
- —
- Monthly cashflow
- —
- DSCR
- —
- Eligible?
- —
Short-term bridge; refi at stabilization.
Rent comps 6 comps
| Address | Beds | Baths | Sqft | Rent | $/sqft | DOM | Units | Dist |
|---|---|---|---|---|---|---|---|---|
| 214 Oleander St Lake Jackson, TX | 3.0 | 2.0 | 1423 | $2,000 | $1.41 | 45d | 1 | 0.23mi |
| 460 TX-332 Lake Jackson, TX | 1.0–3.0 | 1.0–2.0 | 836 | $1,453 | $1.74 | 45d | 17 | 0.44mi |
| 460 TX-332 Lake Jackson, TX | 1.0–3.0 | 1.0–2.0 | 836 | $1,203 | $1.44 | 0d | 10 | 0.44mi |
| 301 Cypress St Lake Jackson, TX | 3.0 | 2.5 | 1878 | $2,000 | $1.06 | 45d | 1 | 0.88mi |
| 138 Oyster Creek Dr Lake Jackson, TX | 3.0 | 2.0 | 1175 | $1,525 | $1.30 | 45d | 1 | 1.28mi |
| 523 Wisteria St Lake Jackson, TX | 3.0 | 1.5 | 1508 | $1,775 | $1.18 | 45d | 1 | 1.43mi |
Listing history 11 events
-
2026-05-10status Active 202-char remark
Show marketing remark (202 chars)
Great opportunity. Spacious 4BR home in central location with roof replacement in 2004. Needs some updating, but nice home for a family wanting more room. Recent foundation engineer reports available.
-
2026-05-10status Pending 202-char remark
Show marketing remark (202 chars)
Great opportunity. Spacious 4BR home in central location with roof replacement in 2004. Needs some updating, but nice home for a family wanting more room. Recent foundation engineer reports available.
-
2026-05-01status Pending 202-char remark
Show marketing remark (202 chars)
Great opportunity. Spacious 4BR home in central location with roof replacement in 2004. Needs some updating, but nice home for a family wanting more room. Recent foundation engineer reports available.
-
2026-03-13$175,000 Active 202-char remark
Show marketing remark (304 chars)
Great investment opportunity. Spacious 4BR home in central location with roof replacement in 2004. Needs some updating, but nice home for a family wanting more room. Sold "AS IS" condition for Cash or "Hard Loan" Ask your agent for the Engineer's Report in regards to the foundation.
-
2026-03-13$175,000 Active 304-char remark
Show marketing remark (304 chars)
Great investment opportunity. Spacious 4BR home in central location with roof replacement in 2004. Needs some updating, but nice home for a family wanting more room. Sold "AS IS" condition for Cash or "Hard Loan" Ask your agent for the Engineer's Report in regards to the foundation.
-
2022-03-23soldstatus
-
2022-03-23soldstatus
-
2015-12-11historical
-
2015-10-26status Pending
-
2015-10-14$117,500 Active
-
2011-01-20soldstatus
ⓘ Source: listings_history table (triggers on properties + properties_extension) + one-shot
backfill from property_details.listing_events for pre-trigger history.
Tax reassessment forecast TX · Resets to sale price
- Current annual tax
- $4,425 · $369/mo
- Projected year-2 tax
- $4,425 · $369/mo
- Expected delta
- $0/yr ($0/mo · 0.0%)
ⓘ Screening estimate from a state-policy table — verify with the county assessor before closing.
Climate risk First Street
- Flood 6/10 Major FEMA zone X (unshaded) · 55% chance over 30 yrs
- Wildfire 4/10 Moderate
- Heat 10/10 Extreme 7 d/yr ≥114°F today · 26 d/yr by 30 yrs out
- Wind 9/10 Extreme 99% chance of damaging wind over 30 yrs
- Air quality 2/10 Low 1 unhealthy d/yr today · 1 by 30 yrs out
Nearby sold comps map
Loading sold comps map…
Walkable amenities ~0.75 mi
Loading nearby amenities…
Taxation est. · year 1
- Rental income
- $23,501
- − Mortgage interest
- −$9,803
- − Property taxes
- −$4,425
- − Insurance
- −$875
- − Repairs & maintenance
- −$1,880
- − Management
- −$1,880
- − Depreciation
- −$5,091
- Taxable loss
- −$453
- Est. tax savings @ 24.0%
- +$109
- After-tax cash flow
- $2,362/yr
For passive investors: Depreciation is non-cash, so a rental often shows a tax loss while cash-flowing — sheltering income. Rental losses are passive: they offset passive income freely, and up to $25,000/yr can offset ordinary (W-2) income if you actively participate and your MAGI is under $100k (phasing out to $0 by $150k); unused losses carry forward. On sale, claimed depreciation is recaptured at up to 25%, and gains may owe capital-gains tax (a 1031 exchange can defer both). Figures are a year-1 estimate at your 24.0% rate — not tax advice; consult a CPA.
Schools (NCES district)
- District
- Brazosport ISD
- NCES district ID
- 4811190
- Math proficiency
- 43% ▼ -6.00%
- Reading proficiency
- 41% ▼ -2.00%
- Median HH income
- $57,024
- Composite
- 36.84/100
- National rank
- #4557
- State rank
- #305 of 826 in TX
Livability — Lake Jackson
- Score
- 78/100
- State rank
- #76
- US rank
- #2709
Category grades
Schools grade is shown separately in the Schools card above.
Census & demographics
- Census place
- Lake Jackson, TX
- County
- Brazoria County · 374,982 people
- City population
- 30,246
- Metro
- Houston-The Woodlands-Sugar Land, TX
- Population (ZIP)
- 30,246
- Household income
- $92,586
- Rent vs Own
- Severe rent burden
- 1126.0
Population outlook (Brazoria County) Hauer SSP2
- Today (2025)
- 420,414 people
- By 2030
- 457,585 · +8.8%
- By 2040
- 532,232 · +26.6%
- By 2050
- 605,399 · +44.0%
- By 2075
- 779,358 · +85.4%
- By 2100
- 883,759 · +110.2%
Race, ethnicity, and origin ACS 2023
- Neighborhood character
- Diverse neighborhood (Simpson 0.56)
- Race & ethnicity
- White 60% Hispanic / Latino 28% Two or more races 16% Black 7% Asian 2%
- Hispanic origin (detail)
- Mexican 24%
- Common ancestry
- Lithuanian 3% Serbian 2% Italian 1%
- Foreign-born
- 8% · Canada, South Korea
- Languages at home
- 83% English-only · Spanish 15% Arabic 1% Tagalog/Filipino 1%
Political lean MEDSL · Brazoria
- 2024 margin
- R (+19.7) · D 39.5% · R 59.2% · Other 1.3%
- 2008→2024 swing
- +9.9pp toward D · 2008: -29.6pp · 2024: -19.7pp
- All cycles
- 2024: R+19.7 2020: R+18.2 2016: R+24.6 2012: R+34.2 2008: R+29.6
Not yet ingested
- Civics
- —
Market trends
- HPI YoY
- ▼ -84.81%
- Current HPI
- 251.8234
- Rent YoY
- ▼ -1.11%
- Metro
- Houston-The Woodlands-Sugar Land, TX
- State GDP YoY
- ▲ 3.95%
- F500 in state
- 110
Industry mix (Fortune 500 HQ in TX)
| Industry | F500 HQs | Revenue |
|---|---|---|
| Energy | 16 | $1,198B |
|
||
| Technology | 5 | $198B |
|
||
| Engineering / Construction | 4 | $72B |
|
||
| Energy Services | 3 | $60B |
|
||
| Utilities | 3 | $41B |
|
||
| Healthcare | 2 | $330B |
|
||
Price history
+48.9% since first listed11 events — show timeline
- 2026-05-10 Relisted — HARMLS
- 2026-05-10 Pending — HARMLS
- 2026-05-01 Pending — HARMLS
- 2026-03-13 Listed $175,000 BCBR
- 2026-03-13 Listed $175,000 HARMLS
- 2022-03-23 Sold (Public Records) — Public Records
- 2022-03-23 Sold (Public Records) — Public Records
- 2015-12-11 Listing Removed — HARMLS
- 2015-10-26 Pending — HARMLS
- 2015-10-14 Listed $117,500 HARMLS
- 2011-01-20 Sold (Public Records) — Public Records
Property tax history
+5.2%/yrLatest (2025): $4,425 · +0.9% YoY. Source: county tax records.
Cash-flow waterfall
monthlySold comps — $/sqft
last 12 mo · ≤1 miLoading sold comps…