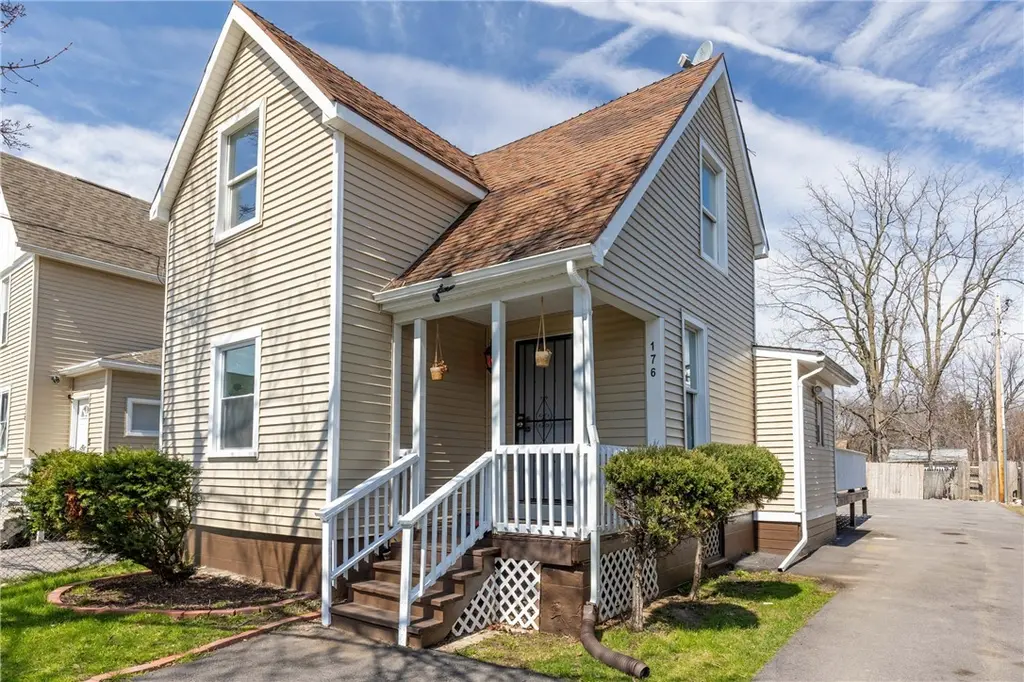
176 Otis St · Rochester, NY
Flood risk 1/10 · Minimal
- FEMA flood zone
- X (unshaded)
- Chance of flooding over 30 yrs
- 0.0%
- Est. flood insurance / yr
- $473 – $860
Fire risk 1/10 · Minimal
- Est. fire insurance / yr
- $691 – $1,283
Heat risk 2/10 · Minimal
- Hot days now (above 96°F)
- 7 days/yr
- Hot days in 30 yrs
- 15 days/yr
Wind risk 1/10 · Minimal
- Chance of severe wind over 30 yrs
- —
Air-quality risk 2/10 · Minimal
- Unhealthy air days now
- 1 days/yr
- Unhealthy air days in 30 yrs
- 2 days/yr
Risk factors via First Street. Map © Google.
Why this score? — see what drove the C+ grade
The composite is a weighted blend of 9 inputs, each scored 0–100. Each bar is that input's sub-score; the figure is the points it added to the 100-point composite (weight × sub-score).
- Cash flow +25.2/30.0
- ARV discount +12.4/15.0
- DSCR +8.2/10.0
- 1% rule +5.6/10.0
- Rent growth +4.1/5.0
- Livability +3.8/5.0
- Condition / age +2.5/5.0
- Schools +1.9/10.0
- Appreciation +0.0/10.0
$119,000
🖨 Deal sheet 📄 Offer letter ✓ Due diligence
Listing remarks MLS
3bedroom two bad home fenced in yard with sliding door and deck .
Key facts
- Newer siding
- New deck
- Full roof tear-off
Tags
Neighborhood map
What this means for you Summary
Snapshot
- This is a 2-bed/1.0-bath single-family listed at $119k.
Deal economics
- At list price, monthly cash flow is $265 ($3k/yr) — positive.
- The deal already cash-flows at list — no discount required.
- Meets the 1% rule at list price ($1k rent vs $119k).
Location & tenants
- Location reads 76/100 on livability (#222 in NY, #3,482 nationally) — a middle-class / working-renter tenant base. Strengths: commute A+, cost of living A+, housing A+; Watch: schools D+, crime F, employment F.
- Rochester City School District (urban): math 21% / reading 26% proficiency, ranked #589 of 590 in NY (top 100%) — low school quality limits family demand, transient renter base, plan for 1-2y turnover; 82% free/reduced lunch — lower-income household profile, screen leases tightly.
- Market conditions: Rents rising fast (+6.3%/yr); 124 active listings in the ZIP; 23 comparable units currently listed for rent nearby; rentals at typical pace (median 23d on market — plan ~3-4 weeks tenant-placement turnaround); 1,169 units permitted in Monroe County in 2024 (591 in 5+ unit buildings).
Forward outlook
- Local home prices are declining (-3.0%/yr); year-one equity from $823 of loan paydown is wiped out by about $4k of value loss. Plan a longer hold.
- Monroe County population projected to shrink 6% by 2050 — rents likely to lag national; underwrite the cash flow, not the appreciation.
- At projected returns (-3.0% appreciation + 6.3% rent growth), your $33k cash investment doubles in ~9 years — after that, you're playing with house money.
Negotiation context
- Only 10 days on market — expect competitive offers; lowballing is unlikely to land.
- 2 sale attempts with the ask held roughly flat each time — persistent listings suggest the price (not the market) is what's stuck; bring a comps-based counter.
Risks & watch-outs
- Watch-outs: built in 1905 — expect roof / HVAC / electrical / plumbing capex.
Questions for the listing agent
- Built in 1905 — when were the roof, HVAC, electrical panel, plumbing, and water heater last replaced?
- Is there a deadline driving the sale (1031 exchange, divorce, estate, relocation)? That informs how much negotiation room exists.
- Schools are D-rated, which usually means shorter tenancies and higher turnover. Who's the typical renter profile here, and what's been the actual vacancy rate?
- Crime grade is F in this area — have there been break-ins, vandalism, or insurance claims at this property in the last 3 years? What carrier currently insures it and at what premium?
- What's the average days-on-market for RENTAL listings here right now (not sales)? A rising rental-DOM trend means longer vacancies and softer asking-rent achievability than the comps imply.
- What's the recent tenant-quality profile in this submarket — average credit score on applications, eviction rate, late-payment / NSF rate, and stable-employment percentage? A property-management company in the area should have these aggregated.
- How much new for-sale + rental construction is in the pipeline within 1–3 miles? Heavy new supply typically softens prices + rents 12–24 months out; constrained supply supports both.
Investment metrics
- 1% rule
- 1.06% ✓
- Cap rate
- 8.96%
- Cash-on-cash
- 9.53%
- DSCR
- 1.42
- GRM
- 7.9
CMA / ARV
- ARV (on-the-fly)
- $133,455
- Comps found
- 12
Show comp detail 12 sales within ~0.75 mi
| Address | Dist | Beds/Ba | Sqft | Sold | Price | $/sf | Match |
|---|---|---|---|---|---|---|---|
| 90 Curtis St | 0.29mi | 2/1.0 | 857 (-0%) | 11mo | $160,000 | $187 | 77 |
| 114 Otis St | 0.10mi | 3/1.0 (+1) | 903 (+5%) | 8mo | $67,500 | $75 | 75 |
| 12 Placid Pl | 0.24mi | 2/1.0 | 847 (-2%) | 15mo | $72,000 | $85 | 74 |
| 52 Dix St | 0.15mi | 3/1.0 (+1) | 918 (+7%) | 5mo | $65,000 | $71 | 73 |
| 112 Otis St | 0.10mi | 3/1.5 (+1) | 904 (+5%) | 13mo | $100,000 | $111 | 69 |
| 381 Mcnaughton St | 0.47mi | 2/1.0 | 900 (+4%) | 3mo | $145,000 | $161 | 68 |
| 148 Canton St | 0.43mi | 2/1.0 | 936 (+9%) | 3mo | $145,000 | $155 | 63 |
| 946 Glide St | 0.51mi | 2/1.5 | 881 (+2%) | 9mo | $133,000 | $151 | 63 |
| 124 Curtis St | 0.28mi | 2/1.0 | 966 (+12%) | 6mo | $160,000 | $166 | 62 |
| 66 Starling St | 0.60mi | 2/1.0 | 805 (-6%) | 1mo | $125,000 | $155 | 60 |
| 306 Curlew St | 0.63mi | 3/1.5 (+1) | 974 (+13%) | 4mo | $160,000 | $164 | 38 |
| 777 Smith St | 0.74mi | 3/1.5 (+1) | 987 (+15%) | 12mo | $56,000 | $57 | 24 |
Match score weights: distance 35% · size 25% · config 20% · recency 20%. Top-matched comps best support the ARV.
Projected returns pro-forma
-3.0% appreciation · 6.28% rent growth · sell at horizon
- IRR
- 1.4%
- Equity multiple
- 1.06×
- Total profit
- $1,843
- Equity at exit
- $17,743
- IRR
- 13.8%
- Equity multiple
- 2.26×
- Total profit
- $42,049
- Equity at exit
- $10,289
Cash invested: $33,320 (down + closing). Projections, not guarantees.
Landlord ↔ Tenant lean methodology
- Overall (STATE)
- 15 Strongly Tenant-Friendly
- State New York
- 15 Strongly Tenant-Friendly · D+10
- County
- — inherits STATE
- City
- — inherits STATE
ZIP-level market 14606
- Home prices YoY
- -17.9%
- Rents YoY
- 6.3%
- Active inventory
- 124
- Price-to-rent
- 7.9×
Monthly cashflow live
- Estimated rent
- $1,262 high interval (Pro) →
- Mortgage (P&I)
- −$624
- Tax from tax record
- −$58 /mo · $700/yr
- Insurance
- −$50
- HOA
- −$0
- Vacancy / Maint / Mgmt
- −$265
- Net cashflow
- $265
Break-even live
UW: 25.0% down · 7.5% · 30yr · 1.5% tax · 5.0% vac · 8.0% maint · 8.0% mgmt
Financing live
Cash to close
- Down payment
- $29,750
- Closing costs
- $3,570
- Reserves months
- —
- Total cash needed
- —
Loan-product check · same deal, 3 products live
Conventional
25% down · 7.5% · 30yr
- Down + closing
- —
- Monthly P&I
- —
- Monthly cashflow
- —
- DSCR
- —
- Eligible?
- —
Personal DTI + credit; lowest rate.
DSCR
20% down · 8.5% · 30yr
- Down + closing
- —
- Monthly P&I
- —
- Monthly cashflow
- —
- DSCR
- —
- Eligible?
- —
No personal income docs; deal must DSCR.
Hard money
10% down · 12.0% · 12mo
- Down + closing
- —
- Monthly P&I
- —
- Monthly cashflow
- —
- DSCR
- —
- Eligible?
- —
Short-term bridge; refi at stabilization.
Rent comps 23 comps
| Address | Beds | Baths | Sqft | Rent | $/sqft | DOM | Units | Dist |
|---|---|---|---|---|---|---|---|---|
| 25 Karnes St Rochester, NY | 2.0 | 1.0 | 1059 | $1,250 | $1.18 | 21d | 1 | 0.11mi |
| 60 Lime St Unit Upper Rochester, NY | 1.0 | 1.0 | 650 | $800 | $1.23 | 2d | 1 | 0.62mi |
| 86 Parkway Rochester, NY | 3.0 | 1.0 | 602 | $1,600 | $2.66 | 3d | 1 | 0.65mi |
| 39 Parkway Apt 1 Rochester, NY | 2.0 | 1.0 | 700 | $950 | $1.36 | 43d | 1 | 0.68mi |
| 52 Lorimer St Unit 03 UP Rear Rochester, NY | 2.0 | 1.0 | 700 | $1,000 | $1.43 | 23d | 1 | 0.71mi |
| 19 Rainier St Rochester, NY | 1.0 | 1.0 | 786 | $850 | $1.08 | 3d | 1 | 0.75mi |
| 84 Twin Beeches Rochester, NY | 2.0 | 1.5 | 1096 | $1,250 | $1.14 | 23d | 1 | 0.77mi |
| 89 Twin Beeches Rochester, NY | 2.0 | 1.5 | 1096 | $1,250 | $1.14 | 43d | 1 | 0.78mi |
| 658 Smith St Rochester, NY | 2.0 | 1.0 | 981 | $1,500 | $1.53 | 3d | 1 | 0.82mi |
| 254 Lexington Ave Rochester, NY | 3.0 | 1.0 | 950 | $1,350 | $1.42 | 2d | 1 | 0.82mi |
| 2 Archer St Unit UP Rochester, NY | 1.0 | 1.0 | 600 | $895 | $1.49 | 43d | 1 | 0.85mi |
| 265 Driving Park Ave Unit 31 Rochester, NY | 2.0 | 1.0 | 810 | $1,250 | $1.54 | 43d | 1 | 0.88mi |
| 265 Driving Park Ave Unit 25 Rochester, NY | 1.0 | 1.0 | 605 | $1,150 | $1.90 | 43d | 1 | 0.88mi |
| 257 Hague St Unit 257 Rochester, NY | 2.0 | 1.5 | 1080 | $1,500 | $1.39 | 43d | 1 | 0.93mi |
| 802 Maple St Rochester, NY | 2.0 | 1.5 | 1080 | $1,800 | $1.67 | 43d | 1 | 0.98mi |
| 19 Garland Ave Rochester, NY | 3.0 | 1.0 | 1104 | $1,850 | $1.68 | 2d | 1 | 1.09mi |
| 76 Dodge St Rochester, NY | 1.0–2.0 | 1.0 | 742 | $1,250 | $1.68 | 43d | 6 | 1.10mi |
| 1097 Dewey Ave Unit B Rochester, NY | 2.0 | 1.0 | 1008 | $1,150 | $1.14 | 14d | 1 | 1.20mi |
| 76 Avenue A Unit Up Rochester, NY | 3.0 | 1.0 | 796 | $1,700 | $2.14 | 43d | 1 | 1.24mi |
| 367 West Ave Unit 2 Rochester, NY | 2.0 | 1.0 | 639 | $1,275 | $2.00 | 23d | 1 | 1.35mi |
| 367 West Ave Apt 4 Rochester, NY | 1.0 | 1.0 | 550 | $1,000 | $1.82 | 23d | 1 | 1.35mi |
| 144 Avenue C Rochester, NY | 2.0 | 1.0 | 613 | $1,050 | $1.71 | 21d | 1 | 1.38mi |
| 224 Mill St Unit 4B Rochester, NY | 1.0 | 1.0 | 923 | $1,700 | $1.84 | 14d | 1 | 1.49mi |
Listing history 3 events
-
2026-04-23status Pending
-
2026-04-13$119,000 Active
-
2026-01-06$140,000 Active 65-char remark
Show marketing remark (65 chars)
3bedroom two bad home fenced in yard with sliding door and deck .
ⓘ Source: listings_history table (triggers on properties + properties_extension) + one-shot
backfill from property_details.listing_events for pre-trigger history.
Tax reassessment forecast NY · Partial reset (capped growth)
- Current annual tax
- $700 · $58/mo
- Projected year-2 tax
- $1,356 · $113/mo
- Expected delta
- +$655/yr (+$55/mo · 93.6%)
ⓘ Screening estimate from a state-policy table — verify with the county assessor before closing.
Climate risk First Street
- Flood 1/10 Low FEMA zone X (unshaded) · 0% chance over 30 yrs
- Wildfire 1/10 Low
- Heat 2/10 Low 7 d/yr ≥96°F today · 15 d/yr by 30 yrs out
- Wind 1/10 Low
- Air quality 2/10 Low 1 unhealthy d/yr today · 2 by 30 yrs out
Nearby sold comps map
Loading sold comps map…
Walkable amenities ~0.75 mi
Loading nearby amenities…
Taxation est. · year 1
- Rental income
- $15,140
- − Mortgage interest
- −$6,666
- − Property taxes
- −$700
- − Insurance
- −$595
- − Repairs & maintenance
- −$1,211
- − Management
- −$1,211
- − Depreciation
- −$3,462
- Taxable income
- $1,295
- Est. tax owed @ 24.0%
- −$311
- After-tax cash flow
- $2,866/yr
For passive investors: Depreciation is non-cash, so a rental often shows a tax loss while cash-flowing — sheltering income. Rental losses are passive: they offset passive income freely, and up to $25,000/yr can offset ordinary (W-2) income if you actively participate and your MAGI is under $100k (phasing out to $0 by $150k); unused losses carry forward. On sale, claimed depreciation is recaptured at up to 25%, and gains may owe capital-gains tax (a 1031 exchange can defer both). Figures are a year-1 estimate at your 24.0% rate — not tax advice; consult a CPA.
Schools (NCES district)
- District
- Rochester City School District
- NCES district ID
- 3624750
- Math proficiency
- 21% ▬ 0.00%
- Reading proficiency
- 26% ▲ 4.00%
- Median HH income
- $30,923
- Composite
- 18.98/100
- National rank
- #8850
- State rank
- #589 of 590 in NY
Livability — Rochester
- Score
- 76/100
- State rank
- #222
- US rank
- #3482
Category grades
Schools grade is shown separately in the Schools card above.
Census & demographics
- Census place
- Rochester, NY
- County
- Monroe County · 674,131 people
- City population
- 432,803
- Metro
- Rochester, NY
- Population (ZIP)
- 25,538
- Household income
- $55,807
- Rent vs Own
- Severe rent burden
- 986.0
Population outlook (Monroe County) Hauer SSP2
- Today (2025)
- 759,460 people
- By 2030
- 757,154 · -0.3%
- By 2040
- 740,644 · -2.5%
- By 2050
- 714,443 · -5.9%
- By 2075
- 645,883 · -15.0%
- By 2100
- 547,084 · -28.0%
Race, ethnicity, and origin ACS 2023
- Neighborhood character
- Diverse neighborhood (Simpson 0.64)
- Race & ethnicity
- White 51% Black 26% Hispanic / Latino 17% Two or more races 8% Asian 3%
- Hispanic origin (detail)
- Puerto Rican 12% Cuban 2%
- Common ancestry
- Romanian 3% Lithuanian 1% Iranian 1%
- Foreign-born
- 10% · Canada, Vietnam, Philippines
- Languages at home
- 79% English-only · Spanish 12% Other Indo-European 3% Other Asian/Pacific 2%
Political lean MEDSL · Monroe
- 2024 margin
- D (+19.1) · D 59.5% · R 40.5%
- 2008→2024 swing
- +1.4pp toward D · 2008: 17.7pp · 2024: 19.1pp
- All cycles
- 2024: D+19.1 2020: D+21.0 2016: D+14.1 2012: D+17.4 2008: D+17.7
Not yet ingested
- Civics
- —
Market trends
- HPI YoY
- ▼ -62.59%
- Current HPI
- 287.6868
- Rent YoY
- ▲ 6.28%
- Metro
- Rochester, NY
- State GDP YoY
- ▲ 2.60%
- F500 in state
- 92
Industry mix (Fortune 500 HQ in NY)
| Industry | F500 HQs | Revenue |
|---|---|---|
| Financial Services | 10 | $950B |
|
||
| Consumer Goods | 9 | $162B |
|
||
| Insurance | 4 | $225B |
|
||
| Telecommunications | 2 | $144B |
|
||
| Pharmaceuticals | 2 | $112B |
|
||
| Media / Entertainment | 2 | $69B |
|
||
Price history
-15.0% since first listed3 events — show timeline
- 2026-04-23 Pending — UNYREIS
- 2026-04-13 Listed $119,000 UNYREIS
- 2026-01-06 Listed $140,000 ForSaleByOwner.com
Property tax history
+4.4%/yrLatest (2025): $700 · +0.0% YoY. Source: county tax records.
Cash-flow waterfall
monthlySold comps — $/sqft
last 12 mo · ≤1 miLoading sold comps…