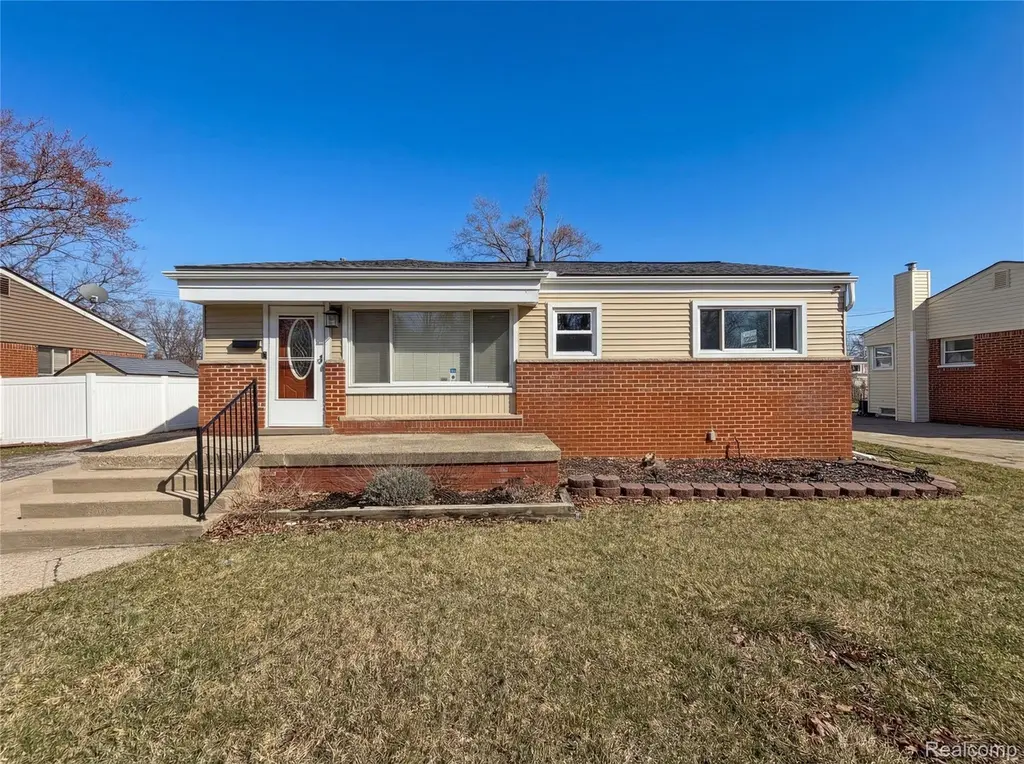
1166 Zephyr St · Ypsilanti, MI
Flood risk 1/10 · Minimal
- FEMA flood zone
- X (unshaded)
- Chance of flooding over 30 yrs
- 0.0%
- Est. flood insurance / yr
- $473 – $860
Fire risk 1/10 · Minimal
- Est. fire insurance / yr
- $784 – $1,456
Heat risk 3/10 · Minor
- Hot days now (above 97°F)
- 7 days/yr
- Hot days in 30 yrs
- 15 days/yr
Wind risk 2/10 · Minimal
- Chance of severe wind over 30 yrs
- —
Air-quality risk 2/10 · Minimal
- Unhealthy air days now
- 1 days/yr
- Unhealthy air days in 30 yrs
- 2 days/yr
Risk factors via First Street. Map © Google.
Why this score? — see what drove the D grade
The composite is a weighted blend of 9 inputs, each scored 0–100. Each bar is that input's sub-score; the figure is the points it added to the 100-point composite (weight × sub-score).
- Cash flow +15.5/30.0
- ARV discount +7.5/15.0
- DSCR +4.8/10.0
- Livability +4.0/5.0
- Rent growth +3.6/5.0
- Schools +3.3/10.0
- 1% rule +3.0/10.0
- Condition / age +2.5/5.0
- Appreciation +0.0/10.0
$241,000
🖨 Deal sheet (PDF) 📄 Offer letter ✓ Due diligence
Listing remarks MLS
Situated on a quiet corner, 1166 Zephyr St features all stainless steel appliances, a fenced in backyard, a patio, a storage shed, fresh interior paint, and partial flooring replacement. The property layout consists of neutral surfaces and functional utility areas throughout the structure. Exterior components provide access to the parcel perimeter. This residence maintains a standard build and utilitarian design throughout. Included 100-Day Home Warranty with buyer activation
Key facts
- Neutral surfaces
- Fenced in backyard
- Storage shed
Tags
Neighborhood map
What this means for you Summary
Snapshot
- This is a 3-bed/2.0-bath single-family listed at $241k.
Deal economics
- At list price, monthly cash flow is $99 ($1k/yr) — positive.
- The deal already cash-flows at list — no discount required.
- To meet the 1% rule (rent ≥ 1% of price), the offer needs to be $192k (20.2% below list).
- Recommended offer: $192k (20.2% below list) — sets the bar for 1% rule.
- Cap rate 6.8% vs local median 3.8% in Ypsilanti — top-decile yield for the area; either an underpriced asset or a hidden risk that comps aren't pricing in. Stress-test before assuming the spread holds.
Location & tenants
- Location reads 81/100 on livability (#71 in MI, #1,539 nationally) — a professional / high-income tenant draw. Strengths: amenities A+, commute A+, cost of living A+; Watch: crime F, employment D-.
- Van Buren Public Schools (suburban): math 33% / reading 43% proficiency, ranked #228 of 540 in MI (top 42%) — families likely to look elsewhere, expect single-tenant / working-renter base with shorter leases.
- Zoned schools: Rawsonville Elementary School (math 22% / reading 17%, grade F, #1,110 of 1,397 statewide, top 81%, 315 students, 80% FRL); Mcbride Middle School (math 28% / reading 47%, grade F, #243 of 493 statewide, top 50%, 581 students, 64% FRL); Belleville High School (math 32% / reading 52%, grade F, #264 of 713 statewide, top 41%, 1,770 students, 52% FRL) — zoned schools average 65% FRL vs 49% district-wide (16 pts higher); higher-poverty schools than district average — tighter screening recommended.
- Market conditions: Rents rising fast (+4.4%/yr); 166 active listings in the ZIP; 8 comparable units currently listed for rent nearby; rentals at typical pace (median 22d on market — plan ~3-4 weeks tenant-placement turnaround); 996 units permitted in Washtenaw County in 2024 (492 in 5+ unit buildings).
- This rent runs 36% of the median local income ($63k/yr) — at the standard rent-burdened threshold; future hikes will face affordability resistance.
Forward outlook
- Local home prices are declining (-3.0%/yr); year-one equity from $2k of loan paydown is wiped out by about $7k of value loss. Plan a longer hold.
- Washtenaw County population projected at +25% by 2050 — long-run rental-demand tailwind backs the buy-and-hold thesis.
Negotiation context
- Only 8 days on market — expect competitive offers; lowballing is unlikely to land.
- 2 sale attempts with the ask held roughly flat each time — persistent listings suggest the price (not the market) is what's stuck; bring a comps-based counter.
- Current owner paid $207k; 16% above their basis — modest negotiation headroom, anchor on the comps not their cost.
Risks & watch-outs
- Watch-outs: built in 1955 — expect roof / HVAC / electrical / plumbing capex.
Questions for the listing agent
- Built in 1955 — when were the roof, HVAC, electrical panel, plumbing, and water heater last replaced?
- Is there a deadline driving the sale (1031 exchange, divorce, estate, relocation)? That informs how much negotiation room exists.
- Crime grade is F in this area — have there been break-ins, vandalism, or insurance claims at this property in the last 3 years? What carrier currently insures it and at what premium?
- The area grade is low — what's the realistic commute time and amenity access for the typical tenant pool here? Any planned neighborhood developments (good or bad) we should know about?
- What's the average days-on-market for RENTAL listings here right now (not sales)? A rising rental-DOM trend means longer vacancies and softer asking-rent achievability than the comps imply.
- What's the recent tenant-quality profile in this submarket — average credit score on applications, eviction rate, late-payment / NSF rate, and stable-employment percentage? A property-management company in the area should have these aggregated.
- How much new for-sale + rental construction is in the pipeline within 1–3 miles? Heavy new supply typically softens prices + rents 12–24 months out; constrained supply supports both.
Investment metrics
- 1% rule
- 0.80% ✗
- Cap rate
- 6.78%
- Cash-on-cash
- 1.76%
- DSCR
- 1.08
- GRM
- 10.4
CMA / ARV
- ARV (on-the-fly)
- $240,754
- Comps found
- 12
Show comp detail 12 sales within ~0.75 mi
| Address | Dist | Beds/Ba | Sqft | Sold | Price | $/sf | Match |
|---|---|---|---|---|---|---|---|
| 1166 Zephyr St | 0.00mi | 3/2.0 | 1,649 (0%) | 1mo | $241,000 | $146 | 99 |
| 1324 Woodglen Ave | 0.31mi | 3/2.0 | 1,680 (+2%) | 8mo | $250,000 | $149 | 76 |
| 1649 Smith St | 0.50mi | 3/2.0 | 1,642 (-0%) | 2mo | $240,000 | $146 | 74 |
| 1033 Nash Ave | 0.26mi | 3/2.0 | 1,776 (+8%) | 5mo | $220,000 | $124 | 71 |
| 1476 Foley Ave | 0.55mi | 3/1.0 | 1,650 (+0%) | 1mo | $230,000 | $139 | 70 |
| 1815 Heatherridge St | 0.32mi | 4/2.0 (+1) | 1,570 (-5%) | 7mo | $230,000 | $146 | 66 |
| 1441 Harry St | 0.26mi | 3/1.5 | 1,812 (+10%) | 5mo | $225,000 | $124 | 66 |
| 1586 Foley Ave | 0.45mi | 3/1.5 | 1,748 (+6%) | 3mo | $222,500 | $127 | 64 |
| 1237 Lester Ave | 0.73mi | 3/1.5 | 1,677 (+2%) | 2mo | $255,900 | $153 | 59 |
| 2022 George Ave | 0.39mi | 3/1.0 | 1,850 (+12%) | 8mo | $227,000 | $123 | 51 |
| 1211 Evelyn Ave | 0.66mi | 4/2.5 (+1) | 1,440 (-13%) | 0mo | $285,000 | $198 | 41 |
| 1445 Evelyn Ave | 0.71mi | 4/2.0 (+1) | 1,840 (+12%) | 5mo | $265,000 | $144 | 39 |
Match score weights: distance 35% · size 25% · config 20% · recency 20%. Top-matched comps best support the ARV.
Projected returns pro-forma
-3.0% appreciation · 4.38% rent growth · sell at horizon
- IRR
- -12.2%
- Equity multiple
- 0.55×
- Total profit
- $-30,178
- Equity at exit
- $35,934
- IRR
- -1.5%
- Equity multiple
- 0.89×
- Total profit
- $-7,251
- Equity at exit
- $20,837
Cash invested: $67,480 (down + closing). Projections, not guarantees.
Landlord ↔ Tenant lean methodology
- Overall (STATE)
- 62 Landlord-Friendly
- State Michigan
- 62 Landlord-Friendly · EVEN
- County
- — inherits STATE
- City
- — inherits STATE
ZIP-level market 48198
- Rents YoY
- 4.4%
- Active inventory
- 166
- Price-to-rent
- 10.4×
Monthly cashflow live
- Estimated rent
- $1,923 high interval (Pro) →
- Mortgage (P&I)
- −$1,264
- Tax from tax record
- −$56 /mo · $673/yr
- Insurance
- −$100
- HOA
- −$0
- Vacancy / Maint / Mgmt
- −$404
- Net cashflow
- $99
Break-even live
Sensitivity live
| Price | -10% $235 | -5% $167 | +0% $99 | +5% $31 | +10% $-38 |
|---|---|---|---|---|---|
| Rent | -10% $-53 | -5% $23 | +0% $99 | +5% $175 | +10% $251 |
| Rate | -1.0pp $220 | -0.5pp $160 | base $99 | +0.5pp $36 | +1.0pp $-27 |
UW: 25.0% down · 7.5% · 30yr · 1.5% tax · 5.0% vac · 8.0% maint · 8.0% mgmt
Financing live
Cash to close
- Down payment
- $60,250
- Closing costs
- $7,230
- Reserves months
- —
- Total cash needed
- —
Loan-product check · same deal, 3 products live
Conventional
25% down · 7.5% · 30yr
- Down + closing
- —
- Monthly P&I
- —
- Monthly cashflow
- —
- DSCR
- —
- Eligible?
- —
Personal DTI + credit; lowest rate.
DSCR
20% down · 8.5% · 30yr
- Down + closing
- —
- Monthly P&I
- —
- Monthly cashflow
- —
- DSCR
- —
- Eligible?
- —
No personal income docs; deal must DSCR.
Hard money
10% down · 12.0% · 12mo
- Down + closing
- —
- Monthly P&I
- —
- Monthly cashflow
- —
- DSCR
- —
- Eligible?
- —
Short-term bridge; refi at stabilization.
Rent comps 8 comps
| Address | Beds | Baths | Sqft | Rent | $/sqft | DOM | Units | Dist |
|---|---|---|---|---|---|---|---|---|
| 1311 Nash Ave Ypsilanti, MI | 3.0 | 1.0 | 1200 | $1,800 | $1.50 | 19d | 1 | 0.27mi |
| 719 Oswego Ave Ypsilanti, MI | 3.0 | 1.0 | 1200 | $1,800 | $1.50 | 22d | 1 | 0.31mi |
| 2355 Briardale Ct Ypsilanti, MI | 3.0 | 1.0 | 1200 | $1,800 | $1.50 | 45d | 1 | 0.35mi |
| 677 Onandaga Ave Ypsilanti, MI | 4.0 | 2.0 | 1412 | $2,300 | $1.63 | 0d | 1 | 0.41mi |
| 1428 Village Ln Ypsilanti, MI | 1.0–2.0 | 1.0 | 860 | $1,550 | $1.80 | 45d | 1 | 0.50mi |
| 590 Olds St Ypsilanti, MI | 3.0 | 1.0 | 1188 | $1,600 | $1.35 | 26d | 1 | 0.71mi |
| 144 Ohio St Ypsilanti, MI | 4.0 | 2.0 | 1914 | $2,300 | $1.20 | 0d | 1 | 0.90mi |
| 8753 Spinnaker Way Ypsilanti, MI | 3.0 | 1.0–2.0 | 893 | $2,010 | $2.25 | 1d | 15 | 1.40mi |
Listing history 6 events
-
2026-03-31status Pending 480-char remark
Show marketing remark (480 chars)
Situated on a quiet corner, 1166 Zephyr St features all stainless steel appliances, a fenced in backyard, a patio, a storage shed, fresh interior paint, and partial flooring replacement. The property layout consists of neutral surfaces and functional utility areas throughout the structure. Exterior components provide access to the parcel perimeter. This residence maintains a standard build and utilitarian design throughout. Included 100-Day Home Warranty with buyer activation
-
2026-03-31status Pending
Show marketing remark (480 chars)
Situated on a quiet corner, 1166 Zephyr St features all stainless steel appliances, a fenced in backyard, a patio, a storage shed, fresh interior paint, and partial flooring replacement. The property layout consists of neutral surfaces and functional utility areas throughout the structure. Exterior components provide access to the parcel perimeter. This residence maintains a standard build and utilitarian design throughout. Included 100-Day Home Warranty with buyer activation
-
2026-03-23$241,000 Active
Show marketing remark (480 chars)
Situated on a quiet corner, 1166 Zephyr St features all stainless steel appliances, a fenced in backyard, a patio, a storage shed, fresh interior paint, and partial flooring replacement. The property layout consists of neutral surfaces and functional utility areas throughout the structure. Exterior components provide access to the parcel perimeter. This residence maintains a standard build and utilitarian design throughout. Included 100-Day Home Warranty with buyer activation
-
2026-03-23$241,000 Active 480-char remark
Show marketing remark (480 chars)
Situated on a quiet corner, 1166 Zephyr St features all stainless steel appliances, a fenced in backyard, a patio, a storage shed, fresh interior paint, and partial flooring replacement. The property layout consists of neutral surfaces and functional utility areas throughout the structure. Exterior components provide access to the parcel perimeter. This residence maintains a standard build and utilitarian design throughout. Included 100-Day Home Warranty with buyer activation
-
2026-02-25soldstatus $207,000
-
1999-09-03soldstatus $74,500
ⓘ Source: listings_history table (triggers on properties + properties_extension) + one-shot
backfill from property_details.listing_events for pre-trigger history.
Tax reassessment forecast MI · Partial reset (capped growth)
- Current annual tax
- $673 · $56/mo
- Projected year-2 tax
- $2,192 · $183/mo
- Expected delta
- +$1,519/yr (+$127/mo · 225.6%)
ⓘ Screening estimate from a state-policy table — verify with the county assessor before closing.
Climate risk First Street
- Flood 1/10 Low FEMA zone X (unshaded) · 0% chance over 30 yrs
- Wildfire 1/10 Low
- Heat 3/10 Moderate 7 d/yr ≥97°F today · 15 d/yr by 30 yrs out
- Wind 2/10 Low
- Air quality 2/10 Low 1 unhealthy d/yr today · 2 by 30 yrs out
Nearby sold comps map
Loading sold comps map…
Walkable amenities ~0.75 mi
Loading nearby amenities…
Taxation est. · year 1
- Rental income
- $23,075
- − Mortgage interest
- −$13,500
- − Property taxes
- −$673
- − Insurance
- −$1,205
- − Repairs & maintenance
- −$1,846
- − Management
- −$1,846
- − Depreciation
- −$7,011
- Taxable loss
- −$3,006
- Est. tax savings @ 24.0%
- +$721
- After-tax cash flow
- $1,906/yr
For passive investors: Depreciation is non-cash, so a rental often shows a tax loss while cash-flowing — sheltering income. Rental losses are passive: they offset passive income freely, and up to $25,000/yr can offset ordinary (W-2) income if you actively participate and your MAGI is under $100k (phasing out to $0 by $150k); unused losses carry forward. On sale, claimed depreciation is recaptured at up to 25%, and gains may owe capital-gains tax (a 1031 exchange can defer both). Figures are a year-1 estimate at your 24.0% rate — not tax advice; consult a CPA.
Schools (NCES district)
- District
- Van Buren Public Schools
- NCES district ID
- 2634560
- Math proficiency
- 33% ▲ 6.00%
- Reading proficiency
- 43% ▲ 6.00%
- Median HH income
- $54,166
- Composite
- 33.2/100
- National rank
- #5533
- State rank
- #228 of 540 in MI
Livability — Ypsilanti
- Score
- 81/100
- State rank
- #71
- US rank
- #1539
Category grades
Schools grade is shown separately in the Schools card above.
Census & demographics
- County
- Washtenaw County · 306,860 people
- City population
- 105,769
- Metro
- Ann Arbor, MI
- Population (ZIP)
- 39,244
- Household income
- $63,326
- Rent vs Own
- Severe rent burden
- 1998.0
Population outlook (Washtenaw County) Hauer SSP2
- Today (2025)
- 402,878 people
- By 2030
- 424,104 · +5.3%
- By 2040
- 464,633 · +15.3%
- By 2050
- 504,728 · +25.3%
- By 2075
- 614,463 · +52.5%
- By 2100
- 676,181 · +67.8%
Race, ethnicity, and origin ACS 2023
- Neighborhood character
- Diverse neighborhood (Simpson 0.66)
- Race & ethnicity
- White 48% Black 32% Two or more races 11% Hispanic / Latino 8% Asian 2%
- Hispanic origin (detail)
- Mexican 4%
- Common ancestry
- Romanian 3% Italian 2% Slovak 2%
- Foreign-born
- 9% · Canada, China, South Korea
- Languages at home
- 88% English-only · Spanish 7% Other Indo-European 1% Arabic 1%
Political lean MEDSL · Washtenaw
- 2024 margin
- Solid D (+44.4) · D 71.0% · R 26.6% · Other 2.4%
- 2008→2024 swing
- +3.5pp toward D · 2008: 41.0pp · 2024: 44.4pp
- All cycles
- 2024: D+44.4 2020: D+46.6 2016: D+41.5 2012: D+36.0 2008: D+41.0
Not yet ingested
- Civics
- —
Market trends
- HPI YoY
- ▼ -224.96%
- Current HPI
- 204.1228
- Rent YoY
- ▲ 4.38%
- Metro
- Ann Arbor, MI
- State GDP YoY
- ▲ 1.37%
- F500 in state
- 28
Industry mix (Fortune 500 HQ in MI)
| Industry | F500 HQs | Revenue |
|---|---|---|
| Automotive Parts | 3 | $48B |
|
||
| Automotive | 2 | $372B |
|
||
| Chemicals | 1 | $45B |
|
||
| Automotive Retail | 1 | $29B |
|
||
| Healthcare / Medical Devices | 1 | $23B |
|
||
| Automotive Technology | 1 | $20B |
|
||
Price history
+223.5% since first listed6 events — show timeline
- 2026-03-31 Pending — MiRealSource-MiMLS
- 2026-03-31 Pending — REALCOMP
- 2026-03-23 Listed $241,000 REALCOMP
- 2026-03-23 Listed $241,000 MiRealSource-MiMLS
- 2026-02-25 Sold (Public Records) $207,000 Public Records
- 1999-09-03 Sold (Public Records) $74,500 Public Records
Property tax history
-2.5%/yrLatest (2025): $673 · -43.7% YoY. Source: county tax records.
Cash-flow waterfall
monthlySold comps — $/sqft
last 12 mo · ≤1 miLoading sold comps…