858 Crazy Horse Way · Farmers Loop, AK
Flood risk 1/10 · Minimal
- FEMA flood zone
- X (unshaded)
- Chance of flooding over 30 yrs
- 0.0%
- Est. flood insurance / yr
- $473 – $860
Fire risk No data
- Est. fire insurance / yr
- —
Heat risk No data
- Hot days now (above threshold)
- —
- Hot days in 30 yrs
- —
Wind risk No data
- Chance of severe wind over 30 yrs
- —
Air-quality risk 1/10 · Minimal
- Unhealthy air days now
- —
- Unhealthy air days in 30 yrs
- —
Risk factors via First Street. Map © Google.
Why this score? — see what drove the B- grade
The composite is a weighted blend of 9 inputs, each scored 0–100. Each bar is that input's sub-score; the figure is the points it added to the 100-point composite (weight × sub-score).
- Cash flow +30.0/30.0
- 1% rule +10.0/10.0
- DSCR +10.0/10.0
- ARV discount +7.5/15.0
- Schools +3.6/10.0
- Livability +3.1/5.0
- Rent growth +2.5/5.0
- Condition / age +2.5/5.0
- Appreciation +0.0/10.0
$90,000
🖨 Deal sheet (PDF) 📄 Offer letter ✓ Due diligence
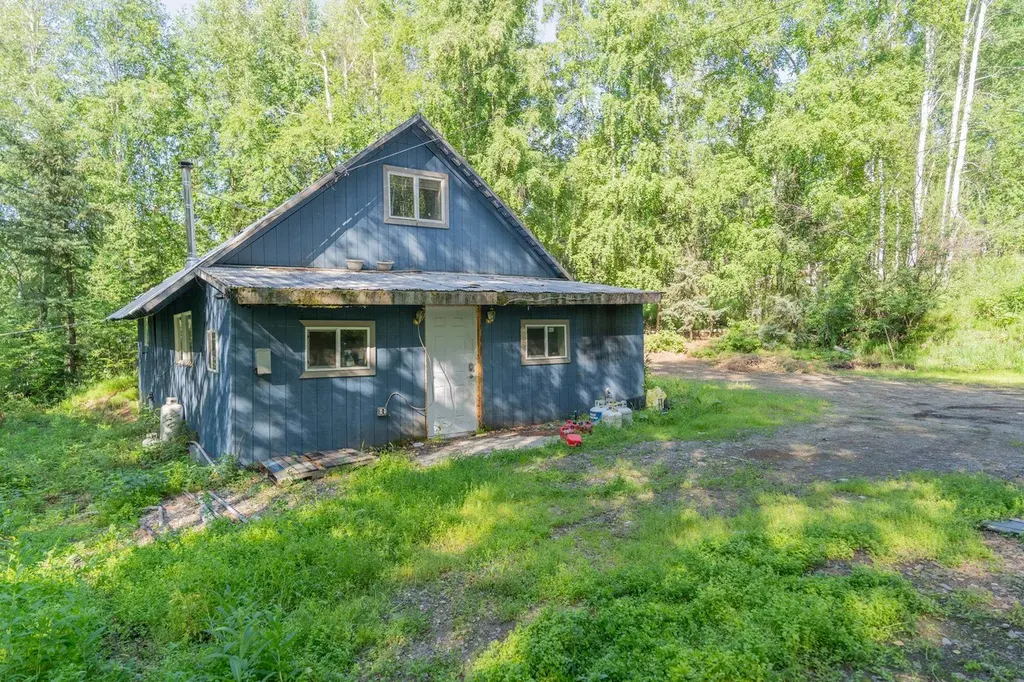
Listing remarks
This property offers a rare opportunity to create your dream space in a quiet, tree-lined neighborhood with easy access to both the Steese Highway and Chena Hot Springs Road. Located just 10 minutes from Walmart and Fred Meyer East, this 3-bedroom, 1-bathroom home sits on a spacious lot with ample room for parking, entertaining, gardening, etc. . Enjoy the privacy of mature trees and the convenience of dual driveway access from Old Steese Hwy and Crazy Horse Drive. A cozy woodstove helps offset heating costs during the colder months. The home itself needs TLC and is being sold as-is—ideal for those looking to invest in a project. Cash or construction loan only.
Key facts
- Dual driveway access
- Spacious lot
- Cozy woodstove
Tags
Neighborhood map
What this means for you Summary
Snapshot
- This is a 3-bed/1.0-bath single-family listed at $90k.
Deal economics
- At list price, monthly cash flow is $576 ($7k/yr) — positive.
- The deal already cash-flows at list — no discount required.
- Meets the 1% rule at list price ($2k rent vs $90k).
- Recommended offer: $89k (1.5% below list) — sets the bar for market timing.
- Cap rate 14.0% vs local median 2.3% in Farmers Loop — top-decile yield for the area; either an underpriced asset or a hidden risk that comps aren't pricing in. Stress-test before assuming the spread holds.
Location & tenants
- Location reads 62/100 on livability (#56 in AK) — a middle-class / working-renter tenant base. Strengths: employment A+, housing A+; Watch: schools C-, crime D+, cost of living D+.
- Fairbanks North Star Borough School District (urban): math 33% / reading 45% proficiency, ranked #10 of 21 in AK (top 48%) — families likely to look elsewhere, expect single-tenant / working-renter base with shorter leases.
- Market conditions: 149 active listings in the ZIP; 1 units permitted in Fairbanks North Star Borough in 2024 (0 in 5+ unit buildings).
Forward outlook
- Local home prices are declining (-3.0%/yr); year-one equity from $622 of loan paydown is wiped out by about $3k of value loss. Plan a longer hold.
- Fairbanks North Star County population projected at +6% by 2050 — modest demand growth; plan on rents tracking national, not racing it.
- At projected returns (-3.0% appreciation + 3.0% rent growth), your $25k cash investment doubles in ~5 years — after that, you're playing with house money.
Negotiation context
- It's been on market 16 days — a 2% lower offer ($89k) is reasonable based on typical stale-listing flexibility.
Risks & watch-outs
- Watch-outs: property tax is 2.5% of price.
Questions for the listing agent
- Built in 1970 — when were the roof, HVAC, electrical panel, plumbing, and water heater last replaced?
- Property tax is high relative to price — has the assessment been appealed recently, and will the sale trigger a re-assessment?
- Is there a deadline driving the sale (1031 exchange, divorce, estate, relocation)? That informs how much negotiation room exists.
- Crime grade is D in this area — have there been break-ins, vandalism, or insurance claims at this property in the last 3 years? What carrier currently insures it and at what premium?
- What's the average days-on-market for RENTAL listings here right now (not sales)? A rising rental-DOM trend means longer vacancies and softer asking-rent achievability than the comps imply.
- What's the recent tenant-quality profile in this submarket — average credit score on applications, eviction rate, late-payment / NSF rate, and stable-employment percentage? A property-management company in the area should have these aggregated.
- How much new for-sale + rental construction is in the pipeline within 1–3 miles? Heavy new supply typically softens prices + rents 12–24 months out; constrained supply supports both.
Investment metrics
- 1% rule
- 1.79% ✓
- Cap rate
- 13.98%
- Cash-on-cash
- 27.45%
- DSCR
- 2.22
- GRM
- 4.6
CMA / ARV
- ARV (median comp)
- $344,087
- List price
- $90,000
- Delta
- -73.84%
- Verdict
- UNDERPRICED
- Comps
- 15 within 1.0 mi
Show comp detail 3 sales within ~0.75 mi
| Address | Dist | Beds/Ba | Sqft | Sold | Price | $/sf | Match |
|---|---|---|---|---|---|---|---|
| 306 Pay Streak Dr | 0.42mi | 3/3.0 | 1,661 (+5%) | 9mo | $474,900 | $286 | 57 |
| 400 Winter St | 0.62mi | 3/1.0 | 1,440 (-9%) | 8mo | $200,000 | $139 | 49 |
| 332 Winter St | 0.64mi | 2/1.5 (-1) | 1,418 (-10%) | 16mo | $425,000 | $300 | 33 |
Match score weights: distance 35% · size 25% · config 20% · recency 20%. Top-matched comps best support the ARV.
Projected returns pro-forma
-3.0% appreciation · 3.0% rent growth · sell at horizon
- IRR
- 21.5%
- Equity multiple
- 1.88×
- Total profit
- $22,201
- Equity at exit
- $13,419
- IRR
- 29.7%
- Equity multiple
- 3.65×
- Total profit
- $66,897
- Equity at exit
- $7,782
Cash invested: $25,200 (down + closing). Projections, not guarantees.
Landlord ↔ Tenant lean methodology
- Overall (STATE)
- 80 Strongly Landlord-Friendly
- State Alaska
- 80 Strongly Landlord-Friendly · R+8
- County
- — inherits STATE
- City
- — inherits STATE
ZIP-level market 99712
- Home prices YoY
- -24.2%
- Active inventory
- 149
- Price-to-rent
- 4.6×
Monthly cashflow live
- Estimated rent
- $1,615 medium interval (Pro) →
- Mortgage (P&I)
- −$472
- Tax from tax record
- −$190 /mo · $2,276/yr
- Insurance
- −$38
- HOA
- −$0
- Vacancy / Maint / Mgmt
- −$339
- Net cashflow
- $576
Break-even live
Sensitivity live
| Price | -10% $627 | -5% $602 | +0% $576 | +5% $551 | +10% $525 |
|---|---|---|---|---|---|
| Rent | -10% $449 | -5% $513 | +0% $576 | +5% $640 | +10% $704 |
| Rate | -1.0pp $622 | -0.5pp $599 | base $576 | +0.5pp $553 | +1.0pp $529 |
UW: 25.0% down · 7.5% · 30yr · 1.5% tax · 5.0% vac · 8.0% maint · 8.0% mgmt
Financing live
Cash to close
- Down payment
- $22,500
- Closing costs
- $2,700
- Reserves months
- —
- Total cash needed
- —
Loan-product check · same deal, 3 products live
Conventional
25% down · 7.5% · 30yr
- Down + closing
- —
- Monthly P&I
- —
- Monthly cashflow
- —
- DSCR
- —
- Eligible?
- —
Personal DTI + credit; lowest rate.
DSCR
20% down · 8.5% · 30yr
- Down + closing
- —
- Monthly P&I
- —
- Monthly cashflow
- —
- DSCR
- —
- Eligible?
- —
No personal income docs; deal must DSCR.
Hard money
10% down · 12.0% · 12mo
- Down + closing
- —
- Monthly P&I
- —
- Monthly cashflow
- —
- DSCR
- —
- Eligible?
- —
Short-term bridge; refi at stabilization.
Listing history 1 events
-
2026-04-02$90,000 Active 675-char remark
ⓘ Source: listings_history table (triggers on properties + properties_extension) + one-shot
backfill from property_details.listing_events for pre-trigger history.
Tax reassessment forecast AK · Partial reset (capped growth)
- Current annual tax
- $2,276 · $190/mo
- Projected year-2 tax
- $2,276 · $190/mo
- Expected delta
- $0/yr ($0/mo · 0.0%)
ⓘ Screening estimate from a state-policy table — verify with the county assessor before closing.
Climate risk First Street
- Flood 1/10 Low FEMA zone X (unshaded) · 0% chance over 30 yrs
- Air quality 1/10 Low
Nearby sold comps map
Loading sold comps map…
Walkable amenities ~0.75 mi
Loading nearby amenities…
Taxation est. · year 1
- Rental income
- $19,375
- − Mortgage interest
- −$5,041
- − Property taxes
- −$2,276
- − Insurance
- −$450
- − Repairs & maintenance
- −$1,550
- − Management
- −$1,550
- − Depreciation
- −$2,618
- Taxable income
- $5,890
- Est. tax owed @ 24.0%
- −$1,414
- After-tax cash flow
- $5,503/yr
For passive investors: Depreciation is non-cash, so a rental often shows a tax loss while cash-flowing — sheltering income. Rental losses are passive: they offset passive income freely, and up to $25,000/yr can offset ordinary (W-2) income if you actively participate and your MAGI is under $100k (phasing out to $0 by $150k); unused losses carry forward. On sale, claimed depreciation is recaptured at up to 25%, and gains may owe capital-gains tax (a 1031 exchange can defer both). Figures are a year-1 estimate at your 24.0% rate — not tax advice; consult a CPA.
Schools (NCES district)
- District
- Fairbanks North Star Borough School District
- NCES district ID
- 0200600
- Math proficiency
- 33% ▼ -6.00%
- Reading proficiency
- 45% ▲ 3.00%
- Median HH income
- $69,697
- Composite
- 35.5/100
- National rank
- #4915
- State rank
- #10 of 21 in AK
Livability — Farmers Loop
- Score
- 62/100
- State rank
- #56
- US rank
- #16401
Category grades
Schools grade is shown separately in the Schools card above.
Census & demographics
- Census place
- Farmers Loop, AK
- Population (ZIP)
- 12,070
Population outlook (Fairbanks North Star County) Hauer SSP2
- Today (2025)
- 101,607 people
- By 2030
- 102,796 · +1.2%
- By 2040
- 104,748 · +3.1%
- By 2050
- 107,598 · +5.9%
- By 2075
- 118,829 · +16.9%
- By 2100
- 127,151 · +25.1%
Race, ethnicity, and origin ACS 2023
- Neighborhood character
- Predominantly White (74%)
- Race & ethnicity
- White 74% Native American 9% Two or more races 8% Hispanic / Latino 5% Asian 2%
- Common ancestry
- Italian 4% Portuguese 3% Slovak 2%
- Foreign-born
- 3% · Canada, China
- Languages at home
- 95% English-only · Other Asian/Pacific 1% Spanish 1%
Political lean MEDSL · Fairbanks North Star
- 2016 margin
- R (+15.2) · D 37.7% · R 52.9% · Other 9.4%
- All cycles
- 2016: R+15.2
Not yet ingested
- Civics
- —
Market trends
- HPI YoY
- ▼ -47.35%
- Current HPI
- 148.2472
- Rent YoY
- —
- Metro
- —
- State GDP YoY
- —
- F500 in state
- 0
Property tax history
+2.1%/yrLatest (2025): $2,276 · +5.9% YoY. Source: county tax records.
Cash-flow waterfall
monthlySold comps — $/sqft
last 12 mo · ≤1 miLoading sold comps…