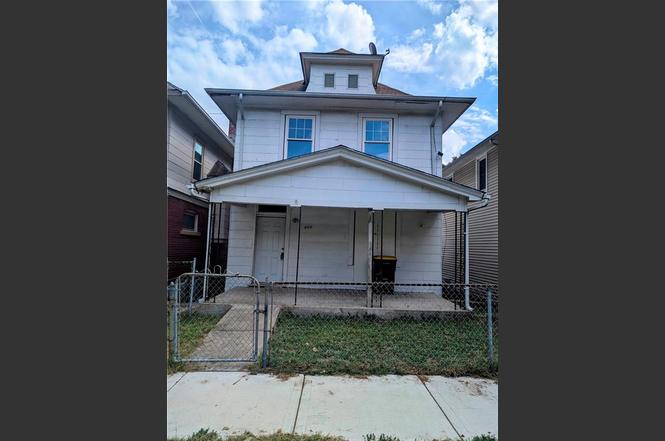
403 Spruce Ave · Kansas City, MO
Flood risk 1/10 · Minimal
- FEMA flood zone
- X (unshaded)
- Chance of flooding over 30 yrs
- 0.0%
- Est. flood insurance / yr
- $473 – $860
Fire risk 1/10 · Minimal
- Est. fire insurance / yr
- $1,054 – $1,958
Heat risk 4/10 · Minor
- Hot days now (above 107°F)
- 7 days/yr
- Hot days in 30 yrs
- 17 days/yr
Wind risk 2/10 · Minimal
- Chance of severe wind over 30 yrs
- —
Air-quality risk 3/10 · Minor
- Unhealthy air days now
- 2 days/yr
- Unhealthy air days in 30 yrs
- 3 days/yr
Risk factors via First Street. Map © Google.
Why this score? — see what drove the B+ grade
The composite is a weighted blend of 9 inputs, each scored 0–100. Each bar is that input's sub-score; the figure is the points it added to the 100-point composite (weight × sub-score).
- Cash flow +30.0/30.0
- ARV discount +15.0/15.0
- 1% rule +10.0/10.0
- DSCR +10.0/10.0
- Livability +3.9/5.0
- Rent growth +3.1/5.0
- Condition / age +2.5/5.0
- Schools +1.5/10.0
- Appreciation +0.0/10.0
$89,800
🖨 Deal sheet 📄 Offer letter ✓ Due diligence
Listing remarks
Investor special, sold as is. Surrounding area has seen housing improvements so this is a great opportunity to make an impact on your pocketbook as well as the community. Demolition and some reconstruction has begun, as it needs all major upgrades. Many new windows have been installed, a wall was removed to expand the kitchen space, and some rooms have been sheet rocked. Original wooden oak floors throughout, as well as original doors, trim and baseboards. Some plumbing and wiring have been installed. With a nice front porch, potential rear deck, large bedrooms and bathrooms, open concept kitchen/dining area, and appreciation of classic old homes, what looks like a challenge can become some
Key facts
- 3,817 sq ft lot
- Built 1900
- Listed 199 days
Property features AI
Finance
- HOA & community: No maintenance provided
Exterior
- Parking: Off-street parking
- Utilities: Public water
- Home design: Single-family residence; Residential property; 2-story; Faces west
- Construction: Asbestos, stucco, and vinyl siding exterior; Composition roof
- Exterior features: Fixer-up condition; Metal fencing
Interior
- Bedrooms: 3 bedrooms
- Flooring: Other
- Bathrooms: 2 full bathrooms
- Heating & cooling: No heating; No cooling
- Interior features: Other flooring; Full, unfinished stone/rock basement
- Laundry & utility: Laundry located in basement
Neighborhood map
What this means for you Summary
Snapshot
- This is a 3-bed/1.0-bath single-family listed at $90k.
Deal economics
- At list price, monthly cash flow is $516 ($6k/yr) — positive.
- The deal already cash-flows at list — no discount required.
- Meets the 1% rule at list price ($1k rent vs $90k).
- Recommended offer: $79k (12.0% below list) — sets the bar for market timing.
- Cap rate 13.2% vs local median 3.9% in Kansas City — top-decile yield for the area; either an underpriced asset or a hidden risk that comps aren't pricing in. Stress-test before assuming the spread holds.
Location & tenants
- Location reads 78/100 on livability (#28 in MO, #2,671 nationally) — a middle-class / working-renter tenant base. Strengths: amenities A+, commute A+, cost of living A+; Watch: schools C-, crime F.
- Kansas City 33 (urban): math 12% / reading 24% proficiency, ranked #308 of 324 in MO (top 95%) — low school quality limits family demand, transient renter base, plan for 1-2y turnover; 75% free/reduced lunch — lower-income household profile, screen leases tightly.
- Market conditions: Rents rising (+2.2%/yr); 52 active listings in the ZIP; 36 comparable units currently listed for rent nearby; rentals at typical pace (median 22d on market — plan ~3-4 weeks tenant-placement turnaround); 4,002 units permitted in Jackson County in 2024 (2,271 in 5+ unit buildings).
- This rent runs 36% of the median local income ($46k/yr) — at the standard rent-burdened threshold; future hikes will face affordability resistance.
Forward outlook
- Local home prices are declining (-3.0%/yr); year-one equity from $621 of loan paydown is wiped out by about $3k of value loss. Plan a longer hold.
- Jackson County population projected at +4% by 2050 — modest demand growth; plan on rents tracking national, not racing it.
- At projected returns (-3.0% appreciation + 2.2% rent growth), your $25k cash investment doubles in ~6 years — after that, you're playing with house money.
Negotiation context
- It's been on market 199 days — a 12% lower offer ($79k) is reasonable based on typical stale-listing flexibility.
- 2 sale attempts with the ask held roughly flat each time — persistent listings suggest the price (not the market) is what's stuck; bring a comps-based counter.
Risks & watch-outs
- Watch-outs: built in 1900 — expect roof / HVAC / electrical / plumbing capex.
Questions for the listing agent
- It's been on market 199 days. Have you received any prior offers? Is the seller open to a 12% concession, seller financing, or rate buy-down credit?
- Built in 1900 — when were the roof, HVAC, electrical panel, plumbing, and water heater last replaced?
- Why hasn't it sold? Are there any deal-killer items the seller is aware of (foundation, flood, title, zoning, code violations)?
- Is there a deadline driving the sale (1031 exchange, divorce, estate, relocation)? That informs how much negotiation room exists.
- Crime grade is F in this area — have there been break-ins, vandalism, or insurance claims at this property in the last 3 years? What carrier currently insures it and at what premium?
- What's the average days-on-market for RENTAL listings here right now (not sales)? A rising rental-DOM trend means longer vacancies and softer asking-rent achievability than the comps imply.
- What's the recent tenant-quality profile in this submarket — average credit score on applications, eviction rate, late-payment / NSF rate, and stable-employment percentage? A property-management company in the area should have these aggregated.
- How much new for-sale + rental construction is in the pipeline within 1–3 miles? Heavy new supply typically softens prices + rents 12–24 months out; constrained supply supports both.
Investment metrics
- 1% rule
- 1.56% ✓
- Cap rate
- 13.18%
- Cash-on-cash
- 24.60%
- DSCR
- 2.09
- GRM
- 5.3
CMA / ARV
- ARV (on-the-fly)
- $172,028
- Comps found
- 12
Show comp detail 12 sales within ~0.75 mi
| Address | Dist | Beds/Ba | Sqft | Sold | Price | $/sf | Match |
|---|---|---|---|---|---|---|---|
| 402 Kensington Ave | 0.04mi | 3/2.0 | 1,376 (-7%) | 3mo | $75,000 | $55 | 80 |
| 3521 Lexington Ave | 0.43mi | 3/1.0 | 1,552 (+5%) | 2mo | $140,000 | $90 | 71 |
| 3621 Lexington St | 0.35mi | 3/1.5 | 1,395 (-6%) | 6mo | $165,000 | $118 | 67 |
| 404 N Gladstone Blvd | 0.58mi | 3/1.5 | 1,512 (+2%) | 3mo | $260,000 | $172 | 65 |
| 3608 Lexington Ave | 0.38mi | 3/1.0 | 1,365 (-8%) | 7mo | $189,000 | $138 | 63 |
| 3430 E 6th St | 0.54mi | 2/2.0 (-1) | 1,558 (+5%) | 3mo | $75,000 | $48 | 55 |
| 4123 E 6th St | 0.32mi | 4/2.0 (+1) | 1,610 (+9%) | 10mo | $173,999 | $108 | 54 |
| 3830 Roberts St | 0.30mi | 4/2.0 (+1) | 1,320 (-11%) | 6mo | $70,000 | $53 | 54 |
| 127 N Denver Ave | 0.66mi | 3/1.5 | 1,540 (+4%) | 10mo | $179,000 | $116 | 53 |
| 110 N Brighton Ave | 0.51mi | 3/2.0 | 1,350 (-9%) | 8mo | $240,000 | $178 | 51 |
| 336 N Brighton Ave | 0.63mi | 4/1.5 (+1) | 1,368 (-8%) | 1mo | $205,000 | $150 | 49 |
| 815 Elmwood Ave | 0.52mi | 3/1.5 | 1,302 (-12%) | 5mo | $74,900 | $58 | 49 |
Match score weights: distance 35% · size 25% · config 20% · recency 20%. Top-matched comps best support the ARV.
Projected returns pro-forma
-3.0% appreciation · 2.2% rent growth · sell at horizon
- IRR
- 17.1%
- Equity multiple
- 1.68×
- Total profit
- $17,166
- Equity at exit
- $13,389
- IRR
- 25.0%
- Equity multiple
- 3.10×
- Total profit
- $52,717
- Equity at exit
- $7,764
Cash invested: $25,144 (down + closing). Projections, not guarantees.
Landlord ↔ Tenant lean methodology
- Overall (STATE)
- 81 Strongly Landlord-Friendly
- State Missouri
- 81 Strongly Landlord-Friendly · R+10
- County
- — inherits STATE
- City
- — inherits STATE
ZIP-level market 64124
- Home prices YoY
- -26.0%
- Rents YoY
- 2.2%
- Active inventory
- 52
- Price-to-rent
- 5.3×
Monthly cashflow live
- Estimated rent
- $1,405 high interval (Pro) →
- Mortgage (P&I)
- −$471
- Tax from tax record
- −$86 /mo · $1,033/yr
- Insurance
- −$37
- HOA
- −$0
- Vacancy / Maint / Mgmt
- −$295
- Net cashflow
- $516
Break-even live
UW: 25.0% down · 7.5% · 30yr · 1.5% tax · 5.0% vac · 8.0% maint · 8.0% mgmt
Financing live
Cash to close
- Down payment
- $22,450
- Closing costs
- $2,694
- Reserves months
- —
- Total cash needed
- —
Loan-product check · same deal, 3 products live
Conventional
25% down · 7.5% · 30yr
- Down + closing
- —
- Monthly P&I
- —
- Monthly cashflow
- —
- DSCR
- —
- Eligible?
- —
Personal DTI + credit; lowest rate.
DSCR
20% down · 8.5% · 30yr
- Down + closing
- —
- Monthly P&I
- —
- Monthly cashflow
- —
- DSCR
- —
- Eligible?
- —
No personal income docs; deal must DSCR.
Hard money
10% down · 12.0% · 12mo
- Down + closing
- —
- Monthly P&I
- —
- Monthly cashflow
- —
- DSCR
- —
- Eligible?
- —
Short-term bridge; refi at stabilization.
Rent comps 36 comps
| Address | Beds | Baths | Sqft | Rent | $/sqft | DOM | Units | Dist |
|---|---|---|---|---|---|---|---|---|
| 3510 Garner Ave Kansas City, MO | 3.0 | 2.0 | 1536 | $1,400 | $0.91 | 3d | 1 | 0.42mi |
| 218 N Elmwood Ave Kansas City, MO | 4.0 | 2.0 | 1184 | $1,500 | $1.27 | 44d | 1 | 0.44mi |
| 3523 Saint John Ave Kansas City, MO | 3.0 | 1.0 | 1500 | $995 | $0.66 | 24d | 1 | 0.47mi |
| 4405 Norledge Ave Kansas City, MO | 3.0 | 1.0 | 1510 | $1,600 | $1.06 | 44d | 1 | 0.48mi |
| 3921 Norledge Ave Unit 2E Kansas City, MO | 2.0 | 1.0 | 900 | $950 | $1.06 | 44d | 1 | 0.51mi |
| 3429 Morrell Ave Kansas City, MO | 4.0 | 1.5 | 1800 | $1,650 | $0.92 | 7d | 1 | 0.51mi |
| 815 Elmwood Ave Kansas City, MO | 3.0 | 1.5 | 1302 | $1,600 | $1.23 | 14d | 1 | 0.52mi |
| 3435 E 7th St Kansas City, MO | 2.0 | 1.0 | 970 | $949 | $0.98 | 7d | 1 | 0.56mi |
| 203 N Indiana Ave Unit 209 Indiana Kansas City, MO | 2.0 | 1.0 | 1500 | $1,400 | $0.93 | 44d | 1 | 0.65mi |
| 5213 Wilburn Ct Kansas City, MO | 3.0 | 1.0 | 1274 | $1,375 | $1.08 | 21d | 1 | 0.76mi |
| 311 Bellefontaine Ave Kansas City, MO | 3.0 | 2.0 | 1360 | $2,200 | $1.62 | 44d | 1 | 0.79mi |
| 901 Benton Blvd Unit 7 Kansas City, MO | 2.0 | 1.0 | 1100 | $1,202 | $1.09 | 44d | 1 | 0.80mi |
| 504 Bellefontaine Ave Unit 2 Kansas City, MO | 2.0 | 2.0 | 1500 | $1,300 | $0.87 | 44d | 1 | 0.82mi |
| 916 Bellefontaine Ave Kansas City, MO | 3.0 | 1.5 | 1399 | $1,650 | $1.18 | 16d | 1 | 0.91mi |
| 135 Lawndale Ave Kansas City, MO | 3.0 | 2.0 | 920 | $1,500 | $1.63 | 7d | 1 | 0.92mi |
| 412 Montgall Ave Unit 412 Kansas City, MO | 2.0 | 2.0 | 900 | $1,200 | $1.33 | 44d | 1 | 0.93mi |
| 441 N Hardesty Ave Kansas City, MO | 4.0 | 1.0 | 1511 | $1,550 | $1.03 | 24d | 1 | 0.95mi |
| 2834 E 10th St Kansas City, MO | 2.0 | 1.5 | 1020 | $1,250 | $1.23 | 44d | 1 | 0.99mi |
| 2826 E 10th St Kansas City, MO | 2.0 | 1.5 | 1020 | $1,250 | $1.23 | 44d | 1 | 1.00mi |
| 414 Prospect Ave Unit 1 Kansas City, MO | 2.0 | 1.0 | 900 | $1,295 | $1.44 | 7d | 1 | 1.02mi |
| 1233 Benton Blvd Kansas City, MO | 4.0 | 2.5 | 1500 | $2,500 | $1.67 | 44d | 1 | 1.04mi |
| 303 White Ave Unit 2 Kansas City, MO | 2.0 | 1.0 | 1060 | $950 | $0.90 | 10d | 1 | 1.11mi |
| 1603 Elmwood Ave Kansas City, MO | 2.0 | 1.0 | 1064 | $1,031 | $0.97 | 12d | 1 | 1.16mi |
| 216 N Wheeling Ave Kansas City, MO | 3.0 | 2.0 | 1474 | $1,495 | $1.01 | 16d | 1 | 1.18mi |
| 216 N Wheeling Ave Kansas City, MO | 3.0 | 2.0 | 1474 | $1,495 | $1.01 | 20d | 1 | 1.18mi |
| 129 Brooklyn Ave Kansas City, MO | 2.0 | 1.0 | 1225 | $1,195 | $0.98 | 10d | 1 | 1.27mi |
| 105 Brooklyn Ave Kansas City, MO | 3.0 | 1.5 | 1152 | $1,250 | $1.09 | 4d | 1 | 1.29mi |
| 220 Brooklyn Ave Unit 220-2 Kansas City, MO | 2.0 | 1.0 | 1000 | $1,295 | $1.29 | 20d | 1 | 1.29mi |
| 220 Brooklyn Ave Kansas City, MO | 2.0 | 1.0 | 1000 | $1,295 | $1.29 | 7d | 1 | 1.29mi |
| 1805 Jackson Ave Kansas City, MO | 4.0 | 2.0 | 1250 | $1,250 | $1.00 | 44d | 1 | 1.33mi |
| 6011 E 11th St Kansas City, MO | 3.0 | 1.0 | 900 | $1,200 | $1.33 | 16d | 1 | 1.33mi |
| 1812 Elmwood Ave Kansas City, MO | 3.0 | 1.0 | 1650 | $1,600 | $0.97 | 16d | 1 | 1.35mi |
| 347 Maple Blvd Kansas City, MO | 3.0 | 1.5 | 1246 | $1,350 | $1.08 | 24d | 1 | 1.41mi |
| 1905 Kensington Ave Kansas City, MO | 3.0 | 2.0 | 1285 | $1,325 | $1.03 | 24d | 1 | 1.42mi |
| 612 Garfield Ave Kansas City, MO | 1.0–2.0 | 1.0–2.0 | 900 | $1,875 | $2.08 | 2d | 44 | 1.46mi |
| 3305 E 19th St Kansas City, MO | 2.0 | 1.0 | 1500 | $1,200 | $0.80 | 44d | 1 | 1.49mi |
Listing history 19 events
-
2026-06-18days on market $89,800 Active 199 DOM
-
2026-06-17days on market $89,800 Active 198 DOM
-
2026-06-16days on market $89,800 Active 197 DOM
-
2026-06-15days on market $89,800 Active 196 DOM
-
2026-06-13days on market $89,800 Active 194 DOM
-
2026-06-09days on market $89,800 Active 190 DOM
-
2026-06-08days on market $89,800 Active 189 DOM
-
2026-06-07days on market $89,800 Active 188 DOM
-
2026-06-05days on market $89,800 Active 185 DOM
-
2026-06-03days on market $89,800 Active 184 DOM
-
2026-06-02days on market $89,800 Active 183 DOM
-
2026-06-01days on market $89,800 Active 182 DOM
-
2026-05-31days on market $89,800 Active 181 DOM
-
2026-05-21historical Active Under Contract
-
2026-05-20status Active
-
2026-03-20historical
-
2025-10-02$89,800 Active
-
2025-09-20historical $89,800
-
2019-08-09soldstatus
ⓘ Source: listings_history table (triggers on properties + properties_extension) + one-shot
backfill from property_details.listing_events for pre-trigger history.
Tax reassessment forecast MO · Resets to sale price
- Current annual tax
- $1,033 · $86/mo
- Projected year-2 tax
- $1,033 · $86/mo
- Expected delta
- $0/yr ($0/mo · 0.0%)
ⓘ Screening estimate from a state-policy table — verify with the county assessor before closing.
Climate risk First Street
- Flood 1/10 Low FEMA zone X (unshaded) · 0% chance over 30 yrs
- Wildfire 1/10 Low
- Heat 4/10 Moderate 7 d/yr ≥107°F today · 17 d/yr by 30 yrs out
- Wind 2/10 Low
- Air quality 3/10 Moderate 2 unhealthy d/yr today · 3 by 30 yrs out
Nearby sold comps map
Loading sold comps map…
Walkable amenities ~0.75 mi
Loading nearby amenities…
Taxation est. · year 1
- Rental income
- $16,860
- − Mortgage interest
- −$5,030
- − Property taxes
- −$1,033
- − Insurance
- −$449
- − Repairs & maintenance
- −$1,349
- − Management
- −$1,349
- − Depreciation
- −$2,612
- Taxable income
- $5,038
- Est. tax owed @ 24.0%
- −$1,209
- After-tax cash flow
- $4,977/yr
For passive investors: Depreciation is non-cash, so a rental often shows a tax loss while cash-flowing — sheltering income. Rental losses are passive: they offset passive income freely, and up to $25,000/yr can offset ordinary (W-2) income if you actively participate and your MAGI is under $100k (phasing out to $0 by $150k); unused losses carry forward. On sale, claimed depreciation is recaptured at up to 25%, and gains may owe capital-gains tax (a 1031 exchange can defer both). Figures are a year-1 estimate at your 24.0% rate — not tax advice; consult a CPA.
Schools (NCES district)
- District
- Kansas City 33
- NCES district ID
- 2916400
- Math proficiency
- 12% ▼ -8.00%
- Reading proficiency
- 24% ▬ 0.00%
- Median HH income
- $35,227
- Composite
- 14.8/100
- National rank
- #9387
- State rank
- #308 of 324 in MO
Livability — Kansas City
- Score
- 78/100
- State rank
- #28
- US rank
- #2671
Category grades
Schools grade is shown separately in the Schools card above.
Census & demographics
- Census place
- Kansas City, MO
- County
- Jackson County · 687,798 people
- City population
- 439,467
- Metro
- Kansas City, MO-KS
- Population (ZIP)
- 10,925
- Household income
- $46,241
- Rent vs Own
- Severe rent burden
- 541.0
Population outlook (Jackson County) Hauer SSP2
- Today (2025)
- 719,589 people
- By 2030
- 731,456 · +1.6%
- By 2040
- 746,689 · +3.8%
- By 2050
- 749,289 · +4.1%
- By 2075
- 736,227 · +2.3%
- By 2100
- 668,210 · -7.1%
Race, ethnicity, and origin ACS 2023
- Neighborhood character
- Diverse neighborhood (Simpson 0.68)
- Race & ethnicity
- Hispanic / Latino 43% White 30% Black 20% Two or more races 10% Asian 4% Native American 2%
- Hispanic origin (detail)
- Mexican 30% Cuban 1%
- Common ancestry
- Italian 2% Hispanic 1% Serbian 1%
- Foreign-born
- 32% · Canada, Vietnam
- Languages at home
- 52% English-only · Spanish 35% Vietnamese 2% Arabic 2%
Political lean MEDSL · Jackson
- 2024 margin
- D (+19.3) · D 58.9% · R 39.5% · Other 1.6%
- 2008→2024 swing
- -6.1pp toward R · 2008: 25.4pp · 2024: 19.3pp
- All cycles
- 2024: D+19.3 2020: D+22.0 2016: D+16.6 2012: D+19.0 2008: D+25.4
Not yet ingested
- Civics
- —
Market trends
- HPI YoY
- ▼ -125.95%
- Current HPI
- 358.4244
- Rent YoY
- ▲ 2.20%
- Metro
- Kansas City, MO-KS
- State GDP YoY
- ▲ 1.84%
- F500 in state
- 20
Industry mix (Fortune 500 HQ in MO)
| Industry | F500 HQs | Revenue |
|---|---|---|
| Healthcare | 1 | $163B |
|
||
| Insurance | 1 | $21B |
|
||
| Industrial Technology | 1 | $17B |
|
||
| Retail | 1 | $16B |
|
||
| Industrial Distribution | 1 | $10B |
|
||
| Utilities | 1 | $9B |
|
||
Price history
+0.0% since first listed6 events — show timeline
- 2026-05-21 Contingent — Heartland MLS as Distributed by MLS Grid
- 2026-05-20 Relisted — Heartland MLS as Distributed by MLS Grid
- 2026-03-20 Listing Removed — Heartland MLS as Distributed by MLS Grid
- 2025-10-02 Listed $89,800 Heartland MLS as Distributed by MLS Grid
- 2025-09-20 Coming Soon $89,800 Heartland MLS as Distributed by MLS Grid
- 2019-08-09 Sold (Public Records) — Public Records
Property tax history
+7.8%/yrLatest (2025): $1,033 · -0.9% YoY. Source: county tax records.
Cash-flow waterfall
monthlySold comps — $/sqft
last 12 mo · ≤1 miLoading sold comps…