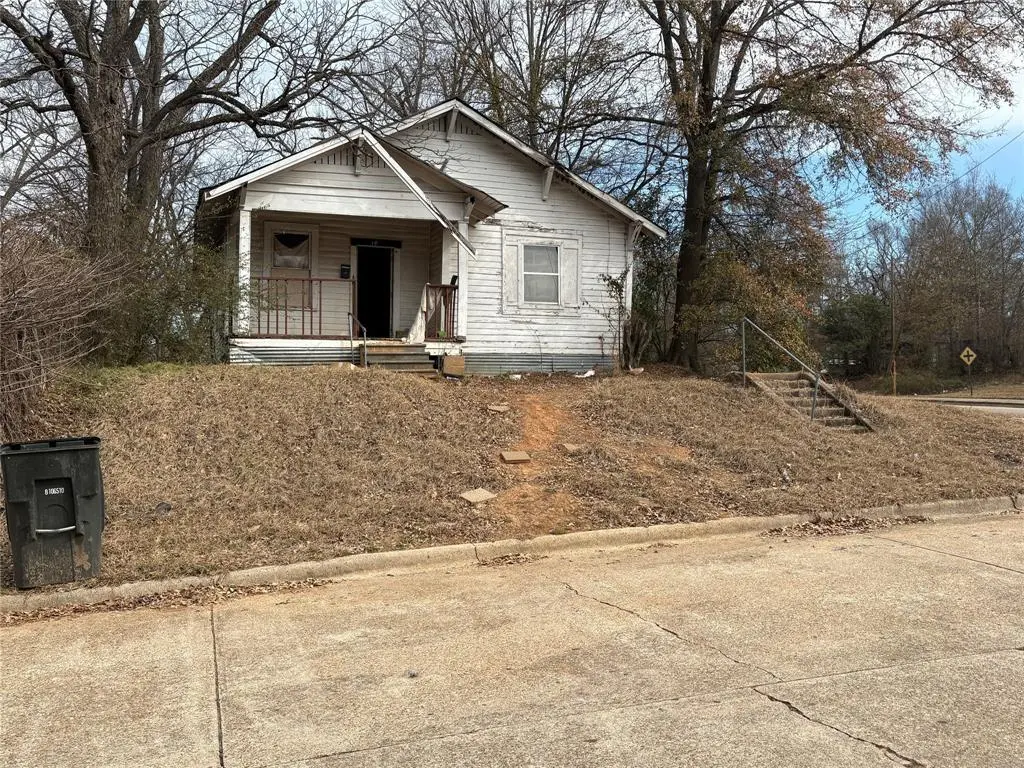
1151 Kenneth Ave · Shreveport, LA
Flood risk 1/10 · Minimal
- FEMA flood zone
- X (unshaded)
- Chance of flooding over 30 yrs
- 0.0%
- Est. flood insurance / yr
- $507 – $1,088
Fire risk 1/10 · Minimal
- Est. fire insurance / yr
- $1,269 – $2,357
Heat risk 7/10 · Major
- Hot days now (above 110°F)
- 7 days/yr
- Hot days in 30 yrs
- 22 days/yr
Wind risk 6/10 · Moderate
- Chance of severe wind over 30 yrs
- 64.0%
Air-quality risk 2/10 · Minimal
- Unhealthy air days now
- 1 days/yr
- Unhealthy air days in 30 yrs
- 1 days/yr
Risk factors via First Street. Map © Google.
Why this score? — see what drove the A- grade
The composite is a weighted blend of 9 inputs, each scored 0–100. Each bar is that input's sub-score; the figure is the points it added to the 100-point composite (weight × sub-score).
- Cash flow +30.0/30.0
- ARV discount +15.0/15.0
- 1% rule +10.0/10.0
- DSCR +10.0/10.0
- Appreciation +4.9/10.0
- Livability +3.0/5.0
- Rent growth +2.5/5.0
- Condition / age +2.5/5.0
- Schools +2.2/10.0
$24,000
🖨 Deal sheet 📄 Offer letter ✓ Due diligence
Listing remarks MLS
Investment Opportunity! This is property part of a 6 Property Package Deal. Seller is willing to sell smaller package as well. With some renovation and improvements, this property could become a good cash flowing property. Here is some information for all of the properties that is part of the package deal. Each property is under 30K! 1941 Walnut St 22k, 450 E 84th st 25k, 3419 W 70th st 26k, 2529 Merwin st 26k, 1151 Kenneth Ave 23k, 2814 Mertis Ave 21k.
Key facts
- 0.53 acre lot
- Parking
- Built 1977
Neighborhood map
What this means for you Summary
Snapshot
- This is a 3-bed/1.0-bath single-family listed at $24k.
Deal economics
- At list price, monthly cash flow is $453 ($5k/yr) — positive.
- The deal already cash-flows at list — no discount required.
- Meets the 1% rule at list price ($780 rent vs $24k).
- Recommended offer: $23k (6.0% below list) — sets the bar for market timing.
- Cap rate 28.9% vs local median 5.7% in Shreveport — top-decile yield for the area; either an underpriced asset or a hidden risk that comps aren't pricing in. Stress-test before assuming the spread holds.
Location & tenants
- Location reads 59/100 on livability (#270 in LA) — a working-class tenant base; expect higher turnover. Strengths: cost of living A+, housing A; Watch: schools D+, crime F, amenities F.
- Caddo Parish (urban): math 21% / reading 32% proficiency, ranked #53 of 98 in LA (top 54%) — low school quality limits family demand, transient renter base, plan for 1-2y turnover; 64% free/reduced lunch — lower-income household profile, screen leases tightly.
- Market conditions: 69 active listings in the ZIP; 13 comparable units currently listed for rent nearby; rentals at typical pace (median 21d on market — plan ~3-4 weeks tenant-placement turnaround); 221 units permitted in Caddo Parish in 2024 (0 in 5+ unit buildings).
Forward outlook
- In year one you build about $126 of equity ($166 loan paydown + $-40 appreciation (-0.2% local appreciation)).
- Caddo County population projected at -15% by 2050 — secular population decline; favor cash flow + early exit over multi-decade hold.
- At projected returns (-0.2% appreciation + 3.0% rent growth), your $7k cash investment doubles in ~2 years — after that, you're playing with house money.
Negotiation context
- It's been on market 86 days — a 6% lower offer ($23k) is reasonable based on typical stale-listing flexibility.
- Current owner paid $9k; list at $24k implies a 167% gain — meaningful room to come down on a strong offer.
Risks & watch-outs
- Climate carrying-cost: major wind risk, 64% chance of damaging wind over 30y; extreme-heat days projected 7→22/yr by 2055 (HVAC capex compounding) — expect insurance premiums to compound above CPI over the hold.
Questions for the listing agent
- It's been on market 86 days. Have you received any prior offers? Is the seller open to a 6% concession, seller financing, or rate buy-down credit?
- Built in 1977 — when were the roof, HVAC, electrical panel, plumbing, and water heater last replaced?
- Why hasn't it sold? Are there any deal-killer items the seller is aware of (foundation, flood, title, zoning, code violations)?
- Is there a deadline driving the sale (1031 exchange, divorce, estate, relocation)? That informs how much negotiation room exists.
- Schools are D-rated, which usually means shorter tenancies and higher turnover. Who's the typical renter profile here, and what's been the actual vacancy rate?
- Crime grade is F in this area — have there been break-ins, vandalism, or insurance claims at this property in the last 3 years? What carrier currently insures it and at what premium?
- What's the average days-on-market for RENTAL listings here right now (not sales)? A rising rental-DOM trend means longer vacancies and softer asking-rent achievability than the comps imply.
- What's the recent tenant-quality profile in this submarket — average credit score on applications, eviction rate, late-payment / NSF rate, and stable-employment percentage? A property-management company in the area should have these aggregated.
- How much new for-sale + rental construction is in the pipeline within 1–3 miles? Heavy new supply typically softens prices + rents 12–24 months out; constrained supply supports both.
Investment metrics
- 1% rule
- 3.25% ✓
- Cap rate
- 28.95%
- Cash-on-cash
- 80.91%
- DSCR
- 4.60
- GRM
- 2.6
CMA / ARV
- ARV (median comp)
- $40,463
- List price
- $24,000
- Delta
- -40.69%
- Verdict
- UNDERPRICED
- Comps
- 20 within 1.0 mi
Show comp detail 12 sales within ~0.75 mi
| Address | Dist | Beds/Ba | Sqft | Sold | Price | $/sf | Match |
|---|---|---|---|---|---|---|---|
| 2031 Ashton St | 0.33mi | 3/1.0 | 1,279 (-1%) | 1mo | $17,000 | $13 | 81 |
| 2751 Looney St | 0.25mi | 3/2.0 | 1,235 (-5%) | 2mo | $19,000 | $15 | 75 |
| 2609 Ashton St | 0.13mi | 3/1.0 | 1,144 (-12%) | 1mo | $55,000 | $48 | 73 |
| 2209 Murphy St | 0.22mi | 3/1.5 | 1,187 (-8%) | 3mo | $40,000 | $34 | 71 |
| 3132 Looney St | 0.58mi | 3/1.0 | 1,375 (+6%) | 7mo | $57,500 | $42 | 57 |
| 2806 W Caperton St | 0.53mi | 2/1.0 (-1) | 1,232 (-5%) | 10mo | $23,000 | $19 | 54 |
| 2631 Lillian St | 0.62mi | 3/2.0 | 1,227 (-5%) | 6mo | $125,000 | $102 | 53 |
| 2532 Lillian St | 0.59mi | 4/1.0 (+1) | 1,387 (+7%) | 6mo | $32,000 | $23 | 51 |
| 2230 Darien St | 0.75mi | 3/2.0 | 1,221 (-6%) | 2mo | $47,000 | $38 | 50 |
| 3137 Looney St | 0.58mi | 2/1.0 (-1) | 1,134 (-13%) | 2mo | $60,000 | $53 | 46 |
| 2105 Wyoming Cir | 0.54mi | 3/2.0 | 1,438 (+11%) | 10mo | $96,500 | $67 | 44 |
| 3102 W Laurel St | 0.59mi | 3/2.0 | 1,169 (-10%) | 13mo | $55,000 | $47 | 41 |
Match score weights: distance 35% · size 25% · config 20% · recency 20%. Top-matched comps best support the ARV.
Projected returns pro-forma
-0.17% appreciation · 3.0% rent growth · sell at horizon
- IRR
- 83.1%
- Equity multiple
- 5.16×
- Total profit
- $27,978
- Equity at exit
- $6,771
- IRR
- 84.7%
- Equity multiple
- 10.60×
- Total profit
- $64,500
- Equity at exit
- $7,983
Cash invested: $6,720 (down + closing). Projections, not guarantees.
Landlord ↔ Tenant lean methodology
- Overall (STATE)
- 90 Strongly Landlord-Friendly
- State Louisiana
- 90 Strongly Landlord-Friendly · R+12
- County
- — inherits STATE
- City
- — inherits STATE
ZIP-level market 71103
- Home prices YoY
- -0.6%
- Active inventory
- 69
- Price-to-rent
- 2.6×
Monthly cashflow live
- Estimated rent
- $780 high interval (Pro) →
- Mortgage (P&I)
- −$126
- Tax from tax record
- −$27 /mo · $323/yr
- Insurance
- −$10
- HOA
- −$0
- Vacancy / Maint / Mgmt
- −$164
- Net cashflow
- $453
Break-even live
UW: 25.0% down · 7.5% · 30yr · 1.5% tax · 5.0% vac · 8.0% maint · 8.0% mgmt
Financing live
Cash to close
- Down payment
- $6,000
- Closing costs
- $720
- Reserves months
- —
- Total cash needed
- —
Loan-product check · same deal, 3 products live
Conventional
25% down · 7.5% · 30yr
- Down + closing
- —
- Monthly P&I
- —
- Monthly cashflow
- —
- DSCR
- —
- Eligible?
- —
Personal DTI + credit; lowest rate.
DSCR
20% down · 8.5% · 30yr
- Down + closing
- —
- Monthly P&I
- —
- Monthly cashflow
- —
- DSCR
- —
- Eligible?
- —
No personal income docs; deal must DSCR.
Hard money
10% down · 12.0% · 12mo
- Down + closing
- —
- Monthly P&I
- —
- Monthly cashflow
- —
- DSCR
- —
- Eligible?
- —
Short-term bridge; refi at stabilization.
Rent comps 13 comps
| Address | Beds | Baths | Sqft | Rent | $/sqft | DOM | Units | Dist |
|---|---|---|---|---|---|---|---|---|
| 2712 Ashton St Shreveport, LA | 2.0 | 1.0 | 875 | $700 | $0.80 | 13d | 1 | 0.19mi |
| 2042 Laurel St Shreveport, LA | 3.0 | 1.0 | 1100 | $800 | $0.73 | 43d | 1 | 0.45mi |
| 3022 Lillian St Shreveport, LA | 2.0 | 1.0 | 1115 | $695 | $0.62 | 21d | 1 | 0.78mi |
| 1818 Perrin St Shreveport, LA | 3.0 | 1.5 | 1129 | $895 | $0.79 | 43d | 1 | 0.83mi |
| 1719 Lakeshore Dr Shreveport, LA | 3.0 | 1.5 | 1200 | $950 | $0.79 | 43d | 1 | 0.89mi |
| 1928 Alston St Shreveport, LA | 3.0 | 2.0 | 1100 | $750 | $0.68 | 43d | 1 | 0.93mi |
| 3612 Michigan Blvd Shreveport, LA | 2.0 | 1.0 | 1200 | $615 | $0.51 | 13d | 1 | 1.07mi |
| 3323 Darien St Shreveport, LA | 3.0 | 1.0 | 1200 | $785 | $0.65 | 43d | 1 | 1.07mi |
| 3420 Darien St Shreveport, LA | 2.0 | 1.0 | 1200 | $665 | $0.55 | 13d | 1 | 1.11mi |
| 3515 Stonewall St Shreveport, LA | 2.0 | 1.0 | 1000 | $600 | $0.60 | 13d | 1 | 1.22mi |
| 2134 Queens Hwy Shreveport, LA | 3.0 | 1.5 | 1374 | $1,475 | $1.07 | 21d | 1 | 1.39mi |
| 3240 Jackson St Shreveport, LA | 2.0 | 1.0 | 1014 | $700 | $0.69 | 13d | 1 | 1.43mi |
| 2222 Carleton St Shreveport, LA | 3.0 | 2.0 | 1800 | $750 | $0.42 | 13d | 1 | 1.48mi |
Listing history 20 events
-
2026-06-18days on market $24,000 Active 86 DOM
-
2026-06-17days on market $24,000 Active 85 DOM
-
2026-06-16days on market $24,000 Active 84 DOM
-
2026-06-15days on market $24,000 Active 83 DOM
-
2026-06-14days on market $24,000 Active 81 DOM
-
2026-06-13days on market $24,000 Active 80 DOM
-
2026-06-10days on market $24,000 Active 78 DOM
-
2026-06-09days on market $24,000 Active 77 DOM
-
2026-06-08days on market $24,000 Active 76 DOM
-
2026-06-07days on market $24,000 Active 75 DOM
-
2026-06-05days on market $24,000 Active 72 DOM
-
2026-06-03days on market $24,000 Active 71 DOM
-
2026-06-02days on market $24,000 Active 70 DOM
-
2026-06-01days on market $24,000 Active 69 DOM
-
2026-05-31days on market $24,000 Active 68 DOM
-
2026-05-30days on market $24,000 Active 67 DOM
-
2026-03-24$24,000 Active 457-char remark
Show marketing remark (457 chars)
Investment Opportunity! This is property part of a 6 Property Package Deal. Seller is willing to sell smaller package as well. With some renovation and improvements, this property could become a good cash flowing property. Here is some information for all of the properties that is part of the package deal. Each property is under 30K! 1941 Walnut St 22k, 450 E 84th st 25k, 3419 W 70th st 26k, 2529 Merwin st 26k, 1151 Kenneth Ave 23k, 2814 Mertis Ave 21k.
-
2017-08-01soldstatus $9,000
-
2006-04-05soldstatus
-
1984-03-12soldstatus
ⓘ Source: listings_history table (triggers on properties + properties_extension) + one-shot
backfill from property_details.listing_events for pre-trigger history.
Tax reassessment forecast LA · Resets to sale price
- Current annual tax
- $323 · $27/mo
- Projected year-2 tax
- $323 · $27/mo
- Expected delta
- $0/yr ($0/mo · 0.0%)
ⓘ Screening estimate from a state-policy table — verify with the county assessor before closing.
Climate risk First Street
- Flood 1/10 Low FEMA zone X (unshaded) · 0% chance over 30 yrs
- Wildfire 1/10 Low
- Heat 7/10 Severe 7 d/yr ≥110°F today · 22 d/yr by 30 yrs out
- Wind 6/10 Major 64% chance of damaging wind over 30 yrs
- Air quality 2/10 Low 1 unhealthy d/yr today · 1 by 30 yrs out
Nearby sold comps map
Loading sold comps map…
Walkable amenities ~0.75 mi
Loading nearby amenities…
Taxation est. · year 1
- Rental income
- $9,355
- − Mortgage interest
- −$1,344
- − Property taxes
- −$323
- − Insurance
- −$120
- − Repairs & maintenance
- −$748
- − Management
- −$748
- − Depreciation
- −$698
- Taxable income
- $5,372
- Est. tax owed @ 24.0%
- −$1,289
- After-tax cash flow
- $4,147/yr
For passive investors: Depreciation is non-cash, so a rental often shows a tax loss while cash-flowing — sheltering income. Rental losses are passive: they offset passive income freely, and up to $25,000/yr can offset ordinary (W-2) income if you actively participate and your MAGI is under $100k (phasing out to $0 by $150k); unused losses carry forward. On sale, claimed depreciation is recaptured at up to 25%, and gains may owe capital-gains tax (a 1031 exchange can defer both). Figures are a year-1 estimate at your 24.0% rate — not tax advice; consult a CPA.
Schools (NCES district)
- District
- Caddo Parish
- NCES district ID
- 2200300
- Math proficiency
- 21% ▼ -33.00%
- Reading proficiency
- 32% ▼ -30.00%
- Median HH income
- $39,227
- Composite
- 22.23/100
- National rank
- #8148
- State rank
- #53 of 98 in LA
Livability — Shreveport
- Score
- 59/100
- State rank
- #270
- US rank
- #19730
Category grades
Schools grade is shown separately in the Schools card above.
Census & demographics
- Census place
- Shreveport, LA
- City population
- 164,123
- Population (ZIP)
- 6,142
Population outlook (Caddo County) Hauer SSP2
- Today (2025)
- 243,190 people
- By 2030
- 237,231 · -2.5%
- By 2040
- 222,502 · -8.5%
- By 2050
- 206,516 · -15.1%
- By 2075
- 165,706 · -31.9%
- By 2100
- 122,262 · -49.7%
Race, ethnicity, and origin ACS 2023
- Neighborhood character
- Predominantly Black (81%)
- Race & ethnicity
- Black 81% White 17% Hispanic / Latino 1%
- Common ancestry
- Slovak 3% Hispanic 1%
- Languages at home
- 99% English-only · Spanish 1%
Political lean MEDSL · Caddo
- 2024 margin
- Toss-up / Even · D 51.6% · R 47.0% · Other 1.4%
- 2008→2024 swing
- +1.6pp toward D · 2008: 3.0pp · 2024: 4.6pp
- All cycles
- 2024: D+4.6 2020: D+6.8 2016: D+4.2 2012: D+4.9 2008: D+3.0
Not yet ingested
- Civics
- —
Market trends
- HPI YoY
- ▼ -0.17%
- Current HPI
- 26.3904
- Rent YoY
- —
- Metro
- —
- State GDP YoY
- ▲ 3.29%
- F500 in state
- 10
Industry mix (Fortune 500 HQ in LA)
| Industry | F500 HQs | Revenue |
|---|---|---|
| Telecommunications | 2 | $23B |
|
||
| Utilities | 1 | $12B |
|
||
| Wholesale / Distribution | 1 | $5B |
|
||
| Advertising | 1 | $2B |
|
||
Price history
+166.7% since first listed4 events — show timeline
- 2026-03-24 Listed $24,000 NTREIS
- 2017-08-01 Sold (Public Records) $9,000 Public Records
- 2006-04-05 Sold (Public Records) — Public Records
- 1984-03-12 Sold (Public Records) — Public Records
Property tax history
-1.7%/yrLatest (2025): $323 · +0.4% YoY. Source: county tax records.
Cash-flow waterfall
monthlySold comps — $/sqft
last 12 mo · ≤1 miLoading sold comps…