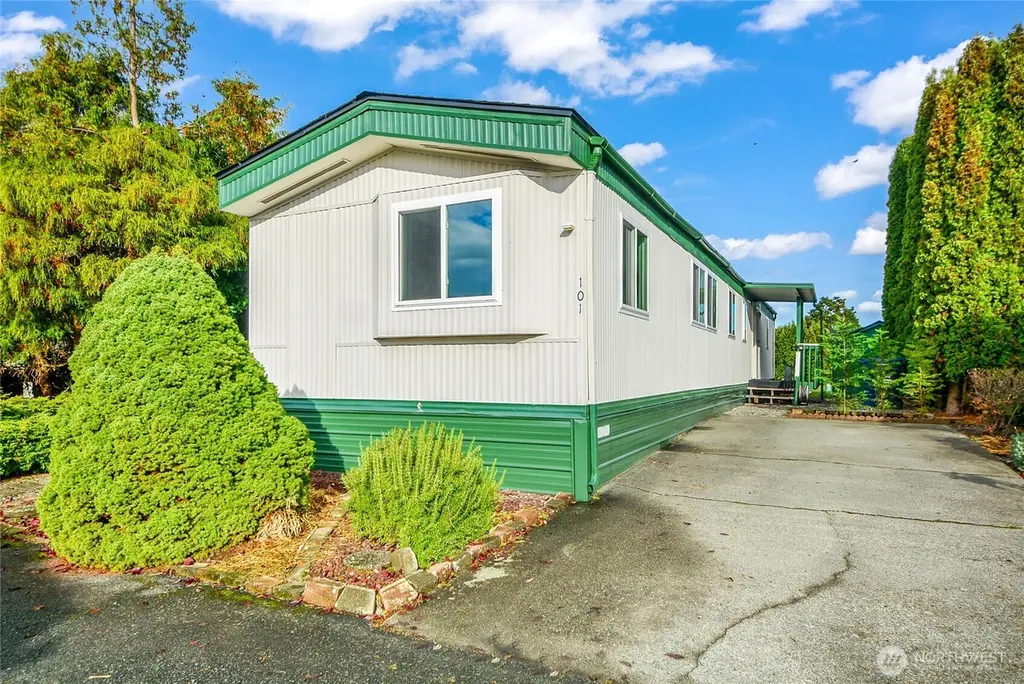
16600 25th Ave NE #101 · Marysville, WA
Flood risk No data
- FEMA flood zone
- —
- Chance of flooding over 30 yrs
- —
- Est. flood insurance / yr
- —
Fire risk No data
- Est. fire insurance / yr
- —
Heat risk No data
- Hot days now (above threshold)
- —
- Hot days in 30 yrs
- —
Wind risk No data
- Chance of severe wind over 30 yrs
- —
Air-quality risk No data
- Unhealthy air days now
- —
- Unhealthy air days in 30 yrs
- —
Risk factors via First Street. Map © Google.
Why this score? — see what drove the B- grade
The composite is a weighted blend of 9 inputs, each scored 0–100. Each bar is that input's sub-score; the figure is the points it added to the 100-point composite (weight × sub-score).
- Cash flow +30.0/30.0
- 1% rule +10.0/10.0
- DSCR +10.0/10.0
- Schools +4.4/10.0
- Livability +4.2/5.0
- Rent growth +3.1/5.0
- Condition / age +2.5/5.0
- ARV discount +2.2/15.0
- Appreciation +0.0/10.0
$99,500
🖨 Deal sheet (PDF) 📄 Offer letter ✓ Due diligence
Listing remarks
Move in ready! 55+ Community has a great one! This Super Clean 2 BDRM, 2 BA with tip out, is available NOW! Primary BDRM has its own private bathroom with new walk-in shower. Spacious kitchen! All appliances including microwave, washer/dryer. New Roof, New Windows, and Ext paint is NICE! Mini split added in living area for comfort. Mature landscaping. Shed included. Fantastic grassy area behind this home for you! Seasonal pool and clubhouse included w/ monthly events if you are interested. Pets okay, subject to some restrictions. RV parking available for very low fee. One of the lowest space rents in Snohomish County that INCLUDES sewer/water. Minutes from 1-5, located near Target-Costco. B
Key facts
- New walk-in shower
- Private bathroom
- Mature landscaping
Tags
Neighborhood map
What this means for you Summary
Snapshot
- This is a 2-bed/2.0-bath manufactured listed at $100k.
Deal economics
- At list price, monthly cash flow is $1k ($14k/yr) — positive.
- The deal already cash-flows at list — no discount required.
- Meets the 1% rule at list price ($2k rent vs $100k).
- Recommended offer: $88k (12.0% below list) — sets the bar for market timing.
- Cap rate 20.7% vs local median 3.0% in Marysville — top-decile yield for the area; either an underpriced asset or a hidden risk that comps aren't pricing in. Stress-test before assuming the spread holds.
Location & tenants
- Location reads 84/100 on livability (#43 in WA, #768 nationally) — a professional / high-income tenant draw. Strengths: commute A+, employment A+, housing A+; Watch: cost of living F.
- Lakewood School District (suburban): math 41% / reading 55% proficiency, ranked #151 of 291 in WA (top 52%) — families likely to look elsewhere, expect single-tenant / working-renter base with shorter leases.
- Market conditions: Rents rising (+2.3%/yr); 215 active listings in the ZIP; 9 comparable units currently listed for rent nearby; rentals leasing fast (median 0d on market — plan ~1-2 weeks tenant-placement turnaround); solid renter incomes; 3,982 units permitted in Snohomish County in 2024 (1,492 in 5+ unit buildings).
Forward outlook
- Local home prices are declining (-3.0%/yr); year-one equity from $688 of loan paydown is wiped out by about $3k of value loss. Plan a longer hold.
- Snohomish County population projected at +30% by 2050 — long-run rental-demand tailwind backs the buy-and-hold thesis.
- At projected returns (-3.0% appreciation + 2.3% rent growth), your $28k cash investment doubles in ~3 years — after that, you're playing with house money.
Negotiation context
- It's been on market 197 days — a 12% lower offer ($88k) is reasonable based on typical stale-listing flexibility.
- 2 sale attempts since 10y ago; this cycle's ask has dropped $16k (13%) from the opening price — seller is motivated, your offer sets the floor, not the list.
- Current owner paid $22k; list at $100k implies a 363% gain — meaningful room to come down on a strong offer.
Questions for the listing agent
- It's been on market 197 days. Have you received any prior offers? Is the seller open to a 12% concession, seller financing, or rate buy-down credit?
- Built in 1979 — when were the roof, HVAC, electrical panel, plumbing, and water heater last replaced?
- Why hasn't it sold? Are there any deal-killer items the seller is aware of (foundation, flood, title, zoning, code violations)?
- Is there a deadline driving the sale (1031 exchange, divorce, estate, relocation)? That informs how much negotiation room exists.
- Schools are B-rated — typically a magnet for longer-tenancy family renters. What's the average tenant stay here, and is there a school-zone premium baked into asking?
- What's the average days-on-market for RENTAL listings here right now (not sales)? A rising rental-DOM trend means longer vacancies and softer asking-rent achievability than the comps imply.
- What's the recent tenant-quality profile in this submarket — average credit score on applications, eviction rate, late-payment / NSF rate, and stable-employment percentage? A property-management company in the area should have these aggregated.
- How much new for-sale + rental construction is in the pipeline within 1–3 miles? Heavy new supply typically softens prices + rents 12–24 months out; constrained supply supports both.
Investment metrics
- 1% rule
- 2.31% ✓
- Cap rate
- 20.74%
- Cash-on-cash
- 51.61%
- DSCR
- 3.30
- GRM
- 3.6
CMA / ARV
- ARV (median comp)
- $88,977
- List price
- $99,500
- Delta
- 11.83%
- Verdict
- OVERPRICED
- Comps
- 3 within 1.0 mi
Show comp detail 7 sales within ~0.75 mi
| Address | Dist | Beds/Ba | Sqft | Sold | Price | $/sf | Match |
|---|---|---|---|---|---|---|---|
| 16600 25th Ave NE #109 | 0.00mi | 2/2.0 | 1,008 (0%) | 0mo | $100,000 | $99 | 100 |
| 16600 25th Ave NE #71 | 0.00mi | 2/2.0 | 924 (-8%) | 2mo | $69,000 | $75 | 85 |
| 16600 25th Ave NE #18 | 0.00mi | 2/2.0 | 924 (-8%) | 8mo | $89,000 | $96 | 80 |
| 16600 25th Ave NE #55 | 0.00mi | 2/1.0 | 924 (-8%) | 14mo | $85,000 | $92 | 71 |
| 16600 25th Ave NE #15 | 0.00mi | 2/1.0 | 924 (-8%) | 14mo | $95,000 | $103 | 70 |
| 16600 25th Ave NE #73 | 0.00mi | 2/1.0 | 1,056 (+5%) | 22mo | $89,000 | $84 | 70 |
| 16600 25th Ave NE #78 | 0.00mi | 2/1.0 | 924 (-8%) | 24mo | $73,000 | $79 | 62 |
Match score weights: distance 35% · size 25% · config 20% · recency 20%. Top-matched comps best support the ARV.
Projected returns pro-forma
-3.0% appreciation · 2.3% rent growth · sell at horizon
- IRR
- 48.7%
- Equity multiple
- 3.10×
- Total profit
- $58,580
- Equity at exit
- $14,836
- IRR
- 54.0%
- Equity multiple
- 6.12×
- Total profit
- $142,744
- Equity at exit
- $8,603
Cash invested: $27,860 (down + closing). Projections, not guarantees.
Landlord ↔ Tenant lean methodology
- Overall (STATE)
- 28 Tenant-Leaning
- State Washington
- 28 Tenant-Leaning · D+8
- County
- — inherits STATE
- City
- — inherits STATE
ZIP-level market 98271
- Rents YoY
- 2.3%
- Active inventory
- 215
- Price-to-rent
- 3.6×
Monthly cashflow live
- Estimated rent
- $2,301 high interval (Pro) →
- Mortgage (P&I)
- −$522
- Tax from tax record
- −$56 /mo · $677/yr
- Insurance
- −$41
- HOA
- −$0
- Vacancy / Maint / Mgmt
- −$483
- Net cashflow
- $1,198
Break-even live
Sensitivity live
| Price | -10% $1,255 | -5% $1,226 | +0% $1,198 | +5% $1,170 | +10% $1,142 |
|---|---|---|---|---|---|
| Rent | -10% $1,017 | -5% $1,107 | +0% $1,198 | +5% $1,289 | +10% $1,380 |
| Rate | -1.0pp $1,248 | -0.5pp $1,224 | base $1,198 | +0.5pp $1,173 | +1.0pp $1,146 |
UW: 25.0% down · 7.5% · 30yr · 1.5% tax · 5.0% vac · 8.0% maint · 8.0% mgmt
Financing live
Cash to close
- Down payment
- $24,875
- Closing costs
- $2,985
- Reserves months
- —
- Total cash needed
- —
Loan-product check · same deal, 3 products live
Conventional
25% down · 7.5% · 30yr
- Down + closing
- —
- Monthly P&I
- —
- Monthly cashflow
- —
- DSCR
- —
- Eligible?
- —
Personal DTI + credit; lowest rate.
DSCR
20% down · 8.5% · 30yr
- Down + closing
- —
- Monthly P&I
- —
- Monthly cashflow
- —
- DSCR
- —
- Eligible?
- —
No personal income docs; deal must DSCR.
Hard money
10% down · 12.0% · 12mo
- Down + closing
- —
- Monthly P&I
- —
- Monthly cashflow
- —
- DSCR
- —
- Eligible?
- —
Short-term bridge; refi at stabilization.
Rent comps 9 comps
| Address | Beds | Baths | Sqft | Rent | $/sqft | DOM | Units | Dist |
|---|---|---|---|---|---|---|---|---|
| 2100 172nd St NE Marysville, WA | 1.0–3.0 | 1.0–2.0 | 916 | $2,537 | $2.77 | 0d | 8 | 0.41mi |
| 2203 172nd St NE Marysville, WA | 1.0–2.0 | 1.0 | 631 | $1,699 | $2.69 | 0d | 6 | 0.51mi |
| 2002 174th St NE Marysville, WA | 1.0–3.0 | 1.0–2.0 | 1069 | $2,540 | $2.37 | 0d | 5 | 0.52mi |
| 17500 25th Ave NE Marysville, WA | 1.0–3.0 | 1.0–2.0 | 963 | $2,335 | $2.42 | 0d | 40 | 0.60mi |
| 17313 Smokey Point Blvd Arlington, WA | 2.0 | 1.0 | 800 | $1,738 | $2.17 | 0d | 2 | 0.95mi |
| 18111 25th Ave NE Marysville, WA | 2.0–3.0 | 1.5–2.5 | 1284 | $2,225 | $1.73 | 0d | 13 | 0.97mi |
| 17505 38th Dr NE Arlington, WA | 3.0 | 2.0 | 1050 | $2,800 | $2.67 | 11d | 1 | 1.12mi |
| 17309 40th Ave NE Arlington, WA | 1.0–2.0 | 1.0 | 660 | $2,063 | $3.12 | 0d | 10 | 1.13mi |
| 18506 Smokey Point Blvd Arlington, WA | 1.0–3.0 | 1.0–2.0 | 881 | $2,036 | $2.31 | 0d | 15 | 1.39mi |
Listing history 7 events
-
2026-03-16price $99,500
-
2026-02-09price $104,500
-
2026-01-08price $109,500
-
2025-11-06$115,000 Active
-
2016-12-16soldstatus $21,500 Sold
-
2016-11-11status Pending
-
2016-11-11$21,500 Active
ⓘ Source: listings_history table (triggers on properties + properties_extension) + one-shot
backfill from property_details.listing_events for pre-trigger history.
Tax reassessment forecast WA · Resets to sale price
- Current annual tax
- $677 · $56/mo
- Projected year-2 tax
- $975 · $81/mo
- Expected delta
- +$298/yr (+$25/mo · 44.1%)
ⓘ Screening estimate from a state-policy table — verify with the county assessor before closing.
Nearby sold comps map
Loading sold comps map…
Walkable amenities ~0.75 mi
Loading nearby amenities…
Taxation est. · year 1
- Rental income
- $27,614
- − Mortgage interest
- −$5,574
- − Property taxes
- −$677
- − Insurance
- −$498
- − Repairs & maintenance
- −$2,209
- − Management
- −$2,209
- − Depreciation
- −$2,895
- Taxable income
- $13,554
- Est. tax owed @ 24.0%
- −$3,253
- After-tax cash flow
- $11,127/yr
For passive investors: Depreciation is non-cash, so a rental often shows a tax loss while cash-flowing — sheltering income. Rental losses are passive: they offset passive income freely, and up to $25,000/yr can offset ordinary (W-2) income if you actively participate and your MAGI is under $100k (phasing out to $0 by $150k); unused losses carry forward. On sale, claimed depreciation is recaptured at up to 25%, and gains may owe capital-gains tax (a 1031 exchange can defer both). Figures are a year-1 estimate at your 24.0% rate — not tax advice; consult a CPA.
Schools (NCES district)
- District
- Lakewood School District
- NCES district ID
- 5304260
- Math proficiency
- 41% ▼ -4.00%
- Reading proficiency
- 55% ▬ 0.00%
- Median HH income
- $63,106
- Composite
- 44.45/100
- National rank
- #6089
- State rank
- #151 of 291 in WA
Livability — Marysville
- Score
- 84/100
- State rank
- #43
- US rank
- #768
Category grades
Schools grade is shown separately in the Schools card above.
Census & demographics
- Census place
- Marysville, WA
- County
- Snohomish County · 786,756 people
- City population
- 85,887
- Metro
- Seattle-Tacoma-Bellevue, WA
- Population (ZIP)
- 30,838
- Household income
- $95,654
- Rent vs Own
- Severe rent burden
- 929.0
Population outlook (Snohomish County) Hauer SSP2
- Today (2025)
- 899,800 people
- By 2030
- 960,975 · +6.8%
- By 2040
- 1,074,447 · +19.4%
- By 2050
- 1,171,954 · +30.2%
- By 2075
- 1,384,849 · +53.9%
- By 2100
- 1,497,296 · +66.4%
Race, ethnicity, and origin ACS 2023
- Neighborhood character
- Predominantly White (66%)
- Race & ethnicity
- White 66% Two or more races 13% Hispanic / Latino 13% Native American 7% Asian 5% Black 1%
- Hispanic origin (detail)
- Mexican 9%
- Common ancestry
- Portuguese 6% Iranian 3% Lithuanian 2%
- Foreign-born
- 9% · Canada, China, South Korea
- Languages at home
- 86% English-only · Spanish 8% Russian/Polish/Slavic 1% Tagalog/Filipino 1%
Political lean MEDSL · Snohomish
- 2024 margin
- D (+19.0) · D 57.8% · R 38.9% · Other 3.3%
- 2008→2024 swing
- +0.1pp no change · 2008: 18.9pp · 2024: 19.0pp
- All cycles
- 2024: D+19.0 2020: D+20.6 2016: D+16.6 2012: D+16.2 2008: D+18.9
Not yet ingested
- Civics
- —
Market trends
- HPI YoY
- ▼ -666.16%
- Current HPI
- 305.285
- Rent YoY
- ▲ 2.30%
- Metro
- Seattle-Tacoma-Bellevue, WA
- State GDP YoY
- ▲ 4.65%
- F500 in state
- 22
Industry mix (Fortune 500 HQ in WA)
| Industry | F500 HQs | Revenue |
|---|---|---|
| Retail | 2 | $269B |
|
||
| Technology / Retail | 1 | $638B |
|
||
| Technology | 1 | $245B |
|
||
| Telecommunications | 1 | $38B |
|
||
| Food / Beverage | 1 | $36B |
|
||
| Automotive / Trucks | 1 | $34B |
|
||
Price history
+362.8% since first listed7 events — show timeline
- 2026-03-16 Price Changed $99,500 NWMLS as Distributed by MLS Grid
- 2026-02-09 Price Changed $104,500 NWMLS as Distributed by MLS Grid
- 2026-01-08 Price Changed $109,500 NWMLS as Distributed by MLS Grid
- 2025-11-06 Listed $115,000 NWMLS as Distributed by MLS Grid
- 2016-12-16 Sold (MLS) $21,500 NWMLS as Distributed by MLS Grid
- 2016-11-11 Pending — NWMLS as Distributed by MLS Grid
- 2016-11-11 Listed $21,500 NWMLS as Distributed by MLS Grid
Property tax history
+11.6%/yrLatest (2026): $677 · +113.2% YoY. Source: county tax records.
Cash-flow waterfall
monthlySold comps — $/sqft
last 12 mo · ≤1 miLoading sold comps…