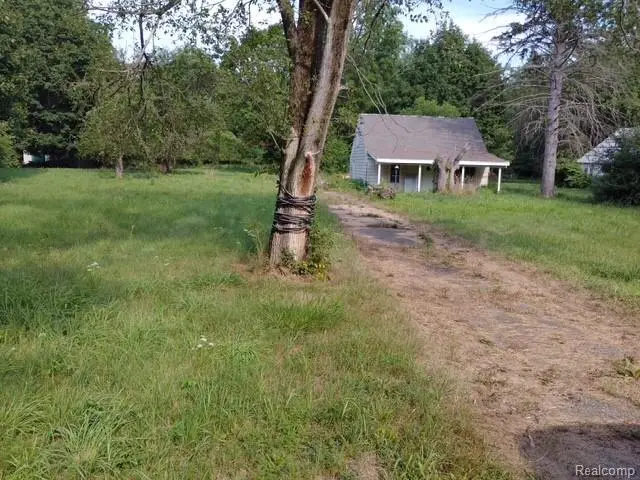
5090 Jackson Rd · Genesee, MI
Flood risk 1/10 · Minimal
- FEMA flood zone
- X (unshaded)
- Chance of flooding over 30 yrs
- 0.0%
- Est. flood insurance / yr
- $507 – $1,088
Fire risk 3/10 · Minor
- Est. fire insurance / yr
- $784 – $1,456
Heat risk 2/10 · Minimal
- Hot days now (above 97°F)
- 7 days/yr
- Hot days in 30 yrs
- 13 days/yr
Wind risk 2/10 · Minimal
- Chance of severe wind over 30 yrs
- —
Air-quality risk 2/10 · Minimal
- Unhealthy air days now
- 1 days/yr
- Unhealthy air days in 30 yrs
- 2 days/yr
Risk factors via First Street. Map © Google.
Why this score? — see what drove the B- grade
The composite is a weighted blend of 9 inputs, each scored 0–100. Each bar is that input's sub-score; the figure is the points it added to the 100-point composite (weight × sub-score).
- Cash flow +30.0/30.0
- 1% rule +10.0/10.0
- DSCR +10.0/10.0
- ARV discount +7.5/15.0
- Schools +2.7/10.0
- Rent growth +2.5/5.0
- Livability +2.5/5.0
- Condition / age +2.5/5.0
- Appreciation +0.0/10.0
$49,900
🖨 Deal sheet 📄 Offer letter ✓ Due diligence
Listing remarks MLS
A rare opportunity for investors, builders, and experienced rehabbers looking for their next project. This property has been taken down to the studs and requires a full renovation, providing a blank canvas to redesign and rebuild to your specifications. Situated on a spacious lot with convenient access to schools, shopping, dining, and major roadways, this property offers significant upside for the right buyer. Perfect for investors seeking a value-add project with the opportunity to create substantial equity. Property sold as-is. Cash buyers only.
Key facts
- Convenient access
- Spacious lot
- Full renovation
Tags
Property features AI
Exterior
- Parking: No garage
- Utilities: Private well water; Public sewer
- Home design: Single-family residence; One and one-half story; Ground-level entry
- Construction: Aluminum siding; Slab foundation
- Exterior features: Dirt road access; Lot dimensions approximately 116 x 401 (1.29 acres)
Interior
- Bathrooms: 1 full bathroom
- Heating & cooling: Forced air heating (natural gas); No cooling
- Interior features: Total of 3 rooms
Neighborhood map
What this means for you Summary
Snapshot
- This is a 3-bed/1.0-bath single-family listed at $50k.
Deal economics
- At list price, monthly cash flow is $303 ($4k/yr) — positive.
- The deal already cash-flows at list — no discount required.
- Meets the 1% rule at list price ($972 rent vs $50k).
- Recommended offer: $49k (1.5% below list) — sets the bar for market timing.
Location & tenants
- Location reads: area grade B — affects rentability + tenant quality, not the cash-flow math above.
- Kearsley Community School District (suburban): math 24% / reading 38% proficiency, ranked #343 of 540 in MI (top 64%) — families likely to look elsewhere, expect single-tenant / working-renter base with shorter leases.
- Market conditions: 202 active listings in the ZIP; 3 comparable units currently listed for rent nearby; rentals lingering (median 44d on market — plan ~5-8 weeks vacancy on turnover, expect pricing pressure); 67% of comp listings sitting > 30 days — soft ceiling on asking rent; 419 units permitted in Genesee County in 2024 (68 in 5+ unit buildings).
Forward outlook
- Local home prices are declining (-3.0%/yr); year-one equity from $345 of loan paydown is wiped out by about $1k of value loss. Plan a longer hold.
- Genesee County population projected at -27% by 2050 — secular population decline; favor cash flow + early exit over multi-decade hold.
- At projected returns (-3.0% appreciation + 3.0% rent growth), your $14k cash investment doubles in ~5 years — after that, you're playing with house money.
Negotiation context
- It's been on market 16 days — a 2% lower offer ($49k) is reasonable based on typical stale-listing flexibility.
- 7 sale attempts since 6y ago with the ask held roughly flat each time — persistent listings suggest the price (not the market) is what's stuck; bring a comps-based counter.
Risks & watch-outs
- Watch-outs: property tax is 4.4% of price; built in 1945 — expect roof / HVAC / electrical / plumbing capex.
Questions for the listing agent
- Built in 1945 — when were the roof, HVAC, electrical panel, plumbing, and water heater last replaced?
- Property tax is high relative to price — has the assessment been appealed recently, and will the sale trigger a re-assessment?
- Is there a deadline driving the sale (1031 exchange, divorce, estate, relocation)? That informs how much negotiation room exists.
- What's the average days-on-market for RENTAL listings here right now (not sales)? A rising rental-DOM trend means longer vacancies and softer asking-rent achievability than the comps imply.
- What's the recent tenant-quality profile in this submarket — average credit score on applications, eviction rate, late-payment / NSF rate, and stable-employment percentage? A property-management company in the area should have these aggregated.
- How much new for-sale + rental construction is in the pipeline within 1–3 miles? Heavy new supply typically softens prices + rents 12–24 months out; constrained supply supports both.
Investment metrics
- 1% rule
- 1.95% ✓
- Cap rate
- 13.57%
- Cash-on-cash
- 26.00%
- DSCR
- 2.16
- GRM
- 4.3
CMA / ARV
- ARV (on-the-fly)
- $174,080
- Comps found
- 3
Show comp detail 3 sales within ~0.75 mi
| Address | Dist | Beds/Ba | Sqft | Sold | Price | $/sf | Match |
|---|---|---|---|---|---|---|---|
| 5202 N Center Rd | 0.38mi | 3/2.0 | 1,524 (+12%) | 14mo | $195,000 | $128 | 47 |
| 4418 Branch Rd | 0.50mi | 4/1.0 (+1) | 1,184 (-13%) | 7mo | $75,000 | $63 | 44 |
| 4304 Branch Rd | 0.72mi | 4/1.0 (+1) | 1,268 (-7%) | 12mo | $175,000 | $138 | 40 |
Match score weights: distance 35% · size 25% · config 20% · recency 20%. Top-matched comps best support the ARV.
Projected returns pro-forma
-3.0% appreciation · 3.0% rent growth · sell at horizon
- IRR
- 19.8%
- Equity multiple
- 1.81×
- Total profit
- $11,286
- Equity at exit
- $7,440
- IRR
- 28.2%
- Equity multiple
- 3.51×
- Total profit
- $35,018
- Equity at exit
- $4,314
Cash invested: $13,972 (down + closing). Projections, not guarantees.
Landlord ↔ Tenant lean methodology
- Overall (STATE)
- 62 Landlord-Friendly
- State Michigan
- 62 Landlord-Friendly · EVEN
- County
- — inherits STATE
- City
- — inherits STATE
ZIP-level market 48506
- Active inventory
- 202
- Price-to-rent
- 4.3×
Monthly cashflow live
- Estimated rent
- $972 medium interval (Pro) →
- Mortgage (P&I)
- −$262
- Tax from tax record
- −$182 /mo · $2,188/yr
- Insurance
- −$21
- HOA
- −$0
- Vacancy / Maint / Mgmt
- −$204
- Net cashflow
- $303
Break-even live
UW: 25.0% down · 7.5% · 30yr · 1.5% tax · 5.0% vac · 8.0% maint · 8.0% mgmt
Financing live
Cash to close
- Down payment
- $12,475
- Closing costs
- $1,497
- Reserves months
- —
- Total cash needed
- —
Loan-product check · same deal, 3 products live
Conventional
25% down · 7.5% · 30yr
- Down + closing
- —
- Monthly P&I
- —
- Monthly cashflow
- —
- DSCR
- —
- Eligible?
- —
Personal DTI + credit; lowest rate.
DSCR
20% down · 8.5% · 30yr
- Down + closing
- —
- Monthly P&I
- —
- Monthly cashflow
- —
- DSCR
- —
- Eligible?
- —
No personal income docs; deal must DSCR.
Hard money
10% down · 12.0% · 12mo
- Down + closing
- —
- Monthly P&I
- —
- Monthly cashflow
- —
- DSCR
- —
- Eligible?
- —
Short-term bridge; refi at stabilization.
Rent comps 3 comps
| Address | Beds | Baths | Sqft | Rent | $/sqft | DOM | Units | Dist |
|---|---|---|---|---|---|---|---|---|
| 5200 N Genesee Rd Flint, MI | 2.0 | 1.0 | 1050 | $899 | $0.86 | 44d | 1 | 1.42mi |
| 5200 N Genesee Rd #104 Flint, MI | 2.0 | 1.0 | 925 | $899 | $0.97 | 13d | 1 | 1.42mi |
| 6614 Elmridge Dr Flint, MI | 3.0 | 1.0 | 895 | $895 | $1.00 | 44d | 1 | 1.45mi |
Listing history 13 events
-
2026-06-18days on market $49,900 Active 16 DOM
-
2026-06-17days on market $49,900 Active 15 DOM
-
2026-06-16days on market $49,900 Active 14 DOM
-
2026-06-15days on market $49,900 Active 13 DOM
-
2026-06-14days on market $49,900 Active 11 DOM
-
2026-06-13days on market $49,900 Active 10 DOM
-
2026-06-10days on market $49,900 Active 8 DOM
-
2026-06-09days on market $49,900 Active 7 DOM
-
2026-06-08days on market $49,900 Active 6 DOM
-
2026-06-07days on market $49,900 Active 5 DOM
-
2026-06-05days on market $49,900 Active 2 DOM
-
2026-06-03remarks 554-char remark
-
2026-06-03$49,900 Active 1 DOM
ⓘ Source: listings_history table (triggers on properties + properties_extension) + one-shot
backfill from property_details.listing_events for pre-trigger history.
Tax reassessment forecast MI · Partial reset (capped growth)
- Current annual tax
- $2,188 · $182/mo
- Projected year-2 tax
- $2,188 · $182/mo
- Expected delta
- $0/yr ($0/mo · 0.0%)
ⓘ Screening estimate from a state-policy table — verify with the county assessor before closing.
Climate risk First Street
- Flood 1/10 Low FEMA zone X (unshaded) · 0% chance over 30 yrs
- Wildfire 3/10 Moderate
- Heat 2/10 Low 7 d/yr ≥97°F today · 13 d/yr by 30 yrs out
- Wind 2/10 Low
- Air quality 2/10 Low 1 unhealthy d/yr today · 2 by 30 yrs out
Nearby sold comps map
Loading sold comps map…
Walkable amenities ~0.75 mi
Loading nearby amenities…
Taxation est. · year 1
- Rental income
- $11,660
- − Mortgage interest
- −$2,795
- − Property taxes
- −$2,188
- − Insurance
- −$250
- − Repairs & maintenance
- −$933
- − Management
- −$933
- − Depreciation
- −$1,452
- Taxable income
- $3,110
- Est. tax owed @ 24.0%
- −$746
- After-tax cash flow
- $2,887/yr
For passive investors: Depreciation is non-cash, so a rental often shows a tax loss while cash-flowing — sheltering income. Rental losses are passive: they offset passive income freely, and up to $25,000/yr can offset ordinary (W-2) income if you actively participate and your MAGI is under $100k (phasing out to $0 by $150k); unused losses carry forward. On sale, claimed depreciation is recaptured at up to 25%, and gains may owe capital-gains tax (a 1031 exchange can defer both). Figures are a year-1 estimate at your 24.0% rate — not tax advice; consult a CPA.
Schools (NCES district)
- District
- Kearsley Community School District
- NCES district ID
- 2620070
- Math proficiency
- 24% ▼ -14.00%
- Reading proficiency
- 38% ▼ -8.00%
- Median HH income
- $50,066
- Composite
- 26.99/100
- National rank
- #7068
- State rank
- #343 of 540 in MI
Livability — Genesee
No livability data for this city. (Only ~50 U.S. cities are tracked.)
Census & demographics
- County
- Genesee County · 221,329 people
- Metro
- Flint, MI
- Population (ZIP)
- 24,712
- Household income
- $47,929
- Rent vs Own
- Severe rent burden
- 954.0
Population outlook (Genesee County) Hauer SSP2
- Today (2025)
- 381,312 people
- By 2030
- 362,731 · -4.9%
- By 2040
- 321,550 · -15.7%
- By 2050
- 279,212 · -26.8%
- By 2075
- 193,336 · -49.3%
- By 2100
- 128,118 · -66.4%
Race, ethnicity, and origin ACS 2023
- Neighborhood character
- Predominantly White (76%)
- Race & ethnicity
- White 76% Black 9% Hispanic / Latino 8% Two or more races 7%
- Hispanic origin (detail)
- Mexican 6%
- Common ancestry
- Lithuanian 6% Romanian 4% Slovak 3%
- Foreign-born
- 3% · Canada
- Languages at home
- 96% English-only · Spanish 3%
Political lean MEDSL · Genesee
- 2024 margin
- Toss-up / Even · D 51.4% · R 47.2% · Other 1.4%
- 2008→2024 swing
- -28.3pp toward R · 2008: 32.5pp · 2024: 4.2pp
- All cycles
- 2024: D+4.2 2020: D+9.3 2016: D+9.5 2012: D+28.2 2008: D+32.5
Not yet ingested
- Civics
- —
Market trends
- HPI YoY
- ▼ -173.31%
- Current HPI
- 90.0494
- Rent YoY
- —
- Metro
- Flint, MI
- State GDP YoY
- ▲ 1.37%
- F500 in state
- 28
Industry mix (Fortune 500 HQ in MI)
| Industry | F500 HQs | Revenue |
|---|---|---|
| Automotive Parts | 3 | $48B |
|
||
| Automotive | 2 | $372B |
|
||
| Chemicals | 1 | $45B |
|
||
| Automotive Retail | 1 | $29B |
|
||
| Healthcare / Medical Devices | 1 | $23B |
|
||
| Automotive Technology | 1 | $20B |
|
||
Price history
+10.9% since first listed20 events — show timeline
- 2026-06-02 Listed $49,900 REALCOMP
- 2026-06-02 Listed $49,900 MiRealSource-MiMLS
- 2023-04-17 Listing Removed — MiRealSource-MiMLS
- 2023-04-17 Listing Removed — REALCOMP
- 2023-01-23 Price Changed $29,500 MiRealSource-MiMLS
- 2023-01-23 Price Changed $29,500 REALCOMP
- 2023-01-12 Price Changed $31,500 MiRealSource-MiMLS
- 2023-01-12 Price Changed $31,500 REALCOMP
- 2022-12-13 Listed $35,000 MiRealSource-MiMLS
- 2022-12-13 Listed $35,000 REALCOMP
- 2021-02-12 Listing Removed — REALCOMP
- 2021-02-12 Listing Removed — MiRealSource-MiMLS
- 2021-02-01 Price Changed $28,500 MiRealSource-MiMLS
- 2021-02-01 Price Changed $28,500 REALCOMP
- 2021-01-15 Relisted — REALCOMP
- 2021-01-13 Listing Removed — REALCOMP
- 2020-11-21 Price Changed $38,500 MiRealSource-MiMLS
- 2020-11-21 Price Changed $38,500 REALCOMP
- 2020-11-07 Listed $45,000 MiRealSource-MiMLS
- 2020-11-07 Listed $45,000 REALCOMP
Property tax history
+7.8%/yrLatest (2025): $2,188 · +0.9% YoY. Source: county tax records.
Cash-flow waterfall
monthlySold comps — $/sqft
last 12 mo · ≤1 miLoading sold comps…