1701 Breezeway Hts · Harrah, OK
Flood risk 1/10 · Minimal
- FEMA flood zone
- X (unshaded)
- Chance of flooding over 30 yrs
- 0.0%
- Est. flood insurance / yr
- $507 – $1,088
Fire risk 6/10 · Moderate
- Est. fire insurance / yr
- $2,463 – $4,575
Heat risk 5/10 · Moderate
- Hot days now (above 108°F)
- 7 days/yr
- Hot days in 30 yrs
- 18 days/yr
Wind risk 3/10 · Minor
- Chance of severe wind over 30 yrs
- 6.0%
Air-quality risk 2/10 · Minimal
- Unhealthy air days now
- 1 days/yr
- Unhealthy air days in 30 yrs
- 1 days/yr
Risk factors via First Street. Map © Google.
Why this score? — see what drove the B- grade
The composite is a weighted blend of 9 inputs, each scored 0–100. Each bar is that input's sub-score; the figure is the points it added to the 100-point composite (weight × sub-score).
- Cash flow +30.0/30.0
- DSCR +10.0/10.0
- 1% rule +9.0/10.0
- ARV discount +7.5/15.0
- Livability +3.2/5.0
- Rent growth +2.5/5.0
- Condition / age +2.5/5.0
- Schools +2.4/10.0
- Appreciation +0.0/10.0
$118,000
🖨 Deal sheet 📄 Offer letter ✓ Due diligence
Listing remarks
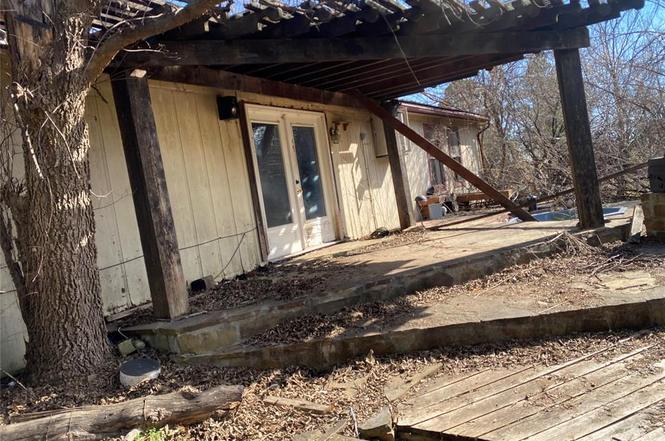
Unlock the potential of this 3-bedroom, 2-bath property situated on a spacious 2.25-acre lot. Whether you're looking to expand your rental portfolio, explore future development possibilities, or create a value-add project, this property offers versatility and room to grow. With acreage becoming increasingly desirable, this property combines space, utility, and investment upside. A rare opportunity for investors or buyers seeking land and flexibility.
Key facts
- 2.24 acre lot
- Built 1986
- Listed 111 days
Property features AI
Finance
- Other: Interior lot; Approximately 2.24 acres
- Financial info: Financing available: Cash, Conventional, FHA or VA; Assumable loan: No; Loan qualification possible
- HOA & community: No mandatory association dues
Exterior
- Home design: Single family residence; One level; Residential property; Existing property
- Construction: Manufactured / Mobile home; Metal siding; Composition roof; Combination foundation
- Exterior features: Storage
Interior
- Bedrooms: 3 bedrooms
- Bathrooms: 2 full bathrooms
- Interior features: One living area; No fireplace; No study
Neighborhood map
What this means for you Summary
Snapshot
- This is a 3-bed/2.0-bath manufactured listed at $118k.
Deal economics
- At list price, monthly cash flow is $596 ($7k/yr) — positive.
- The deal already cash-flows at list — no discount required.
- Meets the 1% rule at list price ($2k rent vs $118k).
- Recommended offer: $107k (9.0% below list) — sets the bar for market timing.
- Cap rate 12.4% vs local median 4.3% in Harrah — top-decile yield for the area; either an underpriced asset or a hidden risk that comps aren't pricing in. Stress-test before assuming the spread holds.
Location & tenants
- Location reads 64/100 on livability (#163 in OK) — a middle-class / working-renter tenant base. Strengths: cost of living A+, housing A+, crime A-; Watch: amenities F, commute F, health & safety D-.
- Harrah (town): math 24% / reading 29% proficiency, ranked #82 of 270 in OK (top 30%) — low school quality limits family demand, transient renter base, plan for 1-2y turnover.
- Zoned schools: Clara Reynolds Es (math 27% / reading 27%, grade F, #311 of 845 statewide, top 40%, 313 students, 0% FRL); Harrah Hs (math 27% / reading 27%, grade F, #125 of 447 statewide, top 31%, 630 students, 0% FRL) — zoned schools average 0% FRL vs 42% district-wide (42 pts lower); this property's tenant base skews higher-income than the district average.
- Market conditions: 192 active listings in the ZIP; 4 comparable units currently listed for rent nearby; rentals leasing fast (median 2d on market — plan ~1-2 weeks tenant-placement turnaround); 5,365 units permitted in Oklahoma County in 2024 (569 in 5+ unit buildings).
Forward outlook
- Local home prices are declining (-3.0%/yr); year-one equity from $816 of loan paydown is wiped out by about $4k of value loss. Plan a longer hold.
- Oklahoma County population projected at +41% by 2050 — long-run rental-demand tailwind backs the buy-and-hold thesis.
- At projected returns (-3.0% appreciation + 3.0% rent growth), your $33k cash investment doubles in ~6 years — after that, you're playing with house money.
Negotiation context
- It's been on market 111 days — a 9% lower offer ($107k) is reasonable based on typical stale-listing flexibility.
- Current owner paid $58k; list at $118k implies a 103% gain — meaningful room to come down on a strong offer.
Risks & watch-outs
- Climate carrying-cost: major wildfire risk; extreme-heat days projected 7→18/yr by 2055 (HVAC capex compounding) — expect insurance premiums to compound above CPI over the hold.
Questions for the listing agent
- It's been on market 111 days. Have you received any prior offers? Is the seller open to a 9% concession, seller financing, or rate buy-down credit?
- Why hasn't it sold? Are there any deal-killer items the seller is aware of (foundation, flood, title, zoning, code violations)?
- Is there a deadline driving the sale (1031 exchange, divorce, estate, relocation)? That informs how much negotiation room exists.
- Schools are D-rated, which usually means shorter tenancies and higher turnover. Who's the typical renter profile here, and what's been the actual vacancy rate?
- What's the average days-on-market for RENTAL listings here right now (not sales)? A rising rental-DOM trend means longer vacancies and softer asking-rent achievability than the comps imply.
- What's the recent tenant-quality profile in this submarket — average credit score on applications, eviction rate, late-payment / NSF rate, and stable-employment percentage? A property-management company in the area should have these aggregated.
- How much new for-sale + rental construction is in the pipeline within 1–3 miles? Heavy new supply typically softens prices + rents 12–24 months out; constrained supply supports both.
Investment metrics
- 1% rule
- 1.40% ✓
- Cap rate
- 12.35%
- Cash-on-cash
- 21.64%
- DSCR
- 1.96
- GRM
- 6.0
CMA / ARV
No comps found within radius.
Projected returns pro-forma
-3.0% appreciation · 3.0% rent growth · sell at horizon
- IRR
- 14.2%
- Equity multiple
- 1.57×
- Total profit
- $18,780
- Equity at exit
- $17,594
- IRR
- 23.0%
- Equity multiple
- 2.97×
- Total profit
- $65,040
- Equity at exit
- $10,202
Cash invested: $33,040 (down + closing). Projections, not guarantees.
Landlord ↔ Tenant lean methodology
- Overall (STATE)
- 83 Strongly Landlord-Friendly
- State Oklahoma
- 83 Strongly Landlord-Friendly · R+20
- County
- — inherits STATE
- City
- — inherits STATE
ZIP-level market 73045
- Home prices YoY
- -16.9%
- Active inventory
- 192
- Price-to-rent
- 6.0×
Monthly cashflow live
- Estimated rent
- $1,648 medium interval (Pro) →
- Mortgage (P&I)
- −$619
- Tax from tax record
- −$38 /mo · $455/yr
- Insurance
- −$49
- HOA
- −$0
- Vacancy / Maint / Mgmt
- −$346
- Net cashflow
- $596
Break-even live
UW: 25.0% down · 7.5% · 30yr · 1.5% tax · 5.0% vac · 8.0% maint · 8.0% mgmt
Financing live
Cash to close
- Down payment
- $29,500
- Closing costs
- $3,540
- Reserves months
- —
- Total cash needed
- —
Loan-product check · same deal, 3 products live
Conventional
25% down · 7.5% · 30yr
- Down + closing
- —
- Monthly P&I
- —
- Monthly cashflow
- —
- DSCR
- —
- Eligible?
- —
Personal DTI + credit; lowest rate.
DSCR
20% down · 8.5% · 30yr
- Down + closing
- —
- Monthly P&I
- —
- Monthly cashflow
- —
- DSCR
- —
- Eligible?
- —
No personal income docs; deal must DSCR.
Hard money
10% down · 12.0% · 12mo
- Down + closing
- —
- Monthly P&I
- —
- Monthly cashflow
- —
- DSCR
- —
- Eligible?
- —
Short-term bridge; refi at stabilization.
Rent comps 4 comps
| Address | Beds | Baths | Sqft | Rent | $/sqft | DOM | Units | Dist |
|---|---|---|---|---|---|---|---|---|
| 20849 Landmark Dr Harrah, OK | 3.0 | 2.0 | 1300 | $2,000 | $1.54 | 1d | 5 | 1.00mi |
| 20849 Landmark Cir Unit 15 Harrah, OK | 3.0 | 2.0 | 1300 | $1,400 | $1.08 | 1d | 1 | 1.04mi |
| 20618 Frontier Pl Harrah, OK | 3.0 | 2.0 | 1298 | $1,549 | $1.19 | 10d | 1 | 1.26mi |
| 20542 Frontier Pl Harrah, OK | 3.0 | 2.0 | 1350 | $1,600 | $1.19 | 1d | 1 | 1.35mi |
Listing history 17 events
-
2026-06-18days on market $118,000 Active 111 DOM
-
2026-06-17days on market $118,000 Active 110 DOM
-
2026-06-16days on market $118,000 Active 109 DOM
-
2026-06-15days on market $118,000 Active 108 DOM
-
2026-06-13days on market $118,000 Active 106 DOM
-
2026-06-13days on market $118,000 Active 105 DOM
-
2026-06-09days on market $118,000 Active 102 DOM
-
2026-06-08days on market $118,000 Active 101 DOM
-
2026-06-07days on market $118,000 Active 100 DOM
-
2026-06-03days on market $118,000 Active 96 DOM
-
2026-06-02days on market $118,000 Active 95 DOM
-
2026-06-01days on market $118,000 Active 94 DOM
-
2026-05-31days on market $118,000 Active 93 DOM
-
2026-05-07price $118,000
-
2026-04-16price $120,000
-
2026-02-27$125,000 Active
-
1992-06-08soldstatus $58,000
ⓘ Source: listings_history table (triggers on properties + properties_extension) + one-shot
backfill from property_details.listing_events for pre-trigger history.
Tax reassessment forecast OK · Resets to sale price
- Current annual tax
- $455 · $38/mo
- Projected year-2 tax
- $1,062 · $88/mo
- Expected delta
- +$607/yr (+$51/mo · 133.2%)
ⓘ Screening estimate from a state-policy table — verify with the county assessor before closing.
Climate risk First Street
- Flood 1/10 Low FEMA zone X (unshaded) · 0% chance over 30 yrs
- Wildfire 6/10 Major
- Heat 5/10 Major 7 d/yr ≥108°F today · 18 d/yr by 30 yrs out
- Wind 3/10 Moderate 6% chance of damaging wind over 30 yrs
- Air quality 2/10 Low 1 unhealthy d/yr today · 1 by 30 yrs out
Nearby sold comps map
Loading sold comps map…
Walkable amenities ~0.75 mi
Loading nearby amenities…
Taxation est. · year 1
- Rental income
- $19,772
- − Mortgage interest
- −$6,610
- − Property taxes
- −$455
- − Insurance
- −$590
- − Repairs & maintenance
- −$1,582
- − Management
- −$1,582
- − Depreciation
- −$3,433
- Taxable income
- $5,521
- Est. tax owed @ 24.0%
- −$1,325
- After-tax cash flow
- $5,824/yr
For passive investors: Depreciation is non-cash, so a rental often shows a tax loss while cash-flowing — sheltering income. Rental losses are passive: they offset passive income freely, and up to $25,000/yr can offset ordinary (W-2) income if you actively participate and your MAGI is under $100k (phasing out to $0 by $150k); unused losses carry forward. On sale, claimed depreciation is recaptured at up to 25%, and gains may owe capital-gains tax (a 1031 exchange can defer both). Figures are a year-1 estimate at your 24.0% rate — not tax advice; consult a CPA.
Schools (NCES district)
- District
- Harrah
- NCES district ID
- 4013890
- Math proficiency
- 24% ▼ -9.00%
- Reading proficiency
- 29% ▼ -9.00%
- Median HH income
- $52,737
- Composite
- 23.55/100
- National rank
- #7860
- State rank
- #82 of 270 in OK
Livability — Harrah
- Score
- 64/100
- State rank
- #163
- US rank
- #13659
Category grades
Schools grade is shown separately in the Schools card above.
Census & demographics
- City population
- 11,542
- Population (ZIP)
- 11,542
Population outlook (Oklahoma County) Hauer SSP2
- Today (2025)
- 911,875 people
- By 2030
- 982,413 · +7.7%
- By 2040
- 1,130,468 · +24.0%
- By 2050
- 1,288,422 · +41.3%
- By 2075
- 1,711,482 · +87.7%
- By 2100
- 2,088,448 · +129.0%
Race, ethnicity, and origin ACS 2023
- Neighborhood character
- Predominantly White (79%)
- Race & ethnicity
- White 79% Two or more races 9% Hispanic / Latino 7% Native American 6% Asian 1%
- Hispanic origin (detail)
- Mexican 6%
- Common ancestry
- Romanian 3% Lithuanian 1% Slovak 1%
- Foreign-born
- 1% · Canada
- Languages at home
- 97% English-only · Spanish 2%
Political lean MEDSL · Oklahoma
- 2024 margin
- Toss-up / Even · D 48.0% · R 49.7% · Other 2.3%
- 2008→2024 swing
- +15.1pp toward D · 2008: -16.8pp · 2024: -1.7pp
- All cycles
- 2024: R+1.7 2020: R+1.1 2016: R+10.5 2012: R+16.7 2008: R+16.8
Not yet ingested
- Civics
- —
Market trends
- HPI YoY
- ▼ -55.25%
- Current HPI
- 272.5731
- Rent YoY
- —
- Metro
- —
- State GDP YoY
- ▲ 1.55%
- F500 in state
- 6
Industry mix (Fortune 500 HQ in OK)
| Industry | F500 HQs | Revenue |
|---|---|---|
| Energy | 3 | $48B |
|
||
Price history
+103.4% since first listed4 events — show timeline
- 2026-05-07 Price Changed $118,000 MLSOK
- 2026-04-16 Price Changed $120,000 MLSOK
- 2026-02-27 Listed $125,000 MLSOK
- 1992-06-08 Sold (Public Records) $58,000 Public Records
Property tax history
+1.3%/yrLatest (2025): $455 · +2.1% YoY. Source: county tax records.
Cash-flow waterfall
monthlySold comps — $/sqft
last 12 mo · ≤1 miLoading sold comps…