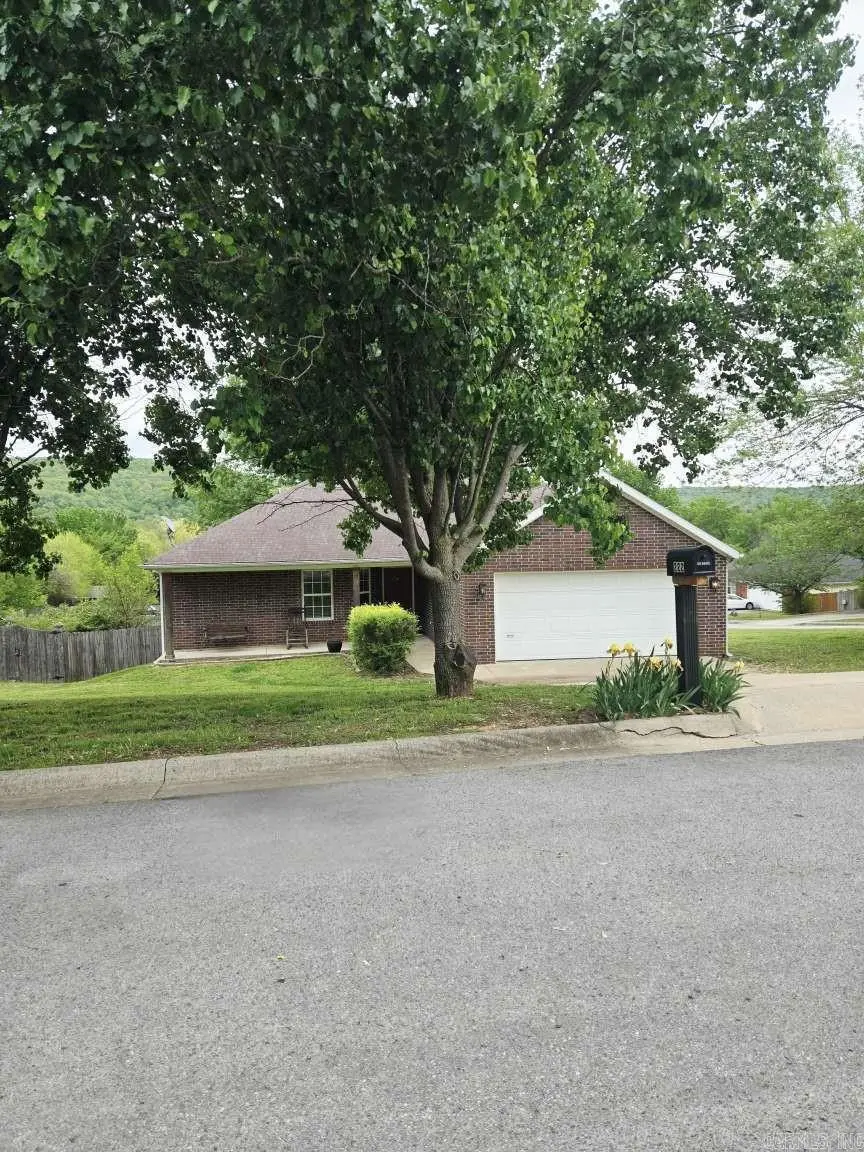
222 Rivendale Dr · West Fork, AR
Flood risk 1/10 · Minimal
- FEMA flood zone
- X (unshaded)
- Chance of flooding over 30 yrs
- 0.0%
- Est. flood insurance / yr
- $507 – $1,088
Fire risk 5/10 · Moderate
- Est. fire insurance / yr
- $1,499 – $2,785
Heat risk 5/10 · Moderate
- Hot days now (above 104°F)
- 8 days/yr
- Hot days in 30 yrs
- 23 days/yr
Wind risk 2/10 · Minimal
- Chance of severe wind over 30 yrs
- 3.0%
Air-quality risk 2/10 · Minimal
- Unhealthy air days now
- 0 days/yr
- Unhealthy air days in 30 yrs
- 1 days/yr
Risk factors via First Street. Map © Google.
Why this score? — see what drove the B- grade
The composite is a weighted blend of 9 inputs, each scored 0–100. Each bar is that input's sub-score; the figure is the points it added to the 100-point composite (weight × sub-score).
- Cash flow +30.0/30.0
- DSCR +10.0/10.0
- ARV discount +8.1/15.0
- 1% rule +7.8/10.0
- Livability +3.3/5.0
- Rent growth +2.5/5.0
- Condition / age +2.5/5.0
- Schools +2.1/10.0
- Appreciation +0.0/10.0
$259,000
🖨 Deal sheet (PDF) 📄 Offer letter ✓ Due diligence
Listing remarks MLS
You have to see this one! This 3 BR brick home in the center of West Fork! This beautiful home is nestled in the Rivendale Valley Subdivision and it offers so much: landscaping, corner lot with large mature trees and a fenced back yard. It has a deck off the back to enjoy grilling, the scenery, or just the peaceful surroundings. The home is on a quiet cul-de-sac street within walking distance to the West Fork schools. It is 0.7mi from the local grocery store and 0.8 mi from the Interstate, 14 miles to Fayetteville, and 36 miles to Bentonville, all conveniently accessible via interstate. All of this beauty sits on approximately . 195 of an acre, or 8,512 sq. ft.
Key facts
- Large mature trees
- Fenced back yard
- Landscaping
Tags
Neighborhood map
What this means for you Summary
Snapshot
- This is a 3-bed/2.0-bath single-family listed at $259k.
Deal economics
- At list price, monthly cash flow is $1k ($13k/yr) — positive.
- The deal already cash-flows at list — no discount required.
- Meets the 1% rule at list price ($3k rent vs $259k).
- Recommended offer: $228k (12.0% below list) — sets the bar for market timing.
- Cap rate 11.2% vs local median 5.2% in West Fork — top-decile yield for the area; either an underpriced asset or a hidden risk that comps aren't pricing in. Stress-test before assuming the spread holds.
Location & tenants
- Location reads 66/100 on livability (#126 in AR) — a middle-class / working-renter tenant base. Strengths: crime A+, cost of living A+, housing A+; Watch: amenities F, commute F, health & safety F.
- West Fork School District (rural): math 23% / reading 26% proficiency, ranked #182 of 238 in AR (top 76%) — low school quality limits family demand, transient renter base, plan for 1-2y turnover.
- Zoned schools: West Fork Elementary School (math 37% / reading 22%, grade F, #305 of 454 statewide, top 71%, 340 students, 54% FRL); West Fork Middle School (math 24% / reading 24%, grade F, #170 of 201 statewide, top 86%, 241 students, 47% FRL); West Fork High School (math 12% / reading 32%, grade F, #213 of 292 statewide, top 77%, 291 students, 42% FRL) — zoned schools at 47% FRL track the district average.
- Market conditions: 75 active listings in the ZIP; 3,494 units permitted in Washington County in 2024 (1,497 in 5+ unit buildings).
Forward outlook
- Local home prices are declining (-3.0%/yr); year-one equity from $2k of loan paydown is wiped out by about $8k of value loss. Plan a longer hold.
- Washington County population projected at +47% by 2050 — long-run rental-demand tailwind backs the buy-and-hold thesis.
- At projected returns (-3.0% appreciation + 3.0% rent growth), your $73k cash investment doubles in ~7 years — after that, you're playing with house money.
Negotiation context
- It's been on market 383 days — a 12% lower offer ($228k) is reasonable based on typical stale-listing flexibility.
- 2 sale attempts; this cycle's ask has dropped $66k (20%) from the opening price — seller is motivated, your offer sets the floor, not the list.
- Current owner paid $93k; list at $259k implies a 178% gain — meaningful room to come down on a strong offer.
Risks & watch-outs
- Climate carrying-cost: moderate wildfire risk; extreme-heat days projected 8→23/yr by 2055 (HVAC capex compounding) — expect insurance premiums to compound above CPI over the hold.
Questions for the listing agent
- It's been on market 383 days. Have you received any prior offers? Is the seller open to a 12% concession, seller financing, or rate buy-down credit?
- Why hasn't it sold? Are there any deal-killer items the seller is aware of (foundation, flood, title, zoning, code violations)?
- Is there a deadline driving the sale (1031 exchange, divorce, estate, relocation)? That informs how much negotiation room exists.
- Schools are D-rated, which usually means shorter tenancies and higher turnover. Who's the typical renter profile here, and what's been the actual vacancy rate?
- What's the average days-on-market for RENTAL listings here right now (not sales)? A rising rental-DOM trend means longer vacancies and softer asking-rent achievability than the comps imply.
- What's the recent tenant-quality profile in this submarket — average credit score on applications, eviction rate, late-payment / NSF rate, and stable-employment percentage? A property-management company in the area should have these aggregated.
- How much new for-sale + rental construction is in the pipeline within 1–3 miles? Heavy new supply typically softens prices + rents 12–24 months out; constrained supply supports both.
Investment metrics
- 1% rule
- 1.28% ✓
- Cap rate
- 11.22%
- Cash-on-cash
- 17.61%
- DSCR
- 1.78
- GRM
- 6.5
CMA / ARV
- ARV (median comp)
- $262,205
- List price
- $259,000
- Delta
- -1.22%
- Verdict
- FAIR
- Comps
- 20 within 1.0 mi
Show comp detail 12 sales within ~0.75 mi
| Address | Dist | Beds/Ba | Sqft | Sold | Price | $/sf | Match |
|---|---|---|---|---|---|---|---|
| 340 W Smith St | 0.22mi | 3/2.0 | 1,430 (-1%) | 6mo | $279,900 | $196 | 84 |
| 353 Smith St | 0.32mi | 3/2.0 | 1,463 (+2%) | 2mo | $294,950 | $202 | 81 |
| 450 Hall St | 0.27mi | 3/2.0 | 1,445 (+0%) | 9mo | $288,900 | $200 | 79 |
| 497 Clark Ave | 0.20mi | 3/2.0 | 1,358 (-6%) | 5mo | $287,845 | $212 | 77 |
| 377 Smith St | 0.32mi | 3/2.0 | 1,496 (+4%) | 6mo | $299,450 | $200 | 73 |
| 260 Culp Trl | 0.25mi | 3/3.0 | 1,326 (-8%) | 2mo | $232,500 | $175 | 70 |
| 359 Smith St | 0.32mi | 3/2.0 | 1,536 (+7%) | 4mo | $292,950 | $191 | 70 |
| 365 Smith St | 0.32mi | 3/2.0 | 1,556 (+8%) | 3mo | $306,000 | $197 | 69 |
| 339 Smith St | 0.32mi | 4/2.0 (+1) | 1,567 (+9%) | 4mo | $323,446 | $206 | 61 |
| 255 Wheeler St | 0.38mi | 3/2.0 | 1,232 (-14%) | 0mo | $267,000 | $217 | 58 |
| 696 E Thornstone Ave | 0.40mi | 3/2.0 | 1,650 (+15%) | 3mo | $267,500 | $162 | 54 |
| 402 Phillips St | 0.62mi | 3/1.0 | 1,332 (-7%) | 9mo | $180,000 | $135 | 48 |
Match score weights: distance 35% · size 25% · config 20% · recency 20%. Top-matched comps best support the ARV.
Projected returns pro-forma
-3.0% appreciation · 3.0% rent growth · sell at horizon
- IRR
- 9.0%
- Equity multiple
- 1.35×
- Total profit
- $25,717
- Equity at exit
- $38,618
- IRR
- 18.2%
- Equity multiple
- 2.51×
- Total profit
- $109,282
- Equity at exit
- $22,394
Cash invested: $72,520 (down + closing). Projections, not guarantees.
Landlord ↔ Tenant lean methodology
- Overall (STATE)
- 92 Strongly Landlord-Friendly
- State Arkansas
- 92 Strongly Landlord-Friendly · R+14
- County
- — inherits STATE
- City
- — inherits STATE
ZIP-level market 72774
- Home prices YoY
- -16.0%
- Active inventory
- 75
- Price-to-rent
- 6.5×
Monthly cashflow live
- Estimated rent
- $3,311 medium interval (Pro) →
- Mortgage (P&I)
- −$1,358
- Tax from tax record
- −$85 /mo · $1,019/yr
- Insurance
- −$108
- HOA
- −$0
- Vacancy / Maint / Mgmt
- −$695
- Net cashflow
- $1,064
Break-even live
Sensitivity live
| Price | -10% $1,211 | -5% $1,138 | +0% $1,064 | +5% $991 | +10% $918 |
|---|---|---|---|---|---|
| Rent | -10% $803 | -5% $933 | +0% $1,064 | +5% $1,195 | +10% $1,326 |
| Rate | -1.0pp $1,195 | -0.5pp $1,130 | base $1,064 | +0.5pp $997 | +1.0pp $929 |
UW: 25.0% down · 7.5% · 30yr · 1.5% tax · 5.0% vac · 8.0% maint · 8.0% mgmt
Financing live
Cash to close
- Down payment
- $64,750
- Closing costs
- $7,770
- Reserves months
- —
- Total cash needed
- —
Loan-product check · same deal, 3 products live
Conventional
25% down · 7.5% · 30yr
- Down + closing
- —
- Monthly P&I
- —
- Monthly cashflow
- —
- DSCR
- —
- Eligible?
- —
Personal DTI + credit; lowest rate.
DSCR
20% down · 8.5% · 30yr
- Down + closing
- —
- Monthly P&I
- —
- Monthly cashflow
- —
- DSCR
- —
- Eligible?
- —
No personal income docs; deal must DSCR.
Hard money
10% down · 12.0% · 12mo
- Down + closing
- —
- Monthly P&I
- —
- Monthly cashflow
- —
- DSCR
- —
- Eligible?
- —
Short-term bridge; refi at stabilization.
Listing history 9 events
-
2026-03-09price $235,000
-
2025-06-23price $259,000 669-char remark
Show marketing remark (669 chars)
You have to see this one! This 3 BR brick home in the center of West Fork! This beautiful home is nestled in the Rivendale Valley Subdivision and it offers so much: landscaping, corner lot with large mature trees and a fenced back yard. It has a deck off the back to enjoy grilling, the scenery, or just the peaceful surroundings. The home is on a quiet cul-de-sac street within walking distance to the West Fork schools. It is 0.7mi from the local grocery store and 0.8 mi from the Interstate, 14 miles to Fayetteville, and 36 miles to Bentonville, all conveniently accessible via interstate. All of this beauty sits on approximately . 195 of an acre, or 8,512 sq. ft.
-
2025-06-23price $259,000
Show marketing remark (669 chars)
You have to see this one! This 3 BR brick home in the center of West Fork! This beautiful home is nestled in the Rivendale Valley Subdivision and it offers so much: landscaping, corner lot with large mature trees and a fenced back yard. It has a deck off the back to enjoy grilling, the scenery, or just the peaceful surroundings. The home is on a quiet cul-de-sac street within walking distance to the West Fork schools. It is 0.7mi from the local grocery store and 0.8 mi from the Interstate, 14 miles to Fayetteville, and 36 miles to Bentonville, all conveniently accessible via interstate. All of this beauty sits on approximately . 195 of an acre, or 8,512 sq. ft.
-
2025-05-29price $305,000
-
2025-05-26$325,000 Active
-
2025-05-09$325,000 New Listing 669-char remark
Show marketing remark (669 chars)
You have to see this one! This 3 BR brick home in the center of West Fork! This beautiful home is nestled in the Rivendale Valley Subdivision and it offers so much: landscaping, corner lot with large mature trees and a fenced back yard. It has a deck off the back to enjoy grilling, the scenery, or just the peaceful surroundings. The home is on a quiet cul-de-sac street within walking distance to the West Fork schools. It is 0.7mi from the local grocery store and 0.8 mi from the Interstate, 14 miles to Fayetteville, and 36 miles to Bentonville, all conveniently accessible via interstate. All of this beauty sits on approximately . 195 of an acre, or 8,512 sq. ft.
-
2003-11-05soldstatus $93,000
-
2003-04-10soldstatus $12,000
ⓘ Source: listings_history table (triggers on properties + properties_extension) + one-shot
backfill from property_details.listing_events for pre-trigger history.
Tax reassessment forecast AR · Resets to sale price
- Current annual tax
- $1,019 · $85/mo
- Projected year-2 tax
- $1,658 · $138/mo
- Expected delta
- +$639/yr (+$53/mo · 62.7%)
ⓘ Screening estimate from a state-policy table — verify with the county assessor before closing.
Climate risk First Street
- Flood 1/10 Low FEMA zone X (unshaded) · 0% chance over 30 yrs
- Wildfire 5/10 Major
- Heat 5/10 Major 8 d/yr ≥104°F today · 23 d/yr by 30 yrs out
- Wind 2/10 Low 3% chance of damaging wind over 30 yrs
- Air quality 2/10 Low 0 unhealthy d/yr today · 1 by 30 yrs out
Nearby sold comps map
Loading sold comps map…
Walkable amenities ~0.75 mi
Loading nearby amenities…
Taxation est. · year 1
- Rental income
- $39,726
- − Mortgage interest
- −$14,508
- − Property taxes
- −$1,019
- − Insurance
- −$1,295
- − Repairs & maintenance
- −$3,178
- − Management
- −$3,178
- − Depreciation
- −$7,535
- Taxable income
- $9,014
- Est. tax owed @ 24.0%
- −$2,163
- After-tax cash flow
- $10,608/yr
For passive investors: Depreciation is non-cash, so a rental often shows a tax loss while cash-flowing — sheltering income. Rental losses are passive: they offset passive income freely, and up to $25,000/yr can offset ordinary (W-2) income if you actively participate and your MAGI is under $100k (phasing out to $0 by $150k); unused losses carry forward. On sale, claimed depreciation is recaptured at up to 25%, and gains may owe capital-gains tax (a 1031 exchange can defer both). Figures are a year-1 estimate at your 24.0% rate — not tax advice; consult a CPA.
Schools (NCES district)
- District
- West Fork School District
- NCES district ID
- 0514010
- Math proficiency
- 23% ▼ -20.00%
- Reading proficiency
- 26% ▼ -16.00%
- Median HH income
- $46,044
- Composite
- 21.26/100
- National rank
- #8396
- State rank
- #182 of 238 in AR
Livability — West Fork
- Score
- 66/100
- State rank
- #126
- US rank
- #11748
Category grades
Schools grade is shown separately in the Schools card above.
Census & demographics
- Census place
- West Fork, AR
- Population (ZIP)
- 7,298
Population outlook (Washington County) Hauer SSP2
- Today (2025)
- 271,748 people
- By 2030
- 296,414 · +9.1%
- By 2040
- 346,874 · +27.6%
- By 2050
- 398,552 · +46.7%
- By 2075
- 523,309 · +92.6%
- By 2100
- 615,280 · +126.4%
Race, ethnicity, and origin ACS 2023
- Neighborhood character
- Predominantly White (73%)
- Race & ethnicity
- White 73% Two or more races 19% Hispanic / Latino 6% Asian 2% Native American 2%
- Hispanic origin (detail)
- Mexican 4%
- Common ancestry
- Slovak 6% Italian 5% Iranian 3%
- Foreign-born
- 4% · China, Canada, South Korea
- Languages at home
- 97% English-only · Spanish 1% Chinese 1%
Political lean MEDSL · Washington
- 2024 margin
- Lean R (+6.7) · D 45.1% · R 51.7% · Other 3.2%
- 2008→2024 swing
- +6.4pp toward D · 2008: -13.1pp · 2024: -6.7pp
- All cycles
- 2024: R+6.7 2020: R+3.9 2016: R+10.4 2012: R+16.3 2008: R+13.1
Not yet ingested
- Civics
- —
Market trends
- HPI YoY
- ▼ -50.93%
- Current HPI
- 267.4622
- Rent YoY
- —
- Metro
- —
- State GDP YoY
- ▲ 3.80%
- F500 in state
- 10
Industry mix (Fortune 500 HQ in AR)
| Industry | F500 HQs | Revenue |
|---|---|---|
| Retail | 1 | $681B |
|
||
| Food / Agriculture | 1 | $53B |
|
||
| Retail / Energy | 1 | $22B |
|
||
| Transportation / Logistics | 1 | $12B |
|
||
| Energy | 1 | $4B |
|
||
Price history
+1858.3% since first listed9 events — show timeline
- 2026-03-09 Price Changed $235,000 FSBO.com
- 2025-06-23 Price Changed $259,000 CARMLS
- 2025-06-23 Price Changed $259,000 NWARMLS
- 2025-06-23 Price Changed $259,000 FSBO.com
- 2025-05-29 Price Changed $305,000 NWARMLS
- 2025-05-26 Listed $325,000 NWARMLS
- 2025-05-09 Listed $325,000 CARMLS
- 2003-11-05 Sold (Public Records) $93,000 Public Records
- 2003-04-10 Sold (Public Records) $12,000 Public Records
Property tax history
+2.3%/yrLatest (2025): $1,019 · -2.8% YoY. Source: county tax records.
Cash-flow waterfall
monthlySold comps — $/sqft
last 12 mo · ≤1 miLoading sold comps…