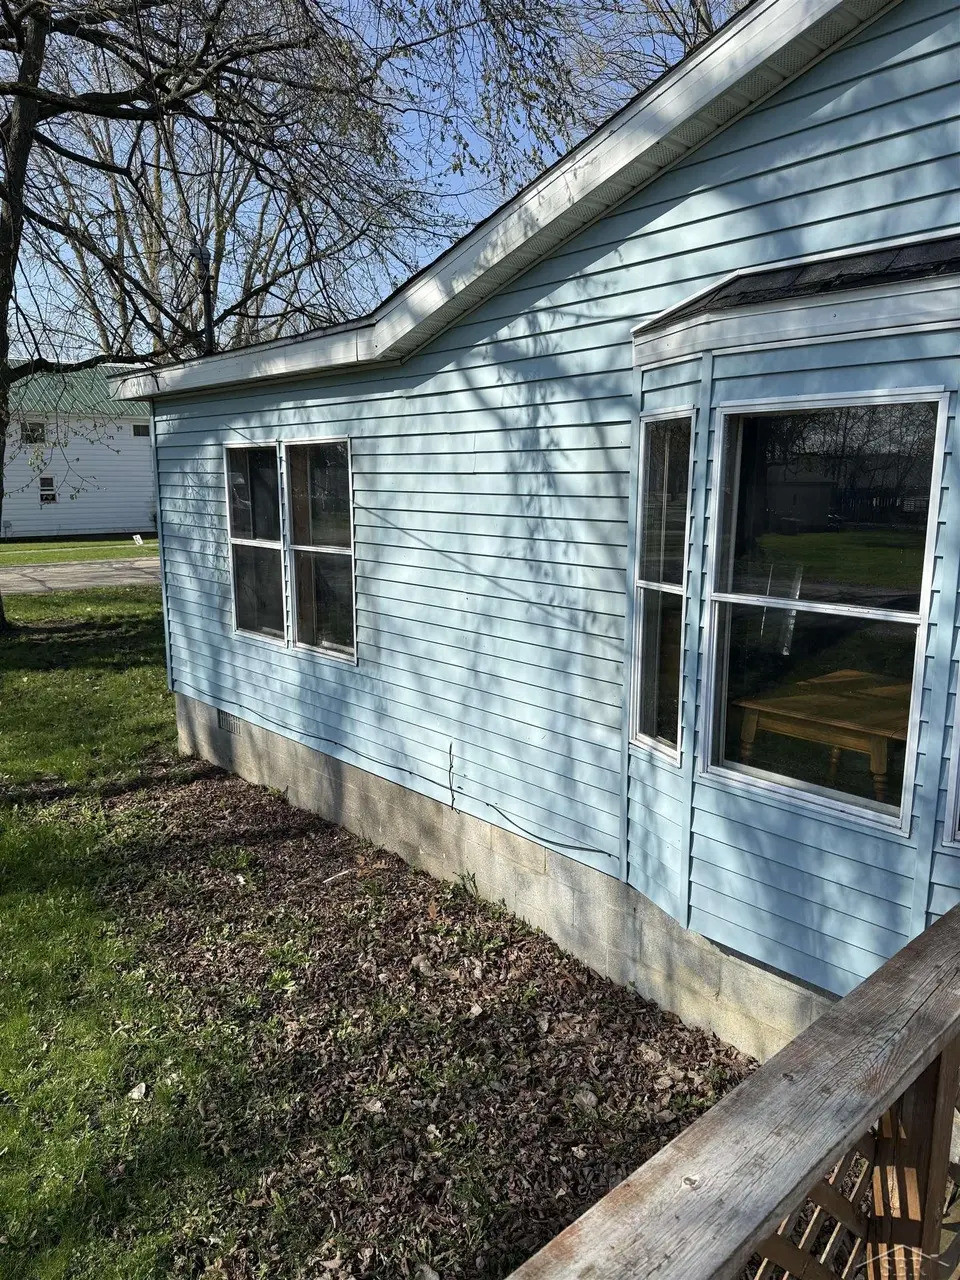
205 N Catherine St · Ithaca, MI
Flood risk 1/10 · Minimal
- FEMA flood zone
- X (unshaded)
- Chance of flooding over 30 yrs
- 0.0%
- Est. flood insurance / yr
- $473 – $860
Fire risk 1/10 · Minimal
- Est. fire insurance / yr
- $784 – $1,456
Heat risk 2/10 · Minimal
- Hot days now (above 98°F)
- 7 days/yr
- Hot days in 30 yrs
- 14 days/yr
Wind risk 1/10 · Minimal
- Chance of severe wind over 30 yrs
- —
Air-quality risk 2/10 · Minimal
- Unhealthy air days now
- 1 days/yr
- Unhealthy air days in 30 yrs
- 2 days/yr
Risk factors via First Street. Map © Google.
Why this score? — see what drove the B- grade
The composite is a weighted blend of 9 inputs, each scored 0–100. Each bar is that input's sub-score; the figure is the points it added to the 100-point composite (weight × sub-score).
- Cash flow +30.0/30.0
- 1% rule +10.0/10.0
- DSCR +10.0/10.0
- ARV discount +7.5/15.0
- Livability +3.6/5.0
- Schools +3.4/10.0
- Rent growth +2.5/5.0
- Condition / age +2.5/5.0
- Appreciation +0.0/10.0
$64,900
🖨 Deal sheet 📄 Offer letter ✓ Due diligence
Listing remarks MLS
Needs a remodel. Sub floor was replaced but now looking for an investor to come in and take it to completion. No land contract.
Key facts
- 0.25 acre lot
- Built 1990
- Listed 24 days
Property features AI
Finance
- Other: Residential property type; Above-grade finished area reported (approximate)
- HOA & community: Homeowners association present
Exterior
- Utilities: Public water; Public sewer
- Home design: Single-family residence; One story
- Construction: Vinyl siding
- Exterior features: Lot approximately 0.25 acres; Lot dimensions indicated
Interior
- Bathrooms: 2 full bathrooms
- Heating & cooling: Central air conditioning; Forced air heating (natural gas)
- Interior features: Crawl space basement; Total of 5 rooms
Neighborhood map
What this means for you Summary
Snapshot
- This is a 3-bed/2.0-bath single-family listed at $65k.
Deal economics
- At list price, monthly cash flow is $415 ($5k/yr) — positive.
- The deal already cash-flows at list — no discount required.
- Meets the 1% rule at list price ($1k rent vs $65k).
- Recommended offer: $64k (1.5% below list) — sets the bar for market timing.
Location & tenants
- Location reads 71/100 on livability (#265 in MI) — a middle-class / working-renter tenant base. Strengths: cost of living A+, housing A+, crime A; Watch: schools D+, amenities F, commute F.
- Ithaca Public Schools (rural): math 31% / reading 48% proficiency, ranked #221 of 540 in MI (top 41%) — families likely to look elsewhere, expect single-tenant / working-renter base with shorter leases.
- Market conditions: 20 active listings in the ZIP; 47 units permitted in Gratiot County in 2024 (0 in 5+ unit buildings).
Forward outlook
- Local home prices are declining (-3.0%/yr); year-one equity from $449 of loan paydown is wiped out by about $2k of value loss. Plan a longer hold.
- Gratiot County population projected at -14% by 2050 — secular population decline; favor cash flow + early exit over multi-decade hold.
- At projected returns (-3.0% appreciation + 3.0% rent growth), your $18k cash investment doubles in ~5 years — after that, you're playing with house money.
Negotiation context
- It's been on market 24 days — a 2% lower offer ($64k) is reasonable based on typical stale-listing flexibility.
- 2 sale attempts; this cycle's ask has dropped $15k (19%) from the opening price — seller is motivated, your offer sets the floor, not the list.
Questions for the listing agent
- Is there a deadline driving the sale (1031 exchange, divorce, estate, relocation)? That informs how much negotiation room exists.
- Schools are D-rated, which usually means shorter tenancies and higher turnover. Who's the typical renter profile here, and what's been the actual vacancy rate?
- What's the average days-on-market for RENTAL listings here right now (not sales)? A rising rental-DOM trend means longer vacancies and softer asking-rent achievability than the comps imply.
- What's the recent tenant-quality profile in this submarket — average credit score on applications, eviction rate, late-payment / NSF rate, and stable-employment percentage? A property-management company in the area should have these aggregated.
- How much new for-sale + rental construction is in the pipeline within 1–3 miles? Heavy new supply typically softens prices + rents 12–24 months out; constrained supply supports both.
Investment metrics
- 1% rule
- 1.58% ✓
- Cap rate
- 13.97%
- Cash-on-cash
- 27.43%
- DSCR
- 2.22
- GRM
- 5.3
CMA / ARV
- ARV (median comp)
- $170,530
- List price
- $64,900
- Delta
- -61.94%
- Verdict
- UNDERPRICED
- Comps
- 20 within 1.0 mi
Show comp detail 12 sales within ~0.75 mi
| Address | Dist | Beds/Ba | Sqft | Sold | Price | $/sf | Match |
|---|---|---|---|---|---|---|---|
| 205 N Catherine St | 0.00mi | 3/2.0 | 1,400 (0%) | 1mo | $60,000 | $43 | 99 |
| 232 S Gwinner St Lot : 7 | 0.38mi | 3/1.5 | 1,419 (+1%) | 0mo | $175,000 | $123 | 78 |
| 232 S Gwinner St | 0.38mi | 3/1.5 | 1,419 (+1%) | 0mo | $175,000 | $123 | 78 |
| 515 E Arcada St | 0.35mi | 3/2.0 | 1,344 (-4%) | 11mo | $230,000 | $171 | 68 |
| 314 E Newark St | 0.50mi | 3/1.0 | 1,378 (-2%) | 9mo | $160,000 | $116 | 63 |
| 610 E South St | 0.38mi | 3/1.0 | 1,506 (+8%) | 7mo | $179,000 | $119 | 60 |
| 105 S Gwinner St | 0.27mi | 3/2.0 | 1,575 (+12%) | 11mo | $180,000 | $114 | 57 |
| 315 S Main St | 0.67mi | 3/1.5 | 1,433 (+2%) | 8mo | $175,000 | $122 | 56 |
| 126 S Gwinner St | 0.31mi | 4/1.0 (+1) | 1,500 (+7%) | 10mo | $150,000 | $100 | 56 |
| 23 Meadow Ln | 0.50mi | 2/2.0 (-1) | 1,288 (-8%) | 6mo | $70,000 | $54 | 53 |
| 415 E South St | 0.48mi | 3/2.0 | 1,201 (-14%) | 4mo | $135,000 | $112 | 50 |
| 205 E Barber St | 0.71mi | 3/1.0 | 1,524 (+9%) | 4mo | $47,500 | $31 | 45 |
Match score weights: distance 35% · size 25% · config 20% · recency 20%. Top-matched comps best support the ARV.
Projected returns pro-forma
-3.0% appreciation · 3.0% rent growth · sell at horizon
- IRR
- 21.4%
- Equity multiple
- 1.88×
- Total profit
- $15,923
- Equity at exit
- $9,677
- IRR
- 29.5%
- Equity multiple
- 3.63×
- Total profit
- $47,858
- Equity at exit
- $5,611
Cash invested: $18,172 (down + closing). Projections, not guarantees.
Landlord ↔ Tenant lean methodology
- Overall (STATE)
- 62 Landlord-Friendly
- State Michigan
- 62 Landlord-Friendly · EVEN
- County
- — inherits STATE
- City
- — inherits STATE
ZIP-level market 48847
- Home prices YoY
- -33.8%
- Active inventory
- 20
- Price-to-rent
- 5.3×
Monthly cashflow live
- Estimated rent
- $1,022 medium interval (Pro) →
- Mortgage (P&I)
- −$340
- Tax from tax record
- −$25 /mo · $299/yr
- Insurance
- −$27
- HOA
- −$0
- Vacancy / Maint / Mgmt
- −$215
- Net cashflow
- $415
Break-even live
UW: 25.0% down · 7.5% · 30yr · 1.5% tax · 5.0% vac · 8.0% maint · 8.0% mgmt
Financing live
Cash to close
- Down payment
- $16,225
- Closing costs
- $1,947
- Reserves months
- —
- Total cash needed
- —
Loan-product check · same deal, 3 products live
Conventional
25% down · 7.5% · 30yr
- Down + closing
- —
- Monthly P&I
- —
- Monthly cashflow
- —
- DSCR
- —
- Eligible?
- —
Personal DTI + credit; lowest rate.
DSCR
20% down · 8.5% · 30yr
- Down + closing
- —
- Monthly P&I
- —
- Monthly cashflow
- —
- DSCR
- —
- Eligible?
- —
No personal income docs; deal must DSCR.
Hard money
10% down · 12.0% · 12mo
- Down + closing
- —
- Monthly P&I
- —
- Monthly cashflow
- —
- DSCR
- —
- Eligible?
- —
Short-term bridge; refi at stabilization.
Listing history 7 events
-
2026-05-18status Pending 127-char remark
Show marketing remark (127 chars)
Needs a remodel. Sub floor was replaced but now looking for an investor to come in and take it to completion. No land contract.
-
2026-05-18status Pending 127-char remark
Show marketing remark (127 chars)
Needs a remodel. Sub floor was replaced but now looking for an investor to come in and take it to completion. No land contract.
-
2026-05-05price $64,900 127-char remark
Show marketing remark (127 chars)
Needs a remodel. Sub floor was replaced but now looking for an investor to come in and take it to completion. No land contract.
-
2026-05-05price $64,900 127-char remark
Show marketing remark (127 chars)
Needs a remodel. Sub floor was replaced but now looking for an investor to come in and take it to completion. No land contract.
-
2026-04-24$79,900 Active 127-char remark
Show marketing remark (127 chars)
Needs a remodel. Sub floor was replaced but now looking for an investor to come in and take it to completion. No land contract.
-
2026-04-24$79,900 Active 127-char remark
Show marketing remark (127 chars)
Needs a remodel. Sub floor was replaced but now looking for an investor to come in and take it to completion. No land contract.
-
2016-07-22soldstatus $60,000
ⓘ Source: listings_history table (triggers on properties + properties_extension) + one-shot
backfill from property_details.listing_events for pre-trigger history.
Tax reassessment forecast MI · Partial reset (capped growth)
- Current annual tax
- $299 · $25/mo
- Projected year-2 tax
- $649 · $54/mo
- Expected delta
- +$350/yr (+$29/mo · 117.0%)
ⓘ Screening estimate from a state-policy table — verify with the county assessor before closing.
Climate risk First Street
- Flood 1/10 Low FEMA zone X (unshaded) · 0% chance over 30 yrs
- Wildfire 1/10 Low
- Heat 2/10 Low 7 d/yr ≥98°F today · 14 d/yr by 30 yrs out
- Wind 1/10 Low
- Air quality 2/10 Low 1 unhealthy d/yr today · 2 by 30 yrs out
Nearby sold comps map
Loading sold comps map…
Walkable amenities ~0.75 mi
Loading nearby amenities…
Taxation est. · year 1
- Rental income
- $12,270
- − Mortgage interest
- −$3,635
- − Property taxes
- −$299
- − Insurance
- −$324
- − Repairs & maintenance
- −$982
- − Management
- −$982
- − Depreciation
- −$1,888
- Taxable income
- $4,159
- Est. tax owed @ 24.0%
- −$998
- After-tax cash flow
- $3,987/yr
For passive investors: Depreciation is non-cash, so a rental often shows a tax loss while cash-flowing — sheltering income. Rental losses are passive: they offset passive income freely, and up to $25,000/yr can offset ordinary (W-2) income if you actively participate and your MAGI is under $100k (phasing out to $0 by $150k); unused losses carry forward. On sale, claimed depreciation is recaptured at up to 25%, and gains may owe capital-gains tax (a 1031 exchange can defer both). Figures are a year-1 estimate at your 24.0% rate — not tax advice; consult a CPA.
Schools (NCES district)
- District
- Ithaca Public Schools
- NCES district ID
- 2619580
- Math proficiency
- 31% ▼ -9.00%
- Reading proficiency
- 48% ▼ -7.00%
- Median HH income
- $45,626
- Composite
- 33.6/100
- National rank
- #5412
- State rank
- #221 of 540 in MI
Livability — Ithaca
- Score
- 71/100
- State rank
- #265
- US rank
- #6549
Category grades
Schools grade is shown separately in the Schools card above.
Census & demographics
- Census place
- Ithaca, MI
- Population (ZIP)
- 5,773
Population outlook (Gratiot County) Hauer SSP2
- Today (2025)
- 39,991 people
- By 2030
- 38,944 · -2.6%
- By 2040
- 36,694 · -8.2%
- By 2050
- 34,314 · -14.2%
- By 2075
- 27,693 · -30.8%
- By 2100
- 20,809 · -48.0%
Race, ethnicity, and origin ACS 2023
- Neighborhood character
- Predominantly White (90%)
- Race & ethnicity
- White 90% Hispanic / Latino 6% Two or more races 3%
- Hispanic origin (detail)
- Mexican 4%
- Common ancestry
- Lithuanian 4% Iranian 3% Romanian 2%
- Foreign-born
- 1% · Canada
- Languages at home
- 96% English-only · Spanish 2% German/W. Germanic 1%
Political lean MEDSL · Gratiot
- 2024 margin
- Solid R (+31.3) · D 33.7% · R 65.0% · Other 1.4%
- 2008→2024 swing
- -35.7pp toward R · 2008: 4.4pp · 2024: -31.3pp
- All cycles
- 2024: R+31.3 2020: R+28.3 2016: R+25.6 2012: R+3.9 2008: D+4.4
Not yet ingested
- Civics
- —
Market trends
- HPI YoY
- ▼ -106.61%
- Current HPI
- 208.838
- Rent YoY
- —
- Metro
- —
- State GDP YoY
- ▲ 1.37%
- F500 in state
- 28
Industry mix (Fortune 500 HQ in MI)
| Industry | F500 HQs | Revenue |
|---|---|---|
| Automotive Parts | 3 | $48B |
|
||
| Automotive | 2 | $372B |
|
||
| Chemicals | 1 | $45B |
|
||
| Automotive Retail | 1 | $29B |
|
||
| Healthcare / Medical Devices | 1 | $23B |
|
||
| Automotive Technology | 1 | $20B |
|
||
Price history
+0.0% since first listed9 events — show timeline
- 2026-05-29 Sold (MLS) $60,000 MiRealSource-MiMLS
- 2026-05-29 Sold (MLS) $60,000 REALCOMP
- 2026-05-18 Pending — REALCOMP
- 2026-05-18 Pending — MiRealSource-MiMLS
- 2026-05-05 Price Changed $64,900 MiRealSource-MiMLS
- 2026-05-05 Price Changed $64,900 REALCOMP
- 2026-04-24 Listed $79,900 MiRealSource-MiMLS
- 2026-04-24 Listed $79,900 REALCOMP
- 2016-07-22 Sold (Public Records) $60,000 Public Records
Cash-flow waterfall
monthlySold comps — $/sqft
last 12 mo · ≤1 miLoading sold comps…