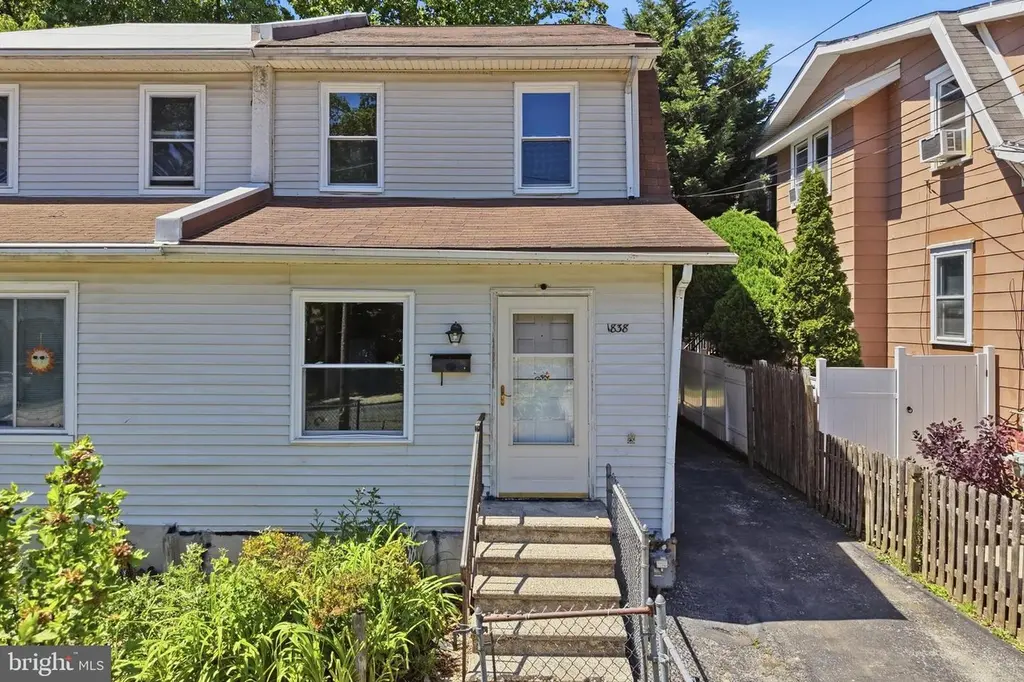
1838 Shallcross Ave · Folcroft, PA
Flood risk 1/10 · Minimal
- FEMA flood zone
- X (unshaded)
- Chance of flooding over 30 yrs
- 0.0%
- Est. flood insurance / yr
- $473 – $860
Fire risk 1/10 · Minimal
- Est. fire insurance / yr
- $511 – $949
Heat risk 6/10 · Moderate
- Hot days now (above 103°F)
- 7 days/yr
- Hot days in 30 yrs
- 15 days/yr
Wind risk 6/10 · Moderate
- Chance of severe wind over 30 yrs
- 27.0%
Air-quality risk 4/10 · Minor
- Unhealthy air days now
- 3 days/yr
- Unhealthy air days in 30 yrs
- 6 days/yr
Risk factors via First Street. Map © Google.
Why this score? — see what drove the C- grade
The composite is a weighted blend of 9 inputs, each scored 0–100. Each bar is that input's sub-score; the figure is the points it added to the 100-point composite (weight × sub-score).
- ARV discount +15.0/15.0
- Cash flow +14.9/30.0
- 1% rule +5.1/10.0
- DSCR +4.6/10.0
- Livability +3.9/5.0
- Rent growth +2.5/5.0
- Condition / age +2.5/5.0
- Schools +2.0/10.0
- Appreciation +0.0/10.0
$199,900
🖨 Deal sheet 📄 Offer letter ✓ Due diligence
Listing remarks
Handyman Special! Instant Equity To Be Earned! Welcome to 1838 Shallcross Avenue located in the highly desirable Folcroft Borough neighborhood. This twin home offers incredible potential and is perfect for investors or savvy buyers looking to build instant equity. The main level features a welcoming living room, spacious dining room, half bathroom, and nicely sized kitchen with dinette area. The second floor offers three generously sized bedrooms and one full bathroom. The large full basement provides endless possibilities for additional living space or storage. Outside, enjoy the large backyard, private deck, storage shed, and nicely sized driveway. Home is being sold in as-is condition, w
Key facts
- Built 1925
- Listed 22 days
Property features AI
Exterior
- Parking: Driveway
- Utilities: Public water; Public sewer
- Home design: Semi-detached property; Ownership: Fee simple; Above-grade finished area reported as 1,200 (assessor)
- Construction: Concrete perimeter foundation; Other structures above and below grade
- Exterior features: Lot dimensions approximately 24.00 x 116.00; No tidal water
Interior
- Bedrooms: Three bedrooms on the upper level
- Bathrooms: One full bathroom on the upper level; One half bathroom on the main level; Total: one full bathroom and one half bathroom
- Heating & cooling: Heating: Other; Cooling: Other; Hot water: Other
- Interior features: Basement with interior access; Living area reported by assessor
Neighborhood map
What this means for you Summary
Snapshot
- This is a 3-bed/1.0-bath townhouse listed at $200k.
Deal economics
- At list price, monthly cash flow is $58 ($700/yr) — positive.
- The deal already cash-flows at list — no discount required.
- Meets the 1% rule at list price ($2k rent vs $200k).
- Recommended offer: $197k (1.5% below list) — sets the bar for market timing.
Location & tenants
- Location reads 77/100 on livability (#342 in PA, #2,995 nationally) — a middle-class / working-renter tenant base. Strengths: cost of living A+, housing A+, commute A-; Watch: schools D+, crime F, amenities F.
- Southeast Delco SD (suburban): math 13% / reading 33% proficiency, ranked #478 of 539 in PA (top 89%) — low school quality limits family demand, transient renter base, plan for 1-2y turnover; 63% free/reduced lunch — lower-income household profile, screen leases tightly.
- Market conditions: 18 active listings in the ZIP; 35 comparable units currently listed for rent nearby; rentals at typical pace (median 24d on market — plan ~3-4 weeks tenant-placement turnaround); 299 units permitted in Delaware County in 2024 (5 in 5+ unit buildings).
- This rent runs 40% of the median local income ($61k/yr) — at the standard rent-burdened threshold; future hikes will face affordability resistance.
Forward outlook
- Local home prices are declining (-3.0%/yr); year-one equity from $1k of loan paydown is wiped out by about $6k of value loss. Plan a longer hold.
Negotiation context
- It's been on market 23 days — a 2% lower offer ($197k) is reasonable based on typical stale-listing flexibility.
- Current owner paid $155k; 29% above their basis — modest negotiation headroom, anchor on the comps not their cost.
Risks & watch-outs
- Watch-outs: built in 1925 — expect roof / HVAC / electrical / plumbing capex.
- Climate carrying-cost: major wind risk, 27% chance of damaging wind over 30y; extreme-heat days projected 7→15/yr by 2055 (HVAC capex compounding) — expect insurance premiums to compound above CPI over the hold.
Questions for the listing agent
- Built in 1925 — when were the roof, HVAC, electrical panel, plumbing, and water heater last replaced?
- Is there a deadline driving the sale (1031 exchange, divorce, estate, relocation)? That informs how much negotiation room exists.
- Schools are D-rated, which usually means shorter tenancies and higher turnover. Who's the typical renter profile here, and what's been the actual vacancy rate?
- Crime grade is F in this area — have there been break-ins, vandalism, or insurance claims at this property in the last 3 years? What carrier currently insures it and at what premium?
- What's the average days-on-market for RENTAL listings here right now (not sales)? A rising rental-DOM trend means longer vacancies and softer asking-rent achievability than the comps imply.
- What's the recent tenant-quality profile in this submarket — average credit score on applications, eviction rate, late-payment / NSF rate, and stable-employment percentage? A property-management company in the area should have these aggregated.
- How much new for-sale + rental construction is in the pipeline within 1–3 miles? Heavy new supply typically softens prices + rents 12–24 months out; constrained supply supports both.
Investment metrics
- 1% rule
- 1.01% ✓
- Cap rate
- 6.64%
- Cash-on-cash
- 1.25%
- DSCR
- 1.06
- GRM
- 8.2
CMA / ARV
- ARV (on-the-fly)
- $242,400
- Comps found
- 12
Show comp detail 12 sales within ~0.75 mi
| Address | Dist | Beds/Ba | Sqft | Sold | Price | $/sf | Match |
|---|---|---|---|---|---|---|---|
| 102 Rambler Rd | 0.38mi | 3/1.0 | 1,316 (+10%) | 1mo | $299,000 | $227 | 66 |
| 2313 Delmar Dr | 0.57mi | 3/1.5 | 1,152 (-4%) | 2mo | $230,000 | $200 | 64 |
| 5 S Wells Ave | 0.70mi | 3/1.5 | 1,210 (+1%) | 2mo | $245,000 | $202 | 63 |
| 753 Bennington Rd | 0.48mi | 3/1.0 | 1,088 (-9%) | 2mo | $213,000 | $196 | 60 |
| 765 Bennington Rd | 0.50mi | 3/1.5 | 1,088 (-9%) | 1mo | $220,000 | $202 | 59 |
| 929 Delview Dr | 0.57mi | 3/1.0 | 1,088 (-9%) | 2mo | $145,000 | $133 | 56 |
| 401 Custer Ave | 0.72mi | 3/1.0 | 1,255 (+5%) | 3mo | $290,000 | $231 | 56 |
| 1196 Taylor Dr | 0.71mi | 3/2.0 | 1,152 (-4%) | 3mo | $265,000 | $230 | 54 |
| 948 Grant Rd | 0.60mi | 3/1.5 | 1,088 (-9%) | 2mo | $215,000 | $198 | 52 |
| 1087 Taylor Dr | 0.74mi | 3/1.5 | 1,120 (-7%) | 3mo | $255,000 | $228 | 50 |
| 317 N Llanwellyn Ave | 0.63mi | 3/1.5 | 1,322 (+10%) | 3mo | $206,500 | $156 | 49 |
| 1301 Burton Ave | 0.73mi | 3/1.0 | 1,330 (+11%) | 2mo | $199,000 | $150 | 46 |
Match score weights: distance 35% · size 25% · config 20% · recency 20%. Top-matched comps best support the ARV.
Projected returns pro-forma
-3.0% appreciation · 3.0% rent growth · sell at horizon
- IRR
- -14.2%
- Equity multiple
- 0.49×
- Total profit
- $-28,548
- Equity at exit
- $29,806
- IRR
- -5.3%
- Equity multiple
- 0.65×
- Total profit
- $-19,553
- Equity at exit
- $17,284
Cash invested: $55,972 (down + closing). Projections, not guarantees.
Landlord ↔ Tenant lean methodology
- Overall (STATE)
- 62 Landlord-Friendly
- State Pennsylvania
- 62 Landlord-Friendly · EVEN
- County
- — inherits STATE
- City
- — inherits STATE
ZIP-level market 19032
- Home prices YoY
- -17.7%
- Active inventory
- 18
- Price-to-rent
- 8.2×
Monthly cashflow live
- Estimated rent
- $2,024 high interval (Pro) →
- Mortgage (P&I)
- −$1,048
- Tax from tax record
- −$409 /mo · $4,903/yr
- Insurance
- −$83
- HOA
- −$0
- Vacancy / Maint / Mgmt
- −$425
- Net cashflow
- $58
Break-even live
UW: 25.0% down · 7.5% · 30yr · 1.5% tax · 5.0% vac · 8.0% maint · 8.0% mgmt
Financing live
Cash to close
- Down payment
- $49,975
- Closing costs
- $5,997
- Reserves months
- —
- Total cash needed
- —
Loan-product check · same deal, 3 products live
Conventional
25% down · 7.5% · 30yr
- Down + closing
- —
- Monthly P&I
- —
- Monthly cashflow
- —
- DSCR
- —
- Eligible?
- —
Personal DTI + credit; lowest rate.
DSCR
20% down · 8.5% · 30yr
- Down + closing
- —
- Monthly P&I
- —
- Monthly cashflow
- —
- DSCR
- —
- Eligible?
- —
No personal income docs; deal must DSCR.
Hard money
10% down · 12.0% · 12mo
- Down + closing
- —
- Monthly P&I
- —
- Monthly cashflow
- —
- DSCR
- —
- Eligible?
- —
Short-term bridge; refi at stabilization.
Rent comps 35 comps
| Address | Beds | Baths | Sqft | Rent | $/sqft | DOM | Units | Dist |
|---|---|---|---|---|---|---|---|---|
| 145 Isabel Ave Unit 145B Glenolden, PA | 2.0 | 1.0 | 890 | $1,525 | $1.71 | 43d | 1 | 0.27mi |
| 29 Logan Ave Unit 11 Glenolden, PA | 2.0 | 1.0 | 850 | $1,350 | $1.59 | 24d | 1 | 0.35mi |
| 100 E Glenolden Ave Glenolden, PA | 1.0–4.0 | 1.0–2.0 | 920 | $2,167 | $2.36 | 1d | 4 | 0.41mi |
| 804 Grant Rd Folcroft, PA | 3.0 | 1.0 | 1088 | $2,050 | $1.88 | 43d | 1 | 0.45mi |
| 1512 Elmwood Ave Folcroft, PA | 2.0 | 1.0 | 850 | $1,499 | $1.76 | 24d | 1 | 0.47mi |
| 1511 Elmwood Ave Folcroft, PA | 1.0–3.0 | 1.0 | 725 | $1,649 | $2.27 | 23d | 3 | 0.47mi |
| 1513 Elmwood Ave Unit 5 Folcroft, PA | 3.0 | 1.0 | 850 | $1,799 | $2.12 | 43d | 1 | 0.47mi |
| 1513 Elmwood Ave Unit 4 Folcroft, PA | 3.0 | 1.0 | 1025 | $1,699 | $1.66 | 24d | 1 | 0.47mi |
| 1505 Elmwood Ave Unit 5 Folcroft, PA | 2.0 | 1.0 | 850 | $1,499 | $1.76 | 24d | 1 | 0.48mi |
| 1503 Elmwood Ave Folcroft, PA | 3.0 | 1.0 | 1025 | $1,699 | $1.66 | 24d | 1 | 0.49mi |
| 1503 Elmwood Ave Folcroft, PA | 3.0 | 1.0 | 850 | $1,799 | $2.12 | 43d | 1 | 0.49mi |
| 132 Folcroft Ave Folcroft, PA | 2.0 | 1.0 | 725 | $1,679 | $2.32 | 2d | 3 | 0.53mi |
| 777 Bennington Rd Folcroft, PA | 4.0 | 1.5 | 1488 | $2,800 | $1.88 | 43d | 1 | 0.55mi |
| 350 S Scott Ave Unit 1 Glenolden, PA | 2.0 | 1.0 | 715 | $1,700 | $2.38 | 24d | 1 | 0.56mi |
| 432 S Chester Pike Glenolden, PA | 2.0 | 1.0 | 792 | $1,325 | $1.67 | 44d | 1 | 0.56mi |
| 820 Greenhill Rd Sharon Hill, PA | 4.0 | 2.0 | 1184 | $2,600 | $2.20 | 5d | 1 | 0.64mi |
| 2001 Carter Rd Folcroft, PA | 3.0 | 1.0 | 1224 | $2,150 | $1.76 | 43d | 1 | 0.65mi |
| 66 Folcroft Ave Folcroft, PA | 3.0 | 1.0 | 1224 | $1,895 | $1.55 | 3d | 1 | 0.68mi |
| 1053 Taylor Dr Folcroft, PA | 3.0 | 1.5 | 1120 | $2,000 | $1.79 | 14d | 1 | 0.82mi |
| 1019 Taylor Dr Folcroft, PA | 3.0 | 1.5 | 1152 | $2,040 | $1.77 | 2d | 1 | 0.86mi |
| 1519 Roosevelt Dr Sharon Hill, PA | 3.0 | 1.5 | 1260 | $2,295 | $1.82 | 43d | 1 | 0.90mi |
| 1074 N Academy Ave Glenolden, PA | 3.0 | 1.0 | 1152 | $1,850 | $1.61 | 5d | 1 | 0.93mi |
| 112 Juliana Ter Darby, PA | 3.0 | 1.0 | 1020 | $2,350 | $2.30 | 44d | 1 | 1.20mi |
| 112 Juliana Ter Darby, PA | 3.0 | 1.0 | 1020 | $2,450 | $2.40 | 24d | 1 | 1.20mi |
| 118 Felton Ave Darby, PA | 3.0 | 1.0 | 1152 | $1,750 | $1.52 | 21d | 1 | 1.24mi |
| 201 Westbridge Rd Glenolden, PA | 3.0 | 1.5 | 1224 | $2,350 | $1.92 | 24d | 1 | 1.25mi |
| 1201 Bartram Ave Darby, PA | 2.0 | 1.0 | 700 | $1,350 | $1.93 | 10d | 1 | 1.28mi |
| 925 Maple Ave Glenolden, PA | 3.0 | 2.0 | 1152 | $2,800 | $2.43 | 21d | 1 | 1.36mi |
| 306 Pine St Glenolden, PA | 3.0 | 2.0 | 1120 | $2,400 | $2.14 | 4d | 1 | 1.38mi |
| 304 Pine St Glenolden, PA | 3.0 | 2.0 | 1120 | $2,400 | $2.14 | 43d | 1 | 1.39mi |
| 902 Maple Ave Glenolden, PA | 3.0 | 1.0 | 1152 | $1,745 | $1.51 | 43d | 1 | 1.39mi |
| 640 South Ave Secane, PA | 1.0–2.0 | 1.0–1.5 | 742 | $1,600 | $2.16 | 12d | 5 | 1.43mi |
| 701 Lincoln Ave Prospect Park, PA | 1.0–2.0 | 1.0 | 762 | $1,425 | $1.87 | 21d | 3 | 1.47mi |
| 601 Poplar St Sharon Hill, PA | 1.0–2.0 | 1.0 | 787 | $1,599 | $2.03 | 14d | 5 | 1.48mi |
| 100 S Oak Ave Glenolden, PA | 1.0–2.0 | 1.0–2.0 | 830 | $1,500 | $1.81 | 23d | 3 | 1.49mi |
Listing history 20 events
-
2026-06-18days on market $199,900 Active 23 DOM
-
2026-06-17days on market $199,900 Active 22 DOM
-
2026-06-16days on market $199,900 Active 21 DOM
-
2026-06-15pricedays on market $199,900 Active 20 DOM
-
2026-06-13days on market $205,000 Active 18 DOM
-
2026-06-13days on market $205,000 Active 17 DOM
-
2026-06-09days on market $205,000 Active 14 DOM
-
2026-06-08days on market $205,000 Active 13 DOM
-
2026-06-07days on market $205,000 Active 12 DOM
-
2026-06-04days on market $205,000 Active 9 DOM
-
2026-06-03days on market $205,000 Active 8 DOM
-
2026-06-02days on market $205,000 Active 7 DOM
-
2026-06-01days on market $205,000 Active 6 DOM
-
2026-05-31days on market $205,000 Active 5 DOM
-
2026-05-17historical $205,000
-
2026-04-14soldstatus $155,000
-
2008-09-25historical
-
2007-09-26$149,900
-
1990-09-17soldstatus $93,900
-
1989-12-29soldstatus $35,000
ⓘ Source: listings_history table (triggers on properties + properties_extension) + one-shot
backfill from property_details.listing_events for pre-trigger history.
Tax reassessment forecast PA · Partial reset (capped growth)
- Current annual tax
- $4,903 · $409/mo
- Projected year-2 tax
- $4,903 · $409/mo
- Expected delta
- $0/yr ($0/mo · 0.0%)
ⓘ Screening estimate from a state-policy table — verify with the county assessor before closing.
Climate risk First Street
- Flood 1/10 Low FEMA zone X (unshaded) · 0% chance over 30 yrs
- Wildfire 1/10 Low
- Heat 6/10 Major 7 d/yr ≥103°F today · 15 d/yr by 30 yrs out
- Wind 6/10 Major 27% chance of damaging wind over 30 yrs
- Air quality 4/10 Moderate 3 unhealthy d/yr today · 6 by 30 yrs out
Nearby sold comps map
Loading sold comps map…
Walkable amenities ~0.75 mi
Loading nearby amenities…
Taxation est. · year 1
- Rental income
- $24,282
- − Mortgage interest
- −$11,198
- − Property taxes
- −$4,903
- − Insurance
- −$1,000
- − Repairs & maintenance
- −$1,943
- − Management
- −$1,943
- − Depreciation
- −$5,815
- Taxable loss
- −$2,519
- Est. tax savings @ 24.0%
- +$605
- After-tax cash flow
- $1,305/yr
For passive investors: Depreciation is non-cash, so a rental often shows a tax loss while cash-flowing — sheltering income. Rental losses are passive: they offset passive income freely, and up to $25,000/yr can offset ordinary (W-2) income if you actively participate and your MAGI is under $100k (phasing out to $0 by $150k); unused losses carry forward. On sale, claimed depreciation is recaptured at up to 25%, and gains may owe capital-gains tax (a 1031 exchange can defer both). Figures are a year-1 estimate at your 24.0% rate — not tax advice; consult a CPA.
Schools (NCES district)
- District
- Southeast Delco SD
- NCES district ID
- 4222400
- Math proficiency
- 13% ▼ -8.00%
- Reading proficiency
- 33% ▼ -9.00%
- Median HH income
- $49,309
- Composite
- 20.25/100
- National rank
- #8623
- State rank
- #478 of 539 in PA
Livability — Folcroft
- Score
- 77/100
- State rank
- #342
- US rank
- #2995
Category grades
Schools grade is shown separately in the Schools card above.
Census & demographics
- Census place
- Folcroft, PA
- County
- Delaware County · 399,863 people
- City population
- 6,772
- Metro
- Philadelphia-Camden-Wilmington, PA-NJ-DE-MD
- Population (ZIP)
- 6,772
- Household income
- $61,306
- Rent vs Own
- Severe rent burden
- 254.0
Population outlook (Delaware County) Hauer SSP2
- Today (2025)
- 577,490 people
- By 2030
- 581,243 · +0.6%
- By 2040
- 584,700 · +1.2%
- By 2050
- 586,581 · +1.6%
- By 2075
- 598,706 · +3.7%
- By 2100
- 590,823 · +2.3%
Race, ethnicity, and origin ACS 2023
- Neighborhood character
- Diverse neighborhood (Simpson 0.65)
- Race & ethnicity
- Black 43% White 41% Hispanic / Latino 7% Two or more races 7% Asian 3%
- Hispanic origin (detail)
- Mexican 2% Puerto Rican 3%
- Common ancestry
- Romanian 5% Lithuanian 2% Portuguese 2%
- Foreign-born
- 14% · Canada, United Kingdom, Jamaica
- Languages at home
- 79% English-only · Spanish 6% French/Haitian/Cajun 5% Other Indo-European 2%
Political lean MEDSL · Delaware
- 2024 margin
- Strong D (+23.7) · D 61.4% · R 37.6% · Other 1.0%
- 2008→2024 swing
- +2.3pp toward D · 2008: 21.4pp · 2024: 23.7pp
- All cycles
- 2024: D+23.7 2020: D+26.7 2016: D+22.0 2012: D+21.8 2008: D+21.4
Not yet ingested
- Civics
- —
Market trends
- HPI YoY
- ▼ -61.37%
- Current HPI
- 284.5507
- Rent YoY
- —
- Metro
- Philadelphia-Camden-Wilmington, PA-NJ-DE-MD
- State GDP YoY
- ▲ 1.68%
- F500 in state
- 34
Industry mix (Fortune 500 HQ in PA)
| Industry | F500 HQs | Revenue |
|---|---|---|
| Healthcare | 2 | $309B |
|
||
| Insurance | 2 | $27B |
|
||
| Telecommunications / Media | 1 | $124B |
|
||
| Industrial Distribution | 1 | $22B |
|
||
| Financial Services | 1 | $20B |
|
||
| Chemicals / Materials | 1 | $18B |
|
||
Price history
+485.7% since first listed6 events — show timeline
- 2026-05-17 Coming Soon $205,000 BRIGHT MLS
- 2026-04-14 Sold (Public Records) $155,000 Public Records
- 2008-09-25 Listing Removed — BRIGHT MLS
- 2007-09-26 Listed $149,900 BRIGHT MLS
- 1990-09-17 Sold (Public Records) $93,900 Public Records
- 1989-12-29 Sold (Public Records) $35,000 Public Records
Property tax history
+4.2%/yrLatest (2026): $4,903 · +34.0% YoY. Source: county tax records.
Cash-flow waterfall
monthlySold comps — $/sqft
last 12 mo · ≤1 miLoading sold comps…