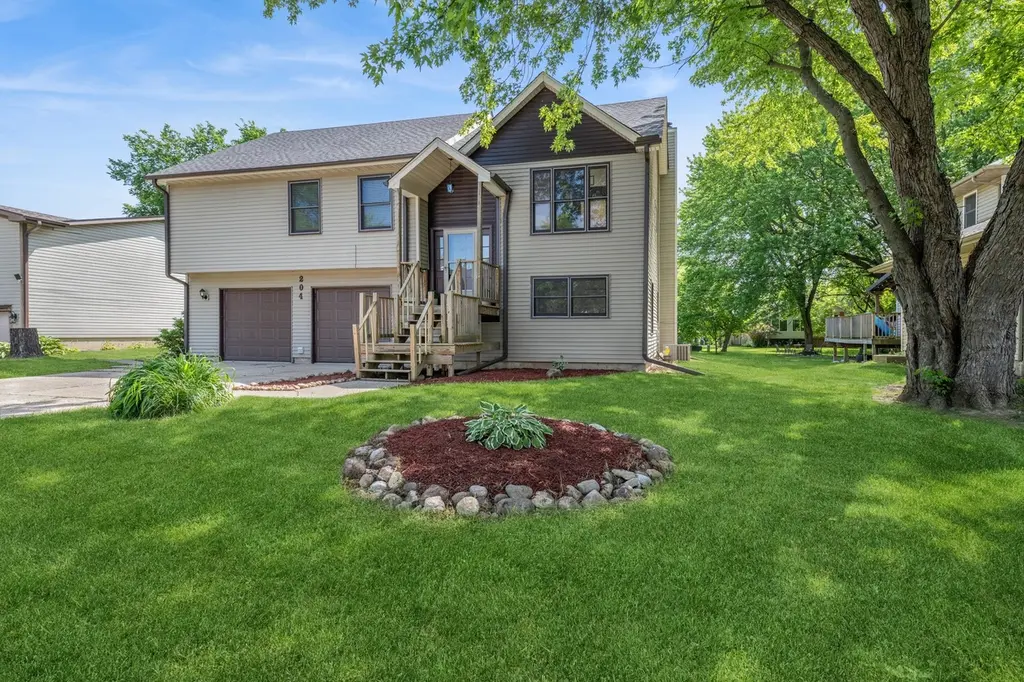
204 Brandywine Dr · Candlewick Lake, IL
Flood risk 1/10 · Minimal
- FEMA flood zone
- X (unshaded)
- Chance of flooding over 30 yrs
- 0.0%
- Est. flood insurance / yr
- $473 – $860
Fire risk 1/10 · Minimal
- Est. fire insurance / yr
- $804 – $1,492
Heat risk 2/10 · Minimal
- Hot days now (above 101°F)
- 7 days/yr
- Hot days in 30 yrs
- 15 days/yr
Wind risk 2/10 · Minimal
- Chance of severe wind over 30 yrs
- —
Air-quality risk 3/10 · Minor
- Unhealthy air days now
- 2 days/yr
- Unhealthy air days in 30 yrs
- 3 days/yr
Risk factors via First Street. Map © Google.
Why this score? — see what drove the B- grade
The composite is a weighted blend of 9 inputs, each scored 0–100. Each bar is that input's sub-score; the figure is the points it added to the 100-point composite (weight × sub-score).
- Cash flow +30.0/30.0
- 1% rule +10.0/10.0
- DSCR +10.0/10.0
- Appreciation +6.6/10.0
- Livability +3.1/5.0
- ARV discount +2.9/15.0
- Rent growth +2.5/5.0
- Condition / age +2.5/5.0
- Schools +1.7/10.0
$270,000
🖨 Deal sheet 📄 Offer letter ✓ Due diligence
Listing remarks MLS
Spacious raised-ranch home with 4 bedrooms, 3 full bathrooms and attached 2-car garage in Candlewick Lake! Home needs TLC but for someone handy or an investor, this would make a great investment. The main level features a light and bright living room, separate dining area and eat-in kitchen. 3 of the bedrooms and 2 full bathrooms are on the main floor. The lower level walk-out has a rec room, 4th bedroom, full bathroom, bonus room and laundry room. No FHA/VA, sold as-is.
Key facts
- Gated community
- New a/c unit
- Private lake
Tags
Property features AI
Finance
- Other: Property is not currently leased; Ownership recorded as fee simple with HOA
- HOA & community: Homeowners association fee collected annually; HOA fee covers clubhouse, exercise facilities and pool; Annual association fee
Exterior
- Parking: Attached garage with 2 garage spaces; Asphalt driveway; Garage door opener
- Utilities: Public water; Public sewer; Electric and gas service (natural gas heating)
- Home design: Detached single-family raised ranch; Fee simple ownership with homeowners association; Approximately 31–40 years old; Asphalt roof; Vinyl siding; Lot dimensions approximately 70 x 155
- Construction: Vinyl siding construction; Asphalt roof
- Exterior features: Deck
Interior
- Kitchen: Range; Microwave; Dishwasher; Refrigerator; Disposal; Eating area / table space
- Bedrooms: 4 bedrooms (master and two bedrooms on main level; additional bedroom in walkout basement); Master bedroom with full bath
- Bathrooms: 3 full bathrooms; Basement includes a bathroom
- Heating & cooling: Natural gas heating; Central air conditioning
- Interior features: Finished basement with exterior entry, egress window and walk-out access; Separate dining room; Pull-down attic stairs; One gas-log fireplace in the family room; Nine total rooms
- Laundry & utility: Laundry room in walkout basement; Gas dryer hookup; Water heater (gas); Owned water softener
Neighborhood map
What this means for you Summary
Snapshot
- This is a 4-bed/2.0-bath single-family listed at $270k.
Deal economics
- At list price, monthly cash flow is $1k ($18k/yr) — positive.
- The deal already cash-flows at list — no discount required.
- Meets the 1% rule at list price ($4k rent vs $270k).
- Recommended offer: $266k (1.5% below list) — sets the bar for market timing.
Location & tenants
- Location reads 61/100 on livability (#891 in IL) — a middle-class / working-renter tenant base. Strengths: employment A+, cost of living A+, housing A+; Watch: amenities F, commute F, health & safety F.
- North Boone CUSD 200 (rural): math 14% / reading 21% proficiency, ranked #440 of 620 in IL (top 71%) — low school quality limits family demand, transient renter base, plan for 1-2y turnover.
- Zoned schools: Manchester Elem School (math 27% / reading 22%, grade F, #850 of 2,056 statewide, top 45%, 143 students, 0% FRL); North Boone Middle School (math 15% / reading 24%, grade F, #425 of 665 statewide, top 65%, 242 students, 0% FRL); North Boone High School (math 12% / reading 22%, grade F, #430 of 693 statewide, top 66%, 517 students, 0% FRL) — zoned schools average 0% FRL vs 35% district-wide (35 pts lower); this property's tenant base skews higher-income than the district average.
- Market conditions: 38 active listings in the ZIP; 56 units permitted in Boone County in 2024 (0 in 5+ unit buildings).
Forward outlook
- In year one you build about $11k of equity ($2k loan paydown + $9k appreciation (3.2% local appreciation)).
- Boone County population projected at -16% by 2050 — secular population decline; favor cash flow + early exit over multi-decade hold.
- At projected returns (3.2% appreciation + 3.0% rent growth), your $76k cash investment doubles in ~3 years — after that, you're playing with house money.
- By year 4, paydown + projected appreciation supports a ~$36k cash-out refi (75% LTV) — recoverable capital for the next deal without selling this one.
Negotiation context
- It's been on market 17 days — a 2% lower offer ($266k) is reasonable based on typical stale-listing flexibility.
- 6 sale attempts since 19y ago with the ask held roughly flat each time — persistent listings suggest the price (not the market) is what's stuck; bring a comps-based counter.
- Current owner paid $165k; list at $270k implies a 64% gain — meaningful room to come down on a strong offer.
Questions for the listing agent
- What does the HOA fee cover, when was the last increase, and are there any pending special assessments or reserve-fund shortfalls?
- Is there a deadline driving the sale (1031 exchange, divorce, estate, relocation)? That informs how much negotiation room exists.
- Schools are F-rated, which usually means shorter tenancies and higher turnover. Who's the typical renter profile here, and what's been the actual vacancy rate?
- What's the average days-on-market for RENTAL listings here right now (not sales)? A rising rental-DOM trend means longer vacancies and softer asking-rent achievability than the comps imply.
- What's the recent tenant-quality profile in this submarket — average credit score on applications, eviction rate, late-payment / NSF rate, and stable-employment percentage? A property-management company in the area should have these aggregated.
- How much new for-sale + rental construction is in the pipeline within 1–3 miles? Heavy new supply typically softens prices + rents 12–24 months out; constrained supply supports both.
Investment metrics
- 1% rule
- 1.65% ✓
- Cap rate
- 12.91%
- Cash-on-cash
- 23.64%
- DSCR
- 2.05
- GRM
- 5.0
CMA / ARV
- ARV (on-the-fly)
- $245,030
- Comps found
- 12
Show comp detail 12 sales within ~0.75 mi
| Address | Dist | Beds/Ba | Sqft | Sold | Price | $/sf | Match |
|---|---|---|---|---|---|---|---|
| 204 Brandywine Dr | 0.00mi | 4/3.0 | 2,290 (0%) | 6mo | $165,000 | $72 | 91 |
| 110 Liverpool Dr SE | 0.12mi | 4/3.0 | 2,316 (+1%) | 8mo | $238,000 | $103 | 82 |
| 103 SE Liverpool Dr | 0.17mi | 4/2.0 | 2,338 (+2%) | 10mo | $248,500 | $106 | 80 |
| 2211 Candlewick Dr SE | 0.19mi | 4/3.0 | 2,132 (-7%) | 1mo | $260,500 | $122 | 75 |
| 204 SE King Henry Rd | 0.37mi | 3/2.0 (-1) | 2,300 (+0%) | 7mo | $224,000 | $97 | 72 |
| 108 James Cir | 0.28mi | 3/2.0 (-1) | 2,192 (-4%) | 6mo | $232,000 | $106 | 70 |
| 107 SE Cornwall Cir | 0.36mi | 5/2.0 (+1) | 2,252 (-2%) | 10mo | $241,000 | $107 | 67 |
| 114 Galahad Ct | 0.46mi | 5/2.0 (+1) | 2,414 (+5%) | 2mo | $250,500 | $104 | 63 |
| 221 Liverpool Dr SE | 0.23mi | 4/3.0 | 1,992 (-13%) | 10mo | $240,000 | $120 | 56 |
| 110 SE Brandywine Dr | 0.26mi | 3/3.0 (-1) | 2,044 (-11%) | 7mo | $277,000 | $136 | 56 |
| 618 NE Candlewick Dr | 0.69mi | 3/2.5 (-1) | 2,248 (-2%) | 11mo | $410,000 | $182 | 49 |
| 109 Galleon Run Dr | 0.58mi | 3/2.5 (-1) | 2,019 (-12%) | 4mo | $250,000 | $124 | 42 |
Match score weights: distance 35% · size 25% · config 20% · recency 20%. Top-matched comps best support the ARV.
Projected returns pro-forma
3.23% appreciation · 3.0% rent growth · sell at horizon
- IRR
- 30.2%
- Equity multiple
- 2.73×
- Total profit
- $130,794
- Equity at exit
- $124,868
- IRR
- 30.4%
- Equity multiple
- 5.35×
- Total profit
- $328,978
- Equity at exit
- $195,174
Cash invested: $75,600 (down + closing). Projections, not guarantees.
Landlord ↔ Tenant lean methodology
- Overall (STATE)
- 43 Moderately Tenant-Leaning
- State Illinois
- 43 Moderately Tenant-Leaning · D+7
- County
- — inherits STATE
- City
- — inherits STATE
ZIP-level market 61065
- Home prices YoY
- 1.4%
- Active inventory
- 38
- Price-to-rent
- 5.0×
Monthly cashflow live
- Estimated rent
- $4,464 medium interval (Pro) →
- Mortgage (P&I)
- −$1,416
- Tax from tax record
- −$365 /mo · $4,377/yr
- Insurance
- −$112
- HOA
- −$144
- Vacancy / Maint / Mgmt
- −$937
- Net cashflow
- $1,489
Break-even live
UW: 25.0% down · 7.5% · 30yr · 1.5% tax · 5.0% vac · 8.0% maint · 8.0% mgmt
Financing live
Cash to close
- Down payment
- $67,500
- Closing costs
- $8,100
- Reserves months
- —
- Total cash needed
- —
Loan-product check · same deal, 3 products live
Conventional
25% down · 7.5% · 30yr
- Down + closing
- —
- Monthly P&I
- —
- Monthly cashflow
- —
- DSCR
- —
- Eligible?
- —
Personal DTI + credit; lowest rate.
DSCR
20% down · 8.5% · 30yr
- Down + closing
- —
- Monthly P&I
- —
- Monthly cashflow
- —
- DSCR
- —
- Eligible?
- —
No personal income docs; deal must DSCR.
Hard money
10% down · 12.0% · 12mo
- Down + closing
- —
- Monthly P&I
- —
- Monthly cashflow
- —
- DSCR
- —
- Eligible?
- —
Short-term bridge; refi at stabilization.
HOA detail
- Monthly dues
- $144 · $1,728/yr
Listing history 12 events
-
2026-06-18days on market $270,000 Active 17 DOM
-
2026-06-17days on market $270,000 Active 16 DOM
-
2026-06-16days on market $270,000 Active 15 DOM
-
2026-06-15days on market $270,000 Active 14 DOM
-
2026-06-13days on market $270,000 Active 12 DOM
-
2026-06-12days on market $270,000 Active 11 DOM
-
2026-06-09days on market $270,000 Active 8 DOM
-
2026-06-08days on market $270,000 Active 7 DOM
-
2026-06-07days on market $270,000 Active 6 DOM
-
2026-06-04days on market $270,000 Active 2 DOM
-
2026-06-01remarks 699-char remark
-
2026-06-01$270,000 Active 1 DOM
ⓘ Source: listings_history table (triggers on properties + properties_extension) + one-shot
backfill from property_details.listing_events for pre-trigger history.
Tax reassessment forecast IL · Partial reset (capped growth)
- Current annual tax
- $4,377 · $365/mo
- Projected year-2 tax
- $5,253 · $438/mo
- Expected delta
- +$876/yr (+$73/mo · 20.0%)
ⓘ Screening estimate from a state-policy table — verify with the county assessor before closing.
Climate risk First Street
- Flood 1/10 Low FEMA zone X (unshaded) · 0% chance over 30 yrs
- Wildfire 1/10 Low
- Heat 2/10 Low 7 d/yr ≥101°F today · 15 d/yr by 30 yrs out
- Wind 2/10 Low
- Air quality 3/10 Moderate 2 unhealthy d/yr today · 3 by 30 yrs out
Nearby sold comps map
Loading sold comps map…
Walkable amenities ~0.75 mi
Loading nearby amenities…
Taxation est. · year 1
- Rental income
- $53,563
- − Mortgage interest
- −$15,124
- − Property taxes
- −$4,377
- − Insurance
- −$1,350
- − Repairs & maintenance
- −$4,285
- − Management
- −$4,285
- − HOA
- −$1,728
- − Depreciation
- −$7,855
- Taxable income
- $14,559
- Est. tax owed @ 24.0%
- −$3,494
- After-tax cash flow
- $14,375/yr
For passive investors: Depreciation is non-cash, so a rental often shows a tax loss while cash-flowing — sheltering income. Rental losses are passive: they offset passive income freely, and up to $25,000/yr can offset ordinary (W-2) income if you actively participate and your MAGI is under $100k (phasing out to $0 by $150k); unused losses carry forward. On sale, claimed depreciation is recaptured at up to 25%, and gains may owe capital-gains tax (a 1031 exchange can defer both). Figures are a year-1 estimate at your 24.0% rate — not tax advice; consult a CPA.
Schools (NCES district)
- District
- North Boone CUSD 200
- NCES district ID
- 1728700
- Math proficiency
- 14% ▼ -8.00%
- Reading proficiency
- 21% ▼ -12.00%
- Median HH income
- $59,553
- Composite
- 16.73/100
- National rank
- #9163
- State rank
- #440 of 620 in IL
Livability — Candlewick Lake
- Score
- 61/100
- State rank
- #891
- US rank
- #17350
Category grades
Schools grade is shown separately in the Schools card above.
Census & demographics
- Census place
- Candlewick Lake, IL
- Population (ZIP)
- 10,927
Population outlook (Boone County) Hauer SSP2
- Today (2025)
- 52,507 people
- By 2030
- 51,509 · -1.9%
- By 2040
- 48,611 · -7.4%
- By 2050
- 44,363 · -15.5%
- By 2075
- 33,262 · -36.7%
- By 2100
- 21,495 · -59.1%
Race, ethnicity, and origin ACS 2023
- Neighborhood character
- Predominantly White (76%)
- Race & ethnicity
- White 76% Hispanic / Latino 17% Two or more races 10% Black 2%
- Hispanic origin (detail)
- Mexican 13% Puerto Rican 4%
- Common ancestry
- Romanian 10% Portuguese 3% Lithuanian 3%
- Foreign-born
- 6% · Canada
- Languages at home
- 85% English-only · Spanish 10% Russian/Polish/Slavic 4%
Political lean MEDSL · Boone
- 2024 margin
- R (+14.5) · D 42.0% · R 56.5% · Other 1.6%
- 2008→2024 swing
- -18.7pp toward R · 2008: 4.2pp · 2024: -14.5pp
- All cycles
- 2024: R+14.5 2020: R+13.4 2016: R+14.6 2012: R+5.7 2008: D+4.2
Not yet ingested
- Civics
- —
Market trends
- HPI YoY
- ▲ 3.23%
- Current HPI
- 232.9144
- Rent YoY
- —
- Metro
- —
- State GDP YoY
- ▲ 1.59%
- F500 in state
- 60
Industry mix (Fortune 500 HQ in IL)
| Industry | F500 HQs | Revenue |
|---|---|---|
| Insurance | 4 | $201B |
|
||
| Consumer Goods | 4 | $87B |
|
||
| Industrial Machinery | 3 | $64B |
|
||
| Healthcare | 2 | $55B |
|
||
| Retail / Pharmacy | 1 | $148B |
|
||
| Agriculture / Food | 1 | $86B |
|
||
Price history
+116.2% since first listed19 events — show timeline
- 2026-06-01 Listed $270,000 MRED as Distributed by MLS Grid
- 2025-12-15 Sold (MLS) $165,000 MRED as Distributed by MLS Grid
- 2025-12-15 Sold (MLS) $165,000 NWIAR
- 2025-11-17 Pending — NWIAR
- 2025-11-17 Pending — MRED as Distributed by MLS Grid
- 2025-10-07 Listed $175,000 NWIAR
- 2025-10-06 Listed $175,000 MRED as Distributed by MLS Grid
- 2013-08-22 Sold (MLS) $82,000 MRED as Distributed by MLS Grid
- 2013-07-16 Pending — MRED as Distributed by MLS Grid
- 2013-07-09 Listing Removed — MRED as Distributed by MLS Grid
- 2013-06-21 Price Changed $84,900 MRED as Distributed by MLS Grid
- 2013-05-29 Listed $94,900 MRED as Distributed by MLS Grid
- 2009-10-23 Listing Removed — MRED as Distributed by MLS Grid
- 2009-09-22 Listed — MRED as Distributed by MLS Grid
- 2007-08-17 Sold (Public Records) $155,500 Public Records
- 2007-08-09 Sold (MLS) $155,500 MRED as Distributed by MLS Grid
- 2007-08-04 Listing Removed — MRED as Distributed by MLS Grid
- 2007-03-25 Listed $177,900 MRED as Distributed by MLS Grid
- 2003-08-05 Sold (Public Records) $124,900 Public Records
Property tax history
+4.7%/yrLatest (2025): $4,377 · +4.2% YoY. Source: county tax records.
Cash-flow waterfall
monthlySold comps — $/sqft
last 12 mo · ≤1 miLoading sold comps…