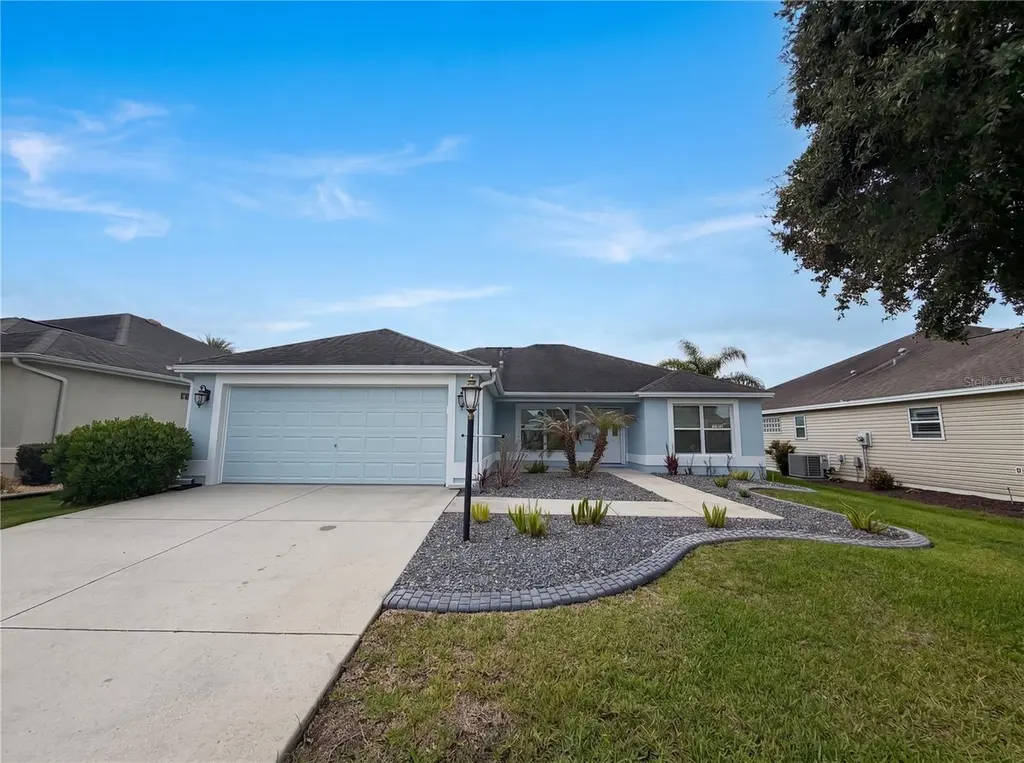
3323 Abana Path · The Villages, FL
Flood risk 1/10 · Minimal
- FEMA flood zone
- X (unshaded)
- Chance of flooding over 30 yrs
- 0.0%
- Est. flood insurance / yr
- $507 – $1,088
Fire risk 3/10 · Minor
- Est. fire insurance / yr
- $947 – $1,759
Heat risk 9/10 · Severe
- Hot days now (above 108°F)
- 7 days/yr
- Hot days in 30 yrs
- 23 days/yr
Wind risk 9/10 · Severe
- Chance of severe wind over 30 yrs
- 99.0%
Air-quality risk 3/10 · Minor
- Unhealthy air days now
- 2 days/yr
- Unhealthy air days in 30 yrs
- 3 days/yr
Risk factors via First Street. Map © Google.
Why this score? — see what drove the D grade
The composite is a weighted blend of 9 inputs, each scored 0–100. Each bar is that input's sub-score; the figure is the points it added to the 100-point composite (weight × sub-score).
- ARV discount +10.3/15.0
- Appreciation +10.0/10.0
- Cash flow +6.4/30.0
- Schools +5.2/10.0
- Livability +3.5/5.0
- Rent growth +2.5/5.0
- Condition / age +2.5/5.0
- 1% rule +2.1/10.0
- DSCR +0.7/10.0
$358,000
🖨 Deal sheet (PDF) 📄 Offer letter ✓ Due diligence
Listing remarks
One or more photo(s) has been virtually staged. Discover 3323 Abana Path, a residence designed for everyday comfort and practical living. The primary bathroom includes double sinks, complementing the spacious walk in closet within the primary bedroom, together providing enhanced personal utility. A covered patio extends the usable living space outdoors. This home truly brings together comfort and thoughtful functionality. . Included 100-Day Home Warranty with buyer activation
Key facts
- Double sinks
- Covered patio
- Walk in closet
Tags
Property features AI
Finance
- Other: Total living area approximately 1,559 (public records)
- Financial info: Lease restrictions apply
- HOA & community: Monthly association fee of $334; Association requires approval; Association fee includes access to pool and other amenities; The Village Community Development District; Pets allowed (weight limits apply)
Exterior
- Parking: Driveway; Attached garage with 1 garage space
- Security: Owned security system
- Utilities: Public water; Public sewer; Electricity available; Water service available
- Home design: Single family residence; One story; Faces northwest; Residential zoning
- Construction: Vinyl siding; Shingle roof; Slab foundation; Built on 0.13 acre lot
- Exterior features: Other exterior features; Asphalt road access
Interior
- Kitchen: Appliances included: Other
- Bedrooms: 3 bedrooms
- Flooring: Laminate flooring
- Bathrooms: 2 full bathrooms
- Heating & cooling: Central heating; Central air conditioning
- Interior features: Living room and dining room combo; Electric water heater; Other interior features
- Laundry & utility: Dedicated laundry room
Neighborhood map
What this means for you Summary
Snapshot
- This is a 3-bed/2.0-bath single-family listed at $358k.
Deal economics
- At list price, monthly cash flow is $-615 ($-7k/yr) — negative.
- To cash-flow at today's rent, offer at most $249k (30.3% below list).
- To meet the 1% rule (rent ≥ 1% of price), the offer needs to be $253k (29.3% below list).
- Recommended offer: $249k (30.3% below list) — sets the bar for cash-flow.
Location & tenants
- Location reads 70/100 on livability (#431 in FL) — a middle-class / working-renter tenant base. Strengths: crime A+, housing A, employment B+; Watch: amenities F, commute F, health & safety F.
- Sumter (rural): math 61% / reading 61% proficiency, ranked #11 of 73 in FL (top 15%) — acceptable for families but not a draw, mixed tenant base, ~2y average lease.
- Zoned schools: Wildwood Elementary School (math 49% / reading 52%, grade D+, #1,055 of 2,144 statewide, top 50%, 940 students, 76% FRL); South Sumter Middle School (math 55% / reading 54%, grade B-, #183 of 571 statewide, top 34%, 897 students, 61% FRL) — zoned schools average 68% FRL vs 51% district-wide (18 pts higher); higher-poverty schools than district average — tighter screening recommended.
- Market conditions: 269 active listings in the ZIP; 7 comparable units currently listed for rent nearby; rentals at typical pace (median 23d on market — plan ~3-4 weeks tenant-placement turnaround); solid renter incomes; 3,961 units permitted in Sumter County in 2024 (248 in 5+ unit buildings).
- This rent runs 31% of the median local income ($97k/yr) — at the standard rent-burdened threshold; future hikes will face affordability resistance.
Forward outlook
- In year one you build about $38k of equity ($2k loan paydown + $36k appreciation (10.0% local appreciation)).
- Sumter County population projected at +45% by 2050 — long-run rental-demand tailwind backs the buy-and-hold thesis.
- By year 2, paydown + projected appreciation supports a ~$62k cash-out refi (75% LTV) — recoverable capital for the next deal without selling this one.
Negotiation context
- It's been on market 17 days — a 2% lower offer ($353k) is reasonable based on typical stale-listing flexibility.
Risks & watch-outs
- Climate carrying-cost: severe wind risk, 99% chance of damaging wind over 30y; extreme-heat days projected 7→23/yr by 2055 (HVAC capex compounding) — expect insurance premiums to compound above CPI over the hold.
Questions for the listing agent
- What do current leases actually rent for vs. the listed asking? Can we see a recent rent roll and the last 12 months of T-12 income?
- What does the HOA fee cover, when was the last increase, and are there any pending special assessments or reserve-fund shortfalls?
- Is there a deadline driving the sale (1031 exchange, divorce, estate, relocation)? That informs how much negotiation room exists.
- Schools are A-rated — typically a magnet for longer-tenancy family renters. What's the average tenant stay here, and is there a school-zone premium baked into asking?
- The area grade is low — what's the realistic commute time and amenity access for the typical tenant pool here? Any planned neighborhood developments (good or bad) we should know about?
- What's the average days-on-market for RENTAL listings here right now (not sales)? A rising rental-DOM trend means longer vacancies and softer asking-rent achievability than the comps imply.
- What's the recent tenant-quality profile in this submarket — average credit score on applications, eviction rate, late-payment / NSF rate, and stable-employment percentage? A property-management company in the area should have these aggregated.
- How much new for-sale + rental construction is in the pipeline within 1–3 miles? Heavy new supply typically softens prices + rents 12–24 months out; constrained supply supports both.
Investment metrics
- 1% rule
- 0.71% ✗
- Cap rate
- 4.23%
- Cash-on-cash
- -7.36%
- DSCR
- 0.67
- GRM
- 11.8
CMA / ARV
- ARV (on-the-fly)
- $381,955
- Comps found
- 12
Show comp detail 12 sales within ~0.75 mi
| Address | Dist | Beds/Ba | Sqft | Sold | Price | $/sf | Match |
|---|---|---|---|---|---|---|---|
| 1106 Hollyhock Way | 0.13mi | 3/2.0 | 1,536 (-2%) | 1mo | $369,900 | $241 | 91 |
| 3207 Islawild Way | 0.51mi | 3/2.0 | 1,508 (-3%) | 5mo | $392,000 | $260 | 66 |
| 3630 Anvil Ave | 0.58mi | 3/2.0 | 1,589 (+2%) | 5mo | $375,000 | $236 | 66 |
| 3394 Ridgewood Path | 0.66mi | 3/2.0 | 1,559 (0%) | 5mo | $382,500 | $245 | 65 |
| 3632 Ukulele St | 0.59mi | 3/2.0 | 1,597 (+2%) | 5mo | $375,000 | $235 | 64 |
| 909 Abaco Path | 0.55mi | 3/2.0 | 1,488 (-5%) | 3mo | $373,000 | $251 | 64 |
| 3389 Lazy Acres Ln | 0.67mi | 3/2.0 | 1,611 (+3%) | 3mo | $429,000 | $266 | 60 |
| 852 Sapphire Pl | 0.50mi | 3/2.0 | 1,407 (-10%) | 3mo | $335,000 | $238 | 58 |
| 871 Amber Ct | 0.48mi | 3/2.0 | 1,357 (-13%) | 0mo | $334,900 | $247 | 56 |
| 935 Wren St | 0.53mi | 3/2.0 | 1,357 (-13%) | 1mo | $348,000 | $256 | 53 |
| 3448 Inverary Ave | 0.65mi | 3/2.0 | 1,392 (-11%) | 3mo | $330,000 | $237 | 50 |
| 3085 Baffie Ct | 0.71mi | 2/2.0 (-1) | 1,348 (-14%) | 1mo | $275,000 | $204 | 39 |
Match score weights: distance 35% · size 25% · config 20% · recency 20%. Top-matched comps best support the ARV.
Projected returns pro-forma
10.0% appreciation · 3.0% rent growth · sell at horizon
- IRR
- 19.1%
- Equity multiple
- 2.56×
- Total profit
- $155,929
- Equity at exit
- $322,515
- IRR
- 17.6%
- Equity multiple
- 5.89×
- Total profit
- $490,234
- Equity at exit
- $695,515
Cash invested: $100,240 (down + closing). Projections, not guarantees.
Landlord ↔ Tenant lean methodology
- Overall (STATE)
- 87 Strongly Landlord-Friendly
- State Florida
- 87 Strongly Landlord-Friendly · R+3
- County
- — inherits STATE
- City
- — inherits STATE
ZIP-level market 32163
- Home prices YoY
- 9.8%
- Active inventory
- 269
- Price-to-rent
- 11.8×
Monthly cashflow live
- Estimated rent
- $2,529 high interval (Pro) →
- Mortgage (P&I)
- −$1,877
- Tax from tax record
- −$253 /mo · $3,032/yr
- Insurance
- −$149
- HOA
- −$334
- Vacancy / Maint / Mgmt
- −$531
- Net cashflow
- $-615
Break-even live
Sensitivity live
| Price | -10% $-412 | -5% $-514 | +0% $-615 | +5% $-716 | +10% $-818 |
|---|---|---|---|---|---|
| Rent | -10% $-815 | -5% $-715 | +0% $-615 | +5% $-515 | +10% $-415 |
| Rate | -1.0pp $-435 | -0.5pp $-524 | base $-615 | +0.5pp $-708 | +1.0pp $-802 |
UW: 25.0% down · 7.5% · 30yr · 1.5% tax · 5.0% vac · 8.0% maint · 8.0% mgmt
Financing live
Cash to close
- Down payment
- $89,500
- Closing costs
- $10,740
- Reserves months
- —
- Total cash needed
- —
Loan-product check · same deal, 3 products live
Conventional
25% down · 7.5% · 30yr
- Down + closing
- —
- Monthly P&I
- —
- Monthly cashflow
- —
- DSCR
- —
- Eligible?
- —
Personal DTI + credit; lowest rate.
DSCR
20% down · 8.5% · 30yr
- Down + closing
- —
- Monthly P&I
- —
- Monthly cashflow
- —
- DSCR
- —
- Eligible?
- —
No personal income docs; deal must DSCR.
Hard money
10% down · 12.0% · 12mo
- Down + closing
- —
- Monthly P&I
- —
- Monthly cashflow
- —
- DSCR
- —
- Eligible?
- —
Short-term bridge; refi at stabilization.
Rent comps 7 comps
| Address | Beds | Baths | Sqft | Rent | $/sqft | DOM | Units | Dist |
|---|---|---|---|---|---|---|---|---|
| 3314 Abana Path Unit 1525266P The Villages, FL | 3.0 | 2.0 | 1571 | $1,770 | $1.13 | 23d | 1 | 0.03mi |
| 3068 Islawild Way The Villages, FL | 3.0 | 2.0 | 1542 | $2,200 | $1.43 | 23d | 1 | 0.50mi |
| 964 Wren St The Villages, FL | 2.0 | 2.0 | 1161 | $2,200 | $1.89 | 23d | 1 | 0.54mi |
| 3394 Ridgewood Path The Villages, FL | 3.0 | 2.0 | 1559 | $4,000 | $2.57 | 23d | 1 | 0.68mi |
| 2875 Rain Lily Loop The Villages, FL | 3.0 | 2.0 | 1965 | $4,490 | $2.28 | 23d | 1 | 0.75mi |
| 798 Journey Ln The Villages, FL | 3.0 | 2.0 | 1551 | $2,300 | $1.48 | 23d | 1 | 0.79mi |
| 1109 Alcove Loop The Villages, FL | 3.0 | 2.0 | 1970 | $3,000 | $1.52 | 23d | 1 | 1.15mi |
HOA detail
- Monthly dues
- $334 · $4,008/yr
Listing history 13 events
-
2026-06-22days on market $358,000 Active 17 DOM
-
2026-06-19days on market $358,000 Active 15 DOM
-
2026-06-18days on market $358,000 Active 14 DOM
-
2026-06-17days on market $358,000 Active 13 DOM
-
2026-06-16days on market $358,000 Active 12 DOM
-
2026-06-15days on market $358,000 Active 11 DOM
-
2026-06-14days on market $358,000 Active 9 DOM
-
2026-06-13days on market $358,000 Active 8 DOM
-
2026-06-10days on market $358,000 Active 6 DOM
-
2026-06-09days on market $358,000 Active 5 DOM
-
2026-06-08days on market $358,000 Active 4 DOM
-
2026-06-07remarks 480-char remark
-
2026-06-07$358,000 Active 3 DOM
ⓘ Source: listings_history table (triggers on properties + properties_extension) + one-shot
backfill from property_details.listing_events for pre-trigger history.
Tax reassessment forecast FL · Resets to sale price
- Current annual tax
- $3,032 · $253/mo
- Projected year-2 tax
- $3,032 · $253/mo
- Expected delta
- $0/yr ($0/mo · 0.0%)
ⓘ Screening estimate from a state-policy table — verify with the county assessor before closing.
Climate risk First Street
- Flood 1/10 Low FEMA zone X (unshaded) · 0% chance over 30 yrs
- Wildfire 3/10 Moderate
- Heat 9/10 Extreme 7 d/yr ≥108°F today · 23 d/yr by 30 yrs out
- Wind 9/10 Extreme 99% chance of damaging wind over 30 yrs
- Air quality 3/10 Moderate 2 unhealthy d/yr today · 3 by 30 yrs out
Nearby sold comps map
Loading sold comps map…
Walkable amenities ~0.75 mi
Loading nearby amenities…
Taxation est. · year 1
- Rental income
- $30,352
- − Mortgage interest
- −$20,054
- − Property taxes
- −$3,032
- − Insurance
- −$1,790
- − Repairs & maintenance
- −$2,428
- − Management
- −$2,428
- − HOA
- −$4,008
- − Depreciation
- −$10,415
- Taxable loss
- −$13,802
- Est. tax savings @ 24.0%
- +$3,313
- After-tax cash flow
- $-4,068/yr
For passive investors: Depreciation is non-cash, so a rental often shows a tax loss while cash-flowing — sheltering income. Rental losses are passive: they offset passive income freely, and up to $25,000/yr can offset ordinary (W-2) income if you actively participate and your MAGI is under $100k (phasing out to $0 by $150k); unused losses carry forward. On sale, claimed depreciation is recaptured at up to 25%, and gains may owe capital-gains tax (a 1031 exchange can defer both). Figures are a year-1 estimate at your 24.0% rate — not tax advice; consult a CPA.
Schools (NCES district)
- District
- Sumter
- NCES district ID
- 1201800
- Math proficiency
- 61% ▼ -4.00%
- Reading proficiency
- 61% ▼ -2.00%
- Median HH income
- $48,240
- Composite
- 51.74/100
- National rank
- #1682
- State rank
- #11 of 73 in FL
Livability — The Villages
- Score
- 70/100
- State rank
- #431
- US rank
- #7363
Category grades
Schools grade is shown separately in the Schools card above.
Census & demographics
- Census place
- The Villages, FL
- County
- Sumter County · 110,591 people
- City population
- 83,973
- Metro
- The Villages, FL
- Population (ZIP)
- 28,549
- Household income
- $96,775
- Rent vs Own
- Severe rent burden
- 307.0
Population outlook (Sumter County) Hauer SSP2
- Today (2025)
- 161,172 people
- By 2030
- 180,083 · +11.7%
- By 2040
- 209,892 · +30.2%
- By 2050
- 234,186 · +45.3%
- By 2075
- 284,602 · +76.6%
- By 2100
- 317,039 · +96.7%
Race, ethnicity, and origin ACS 2023
- Neighborhood character
- Predominantly White (95%)
- Race & ethnicity
- White 95% Two or more races 2% Hispanic / Latino 2% Asian 1%
- Common ancestry
- Romanian 6% Lithuanian 3% Iranian 3%
- Foreign-born
- 6% · Canada, Vietnam
- Languages at home
- 96% English-only · Spanish 2% Vietnamese 1% Other Indo-European 0%
Political lean MEDSL · Sumter
- 2024 margin
- Solid R (+37.6) · D 30.9% · R 68.6%
- 2008→2024 swing
- -10.6pp toward R · 2008: -27.0pp · 2024: -37.6pp
- All cycles
- 2024: R+37.6 2020: R+36.1 2016: R+39.2 2012: R+34.9 2008: R+27.0
Not yet ingested
- Civics
- —
Market trends
- HPI YoY
- ▲ 20.47%
- Current HPI
- 229.0075
- Rent YoY
- —
- Metro
- The Villages, FL
- State GDP YoY
- ▲ 3.28%
- F500 in state
- 36
Industry mix (Fortune 500 HQ in FL)
| Industry | F500 HQs | Revenue |
|---|---|---|
| Industrial Technology | 2 | $29B |
|
||
| Insurance | 2 | $17B |
|
||
| Retail | 1 | $60B |
|
||
| Technology Distribution | 1 | $58B |
|
||
| Homebuilding | 1 | $35B |
|
||
| Technology Manufacturing | 1 | $35B |
|
||
Price history
1 event — show timeline
- 2026-06-04 Listed $358,000 Stellar MLS as Distributed by MLS Grid
Property tax history
+2.4%/yrLatest (2025): $3,032 · +0.6% YoY. Source: county tax records.
Cash-flow waterfall
monthlySold comps — $/sqft
last 12 mo · ≤1 miLoading sold comps…