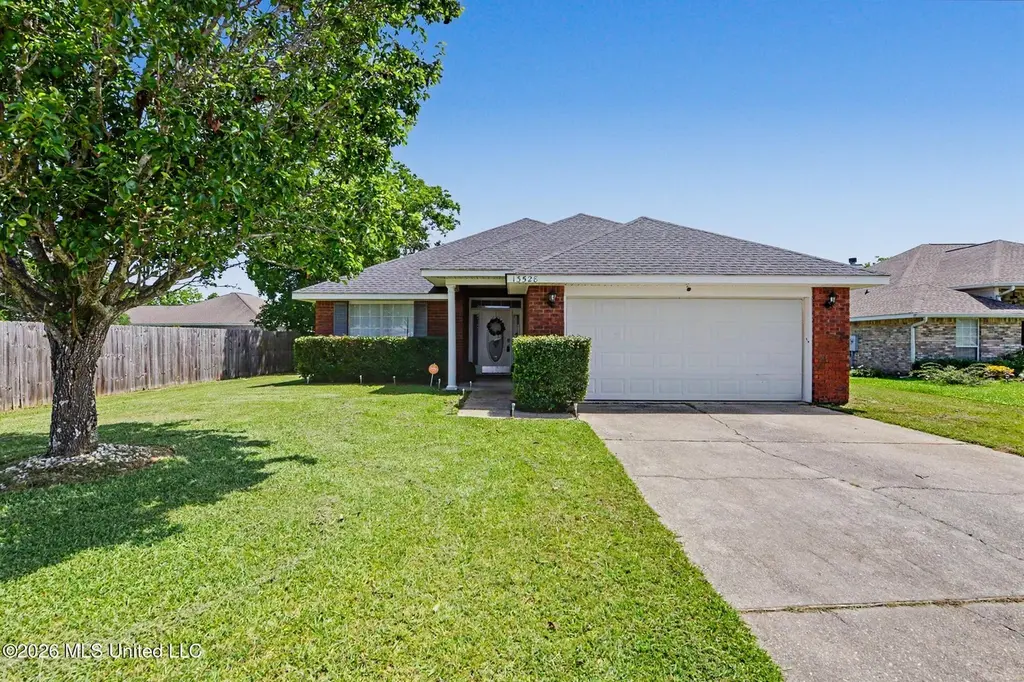
13528 Windrose Cir · Gulfport, MS
Flood risk 1/10 · Minimal
- FEMA flood zone
- X (unshaded)
- Chance of flooding over 30 yrs
- 0.0%
- Est. flood insurance / yr
- $507 – $1,088
Fire risk 3/10 · Minor
- Est. fire insurance / yr
- $1,241 – $2,305
Heat risk 10/10 · Severe
- Hot days now (above 107°F)
- 7 days/yr
- Hot days in 30 yrs
- 23 days/yr
Wind risk 9/10 · Severe
- Chance of severe wind over 30 yrs
- 99.0%
Air-quality risk 1/10 · Minimal
- Unhealthy air days now
- 0 days/yr
- Unhealthy air days in 30 yrs
- 0 days/yr
Risk factors via First Street. Map © Google.
Why this score? — see what drove the C- grade
The composite is a weighted blend of 9 inputs, each scored 0–100. Each bar is that input's sub-score; the figure is the points it added to the 100-point composite (weight × sub-score).
- Cash flow +17.7/30.0
- ARV discount +11.3/15.0
- DSCR +5.5/10.0
- Rent growth +4.2/5.0
- Schools +4.2/10.0
- 1% rule +4.0/10.0
- Livability +3.7/5.0
- Condition / age +2.5/5.0
- Appreciation +0.0/10.0
$240,000
🖨 Deal sheet 📄 Offer letter ✓ Due diligence
Listing remarks MLS
High ceilings, a spacious open floor plan, and split master in this 4 Bedroom brick home in Wind Rose Subdivision, all situated on approximately 1/2 acre lot. Amenities for the subdivision include a community pool, and the location is just minutes from shopping, schools and entertainment. Tenant occupied, 24 hr notice required to show.
Key facts
- Pond
- Vaulted ceiling
- Open living area
Tags
Property features AI
Finance
- HOA & community: Has association; annual fee of $275 (includes grounds maintenance and pool service); Community amenities: clubhouse, lake, pool, sidewalks, street lights, near entertainment
Exterior
- Parking: Attached 2-car garage; Driveway; Garage door opener; Garage faces front; Direct garage access; Concrete driveway
- Security: Smoke detectors
- Utilities: Public water; Public sewer; Electricity connected; Water connected; Sewer connected
- Home design: Single family residence (house); One level; Move-in ready
- Construction: Brick / brick veneer exterior; Architectural shingle roof; Slab foundation; Built per public records
- Exterior features: Front porch; Private yard; Back yard fencing (wood privacy fence)
Interior
- Kitchen: Dishwasher; Disposal; Free‑standing electric range; Microwave; Refrigerator; Stainless steel appliances; Electric water heater
- Flooring: Luxury vinyl; Ceramic tile
- Bathrooms: 2 full bathrooms
- Heating & cooling: Central heating (electric); Fireplace heating; Central air (electric); Ceiling fans
- Interior features: Breakfast bar; Ceiling fans; Double vanity; Eat-in kitchen; Entrance foyer; High ceilings; Laminate counters; Pantry; Recessed lighting; Vaulted ceilings; Blinds on windows; Dead bolt locks; French doors; Metal insulated door(s); Storm door(s); Has fireplace (located in the den)
- Laundry & utility: Laundry room; Electric dryer hookup; Water heater
Neighborhood map
What this means for you Summary
Snapshot
- This is a 4-bed/1.0-bath single-family listed at $240k.
Deal economics
- At list price, monthly cash flow is $191 ($2k/yr) — positive.
- The deal already cash-flows at list — no discount required.
- To meet the 1% rule (rent ≥ 1% of price), the offer needs to be $217k (9.7% below list).
- Recommended offer: $217k (9.7% below list) — sets the bar for 1% rule.
- Cap rate 7.2% vs local median 4.9% in Gulfport — top-decile yield for the area; either an underpriced asset or a hidden risk that comps aren't pricing in. Stress-test before assuming the spread holds.
Location & tenants
- Location reads 73/100 on livability (#15 in MS) — a middle-class / working-renter tenant base. Strengths: cost of living A+, housing A+, health & safety A+; Watch: amenities F, commute F, employment F.
- Harrison County School District (rural): math 52% / reading 46% proficiency, ranked #14 of 130 in MS (top 11%) — families likely to look elsewhere, expect single-tenant / working-renter base with shorter leases; 62% free/reduced lunch — lower-income household profile, screen leases tightly.
- Zoned schools: Three Rivers Elementary (math 37% / reading 46%, grade F, #113 of 375 statewide, top 31%, 498 students, 99% FRL); Harrison Central High School (math 38% / reading 38%, grade F, #58 of 197 statewide, top 29%, 1,486 students, 100% FRL) — zoned schools average 100% FRL vs 62% district-wide (37 pts higher); higher-poverty schools than district average — tighter screening recommended.
- Market conditions: Rents rising fast (+7.0%/yr); 763 active listings in the ZIP; 7 comparable units currently listed for rent nearby; rentals lingering (median 44d on market — plan ~5-8 weeks vacancy on turnover, expect pricing pressure); 71% of comp listings sitting > 30 days — soft ceiling on asking rent; 2,194 units permitted in Harrison County in 2024 (0 in 5+ unit buildings).
- This rent runs 42% of the median local income ($63k/yr) — at the standard rent-burdened threshold; future hikes will face affordability resistance.
Forward outlook
- Local home prices are declining (-3.0%/yr); year-one equity from $2k of loan paydown is wiped out by about $7k of value loss. Plan a longer hold.
- Harrison County population projected at +27% by 2050 — long-run rental-demand tailwind backs the buy-and-hold thesis.
Negotiation context
- Only 4 days on market — expect competitive offers; lowballing is unlikely to land.
- 2 sale attempts since 8y ago with the ask held roughly flat each time — persistent listings suggest the price (not the market) is what's stuck; bring a comps-based counter.
- Current owner paid $153k; list at $240k implies a 57% gain — meaningful room to come down on a strong offer.
Risks & watch-outs
- Climate carrying-cost: severe wind risk, 99% chance of damaging wind over 30y; extreme-heat days projected 7→23/yr by 2055 (HVAC capex compounding) — expect insurance premiums to compound above CPI over the hold.
Questions for the listing agent
- What does the HOA fee cover, when was the last increase, and are there any pending special assessments or reserve-fund shortfalls?
- Is there a deadline driving the sale (1031 exchange, divorce, estate, relocation)? That informs how much negotiation room exists.
- Schools are D-rated, which usually means shorter tenancies and higher turnover. Who's the typical renter profile here, and what's been the actual vacancy rate?
- What's the average days-on-market for RENTAL listings here right now (not sales)? A rising rental-DOM trend means longer vacancies and softer asking-rent achievability than the comps imply.
- What's the recent tenant-quality profile in this submarket — average credit score on applications, eviction rate, late-payment / NSF rate, and stable-employment percentage? A property-management company in the area should have these aggregated.
- How much new for-sale + rental construction is in the pipeline within 1–3 miles? Heavy new supply typically softens prices + rents 12–24 months out; constrained supply supports both.
Investment metrics
- 1% rule
- 0.90% ✗
- Cap rate
- 7.25%
- Cash-on-cash
- 3.42%
- DSCR
- 1.15
- GRM
- 9.2
CMA / ARV
- ARV (on-the-fly)
- $261,924
- Comps found
- 12
Show comp detail 12 sales within ~0.75 mi
| Address | Dist | Beds/Ba | Sqft | Sold | Price | $/sf | Match |
|---|---|---|---|---|---|---|---|
| 15205 Westin Cv | 0.28mi | 4/2.0 | 1,852 (-2%) | 6mo | $255,000 | $138 | 74 |
| 13367 Greenwich Cv | 0.28mi | 4/2.0 | 1,800 (-5%) | 3mo | $240,000 | $133 | 72 |
| 14402 Autumn Chase | 0.32mi | 4/2.0 | 1,867 (-2%) | 12mo | $239,900 | $128 | 68 |
| 13360 Greenwich Cv | 0.26mi | 3/2.0 (-1) | 1,809 (-5%) | 6mo | $257,500 | $142 | 66 |
| 13288 Roxbury Pl | 0.20mi | 4/2.0 | 2,150 (+13%) | 1mo | $299,800 | $139 | 63 |
| 14071 Duckworth Rd | 0.47mi | 3/2.0 (-1) | 1,892 (-0%) | 7mo | $264,777 | $140 | 62 |
| 13071 Woodbridge Ct | 0.25mi | 4/2.0 | 1,755 (-8%) | 12mo | $325,000 | $185 | 61 |
| 14277 Mosswood Dr | 0.33mi | 4/2.0 | 1,750 (-8%) | 8mo | $235,000 | $134 | 61 |
| 13355 Roxbury Pl | 0.33mi | 3/2.0 (-1) | 1,667 (-12%) | 5mo | $199,000 | $119 | 51 |
| 14159 Lucky Mays Rd | 0.68mi | 3/2.0 (-1) | 1,856 (-2%) | 8mo | $237,458 | $128 | 49 |
| 13029 Windcrest Ln | 0.35mi | 3/2.0 (-1) | 1,641 (-14%) | 7mo | $230,000 | $140 | 46 |
| 12399 Simpson Rd | 0.68mi | 4/2.0 | 1,668 (-12%) | 11mo | $204,900 | $123 | 35 |
Match score weights: distance 35% · size 25% · config 20% · recency 20%. Top-matched comps best support the ARV.
Projected returns pro-forma
-3.0% appreciation · 6.99% rent growth · sell at horizon
- IRR
- -6.9%
- Equity multiple
- 0.74×
- Total profit
- $-17,705
- Equity at exit
- $35,785
- IRR
- 6.9%
- Equity multiple
- 1.60×
- Total profit
- $40,380
- Equity at exit
- $20,751
Cash invested: $67,200 (down + closing). Projections, not guarantees.
Landlord ↔ Tenant lean methodology
- Overall (STATE)
- 90 Strongly Landlord-Friendly
- State Mississippi
- 90 Strongly Landlord-Friendly · R+11
- County
- — inherits STATE
- City
- — inherits STATE
ZIP-level market 39503
- Home prices YoY
- -21.5%
- Rents YoY
- 7.0%
- Active inventory
- 763
- Price-to-rent
- 9.2×
Monthly cashflow live
- Estimated rent
- $2,167 high interval (Pro) →
- Mortgage (P&I)
- −$1,259
- Tax from tax record
- −$139 /mo · $1,665/yr
- Insurance
- −$100
- HOA
- −$23
- Vacancy / Maint / Mgmt
- −$455
- Net cashflow
- $191
Break-even live
UW: 25.0% down · 7.5% · 30yr · 1.5% tax · 5.0% vac · 8.0% maint · 8.0% mgmt
Financing live
Cash to close
- Down payment
- $60,000
- Closing costs
- $7,200
- Reserves months
- —
- Total cash needed
- —
Loan-product check · same deal, 3 products live
Conventional
25% down · 7.5% · 30yr
- Down + closing
- —
- Monthly P&I
- —
- Monthly cashflow
- —
- DSCR
- —
- Eligible?
- —
Personal DTI + credit; lowest rate.
DSCR
20% down · 8.5% · 30yr
- Down + closing
- —
- Monthly P&I
- —
- Monthly cashflow
- —
- DSCR
- —
- Eligible?
- —
No personal income docs; deal must DSCR.
Hard money
10% down · 12.0% · 12mo
- Down + closing
- —
- Monthly P&I
- —
- Monthly cashflow
- —
- DSCR
- —
- Eligible?
- —
Short-term bridge; refi at stabilization.
Rent comps 7 comps
| Address | Beds | Baths | Sqft | Rent | $/sqft | DOM | Units | Dist |
|---|---|---|---|---|---|---|---|---|
| 14347 Atwood Cv Gulfport, MS | 4.0 | 2.0 | 2133 | $2,175 | $1.02 | 43d | 1 | 0.27mi |
| 14348 Atwood Cv Gulfport, MS | 3.0 | 2.0 | 2145 | $2,150 | $1.00 | 43d | 1 | 0.29mi |
| 14160 Maple Ct Gulfport, MS | 4.0 | 2.0 | 1950 | $1,895 | $0.97 | 43d | 1 | 0.40mi |
| 15334 Oak Creek Cv Gulfport, MS | 4.0 | 2.0 | 1730 | $2,149 | $1.24 | 20d | 1 | 0.43mi |
| 13518 Huntington Cir Gulfport, MS | 4.0 | 2.0 | 2084 | $1,950 | $0.94 | 43d | 1 | 0.71mi |
| 13727 Fox Hill Dr Gulfport, MS | 3.0 | 2.0 | 1388 | $1,800 | $1.30 | 43d | 1 | 0.87mi |
| 125 Clarence Dr Gulfport, MS | 3.0 | 2.0 | 1300 | $1,500 | $1.15 | 13d | 1 | 1.42mi |
HOA detail
- Monthly dues
- $23 · $276/yr
- Likely covers
- pool
Listing history 6 events
-
2026-06-07pricestatusdays on market $240,000 Pending 4 DOM
-
2026-06-03remarks 595-char remark
-
2026-06-02days on market $234,900 Active 3 DOM
-
2026-06-01days on market $234,900 Active 2 DOM
-
2026-05-31remarks 545-char remark
-
2026-05-31$234,900 Active 1 DOM
ⓘ Source: listings_history table (triggers on properties + properties_extension) + one-shot
backfill from property_details.listing_events for pre-trigger history.
Tax reassessment forecast MS · Resets to sale price
- Current annual tax
- $1,665 · $139/mo
- Projected year-2 tax
- $1,896 · $158/mo
- Expected delta
- +$231/yr (+$19/mo · 13.9%)
ⓘ Screening estimate from a state-policy table — verify with the county assessor before closing.
Climate risk First Street
- Flood 1/10 Low FEMA zone X (unshaded) · 0% chance over 30 yrs
- Wildfire 3/10 Moderate
- Heat 10/10 Extreme 7 d/yr ≥107°F today · 23 d/yr by 30 yrs out
- Wind 9/10 Extreme 99% chance of damaging wind over 30 yrs
- Air quality 1/10 Low 0 unhealthy d/yr today · 0 by 30 yrs out
Nearby sold comps map
Loading sold comps map…
Walkable amenities ~0.75 mi
Loading nearby amenities…
Taxation est. · year 1
- Rental income
- $26,001
- − Mortgage interest
- −$13,444
- − Property taxes
- −$1,665
- − Insurance
- −$1,200
- − Repairs & maintenance
- −$2,080
- − Management
- −$2,080
- − HOA
- −$276
- − Depreciation
- −$6,982
- Taxable loss
- −$1,726
- Est. tax savings @ 24.0%
- +$414
- After-tax cash flow
- $2,711/yr
For passive investors: Depreciation is non-cash, so a rental often shows a tax loss while cash-flowing — sheltering income. Rental losses are passive: they offset passive income freely, and up to $25,000/yr can offset ordinary (W-2) income if you actively participate and your MAGI is under $100k (phasing out to $0 by $150k); unused losses carry forward. On sale, claimed depreciation is recaptured at up to 25%, and gains may owe capital-gains tax (a 1031 exchange can defer both). Figures are a year-1 estimate at your 24.0% rate — not tax advice; consult a CPA.
Schools (NCES district)
- District
- Harrison County School District
- NCES district ID
- 2801770
- Math proficiency
- 52% ▼ -4.00%
- Reading proficiency
- 46% ▼ -4.00%
- Median HH income
- $46,504
- Composite
- 41.66/100
- National rank
- #3419
- State rank
- #14 of 130 in MS
Livability — Gulfport
- Score
- 73/100
- State rank
- #15
- US rank
- #5010
Category grades
Schools grade is shown separately in the Schools card above.
Census & demographics
- Census place
- Gulfport, MS
- County
- Harrison County · 178,171 people
- City population
- 96,188
- Metro
- Gulfport-Biloxi, MS
- Population (ZIP)
- 55,059
- Household income
- $62,641
- Rent vs Own
- Severe rent burden
- 1686.0
Population outlook (Harrison County) Hauer SSP2
- Today (2025)
- 228,444 people
- By 2030
- 241,942 · +5.9%
- By 2040
- 267,531 · +17.1%
- By 2050
- 291,062 · +27.4%
- By 2075
- 346,711 · +51.8%
- By 2100
- 378,165 · +65.5%
Race, ethnicity, and origin ACS 2023
- Neighborhood character
- Diverse neighborhood (Simpson 0.58)
- Race & ethnicity
- White 58% Black 27% Two or more races 9% Hispanic / Latino 6% Asian 2%
- Hispanic origin (detail)
- Mexican 2% Puerto Rican 1%
- Common ancestry
- Lithuanian 5% Slovak 1% Portuguese 1%
- Foreign-born
- 3% · Canada
- Languages at home
- 95% English-only · Spanish 3%
Political lean MEDSL · Harrison
- 2024 margin
- Strong R (+28.9) · D 35.0% · R 63.9% · Other 1.1%
- 2008→2024 swing
- -2.9pp toward R · 2008: -26.0pp · 2024: -28.9pp
- All cycles
- 2024: R+28.9 2020: R+25.2 2016: R+30.7 2012: R+26.6 2008: R+26.0
Not yet ingested
- Civics
- —
Market trends
- HPI YoY
- ▼ -51.39%
- Current HPI
- 187.285
- Rent YoY
- ▲ 6.99%
- Metro
- Gulfport-Biloxi, MS
- State GDP YoY
- —
- F500 in state
- 0
Price history
+53.6% since first listed4 events — show timeline
- 2026-05-30 Listed $234,900 MLSU
- 2018-07-30 Sold (Public Records) $152,900 Public Records
- 2018-07-27 Sold (MLS) — MLSU
- 2018-03-23 Listed $152,900 MLSU
Property tax history
-6.1%/yrLatest (2025): $1,665 · +5.0% YoY. Source: county tax records.
Cash-flow waterfall
monthlySold comps — $/sqft
last 12 mo · ≤1 miLoading sold comps…