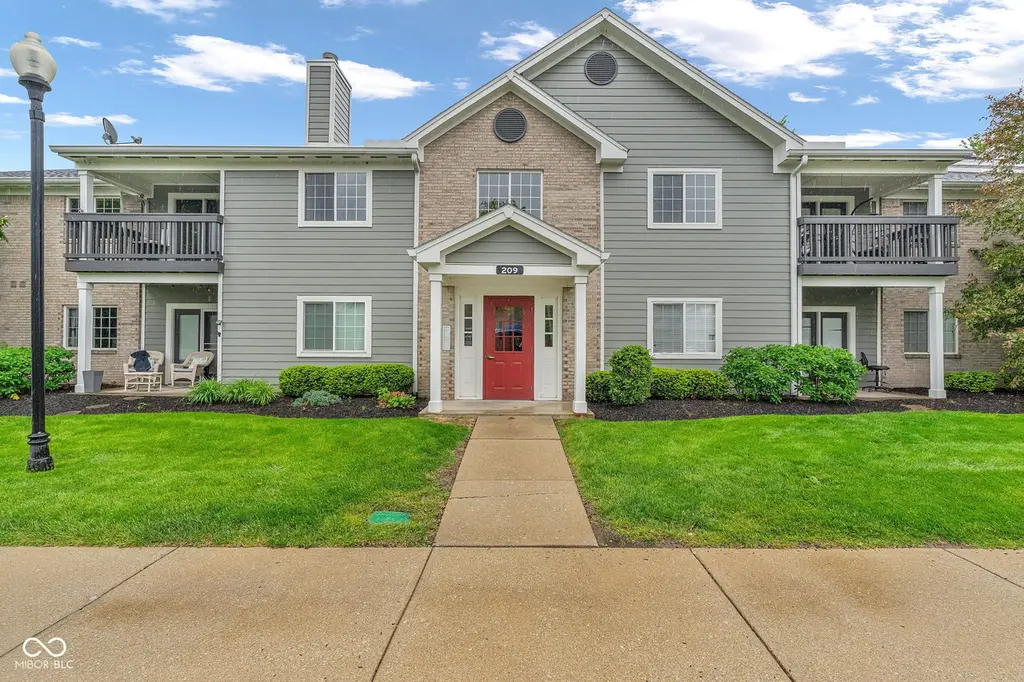
209 Faulkner Ct #205 · Carmel, IN
Flood risk 1/10 · Minimal
- FEMA flood zone
- X (unshaded)
- Chance of flooding over 30 yrs
- 0.0%
- Est. flood insurance / yr
- $507 – $1,088
Fire risk 1/10 · Minimal
- Est. fire insurance / yr
- $717 – $1,331
Heat risk 3/10 · Minor
- Hot days now (above 101°F)
- 6 days/yr
- Hot days in 30 yrs
- 16 days/yr
Wind risk 2/10 · Minimal
- Chance of severe wind over 30 yrs
- 0.0%
Air-quality risk 4/10 · Minor
- Unhealthy air days now
- 3 days/yr
- Unhealthy air days in 30 yrs
- 6 days/yr
Risk factors via First Street. Map © Google.
Why this score? — see what drove the D- grade
The composite is a weighted blend of 9 inputs, each scored 0–100. Each bar is that input's sub-score; the figure is the points it added to the 100-point composite (weight × sub-score).
- Cash flow +10.3/30.0
- Schools +6.4/10.0
- 1% rule +5.0/10.0
- Livability +4.2/5.0
- Rent growth +4.1/5.0
- ARV discount +3.7/15.0
- DSCR +2.9/10.0
- Condition / age +2.5/5.0
- Appreciation +0.0/10.0
$250,000
🖨 Deal sheet 📄 Offer letter ✓ Due diligence
Listing remarks MLS
Exceptionally nice home! You will fall in love with this home from the moment you walk in! One of the largest units in complex! Cathedral Ceilings. Updates include: Cabinetry, Center Island, Breakfast bar, carpeting & h ardwoods...Nice! Gas fireplace. Attached garage (#39). All (Top of the line)appliances stay.
Key facts
- Two sinks
- Walk-in shower
- Kitchen island
Tags
Property features AI
Finance
- Other: Ownership interest: mandatory fee; Lot size approximately 0.15 acres
- HOA & community: Monthly HOA fee of $339; HOA includes sewer, insurance, lawn care, structure maintenance, general maintenance, management, security, snow removal, trash, irrigation, entrance common upkeep, and laundry connection in unit; Association amenities: insurance, coin laundry, laundry, maintenance, management, security, snow removal, trash; HOA disclosures include covenants & restrictions, rental restrictions, rules & regulations, and transfer fee
Exterior
- Parking: Detached garage with one garage space; Garage door opener
- Security: Community security (HOA-provided)
- Utilities: Public water; Municipal sewer; Natural gas connected; Cable available
- Home design: Residential condominium; Attached property with one common wall; Ground-level (horizontal) unit; One story
- Construction: Brick and wood siding exterior; Slab foundation
- Exterior features: Covered patio/porch; Small trees on lot
Interior
- Kitchen: Electric oven; Microwave; Dishwasher; Garbage disposal; Refrigerator
- Bedrooms: 2 bedrooms on the main level; Primary bedroom with walk-in closet
- Bathrooms: 2 full bathrooms; Primary bathroom suite with full tub and shower
- Heating & cooling: Forced air heating (natural gas); Central air conditioning
- Interior features: Breakfast bar; Cathedral ceilings; Pantry; Walk-in closet(s); Laundry in unit; Smoke alarm
- Laundry & utility: Laundry in unit
Neighborhood map
What this means for you Summary
Snapshot
- This is a 4-bed/2.0-bath condo listed at $250k.
Deal economics
- At list price, monthly cash flow is $-139 ($-2k/yr) — negative.
- To cash-flow at today's rent, offer at most $225k (9.8% below list).
- Meets the 1% rule at list price ($3k rent vs $250k).
- Recommended offer: $225k (9.8% below list) — sets the bar for cash-flow.
- Cap rate 5.6% vs local median 2.7% in Carmel — top-decile yield for the area; either an underpriced asset or a hidden risk that comps aren't pricing in. Stress-test before assuming the spread holds.
Location & tenants
- Location reads 84/100 on livability (#7 in IN, #726 nationally) — a professional / high-income tenant draw. Strengths: schools A+, crime A+, amenities A+; Watch: commute F.
- Carmel Clay Schools (urban): math 68% / reading 70% proficiency, ranked #1 of 301 in IN (top 0%) — acceptable for families but not a draw, mixed tenant base, ~2y average lease; only 7% free/reduced lunch — higher-income household profile.
- Market conditions: Rents rising fast (+6.5%/yr); 340 active listings in the ZIP; 6 comparable units currently listed for rent nearby; rentals leasing fast (median 11d on market — plan ~1-2 weeks tenant-placement turnaround); high-income renter base; 4,661 units permitted in Hamilton County in 2024 (1,528 in 5+ unit buildings).
Forward outlook
- Local home prices are declining (-3.0%/yr); year-one equity from $2k of loan paydown is wiped out by about $8k of value loss. Plan a longer hold.
- Hamilton County population projected at +44% by 2050 — long-run rental-demand tailwind backs the buy-and-hold thesis.
Negotiation context
- It's been on market 41 days — a 3% lower offer ($242k) is reasonable based on typical stale-listing flexibility.
- 4 sale attempts since 24y ago with the ask held roughly flat each time — persistent listings suggest the price (not the market) is what's stuck; bring a comps-based counter.
- Current owner paid $122k; list at $250k implies a 105% gain — meaningful room to come down on a strong offer.
Questions for the listing agent
- What do current leases actually rent for vs. the listed asking? Can we see a recent rent roll and the last 12 months of T-12 income?
- It's been on market 41 days. Have you received any prior offers? Is the seller open to a 10% concession, seller financing, or rate buy-down credit?
- What does the HOA fee cover, when was the last increase, and are there any pending special assessments or reserve-fund shortfalls?
- Any open or pending special assessments — roof, HVAC, plumbing, elevator, façade? What's the per-unit balance and payoff schedule, and is the seller paying it off at close or rolling it to the buyer?
- Is there a deadline driving the sale (1031 exchange, divorce, estate, relocation)? That informs how much negotiation room exists.
- Schools are A-rated — typically a magnet for longer-tenancy family renters. What's the average tenant stay here, and is there a school-zone premium baked into asking?
- The area grade is low — what's the realistic commute time and amenity access for the typical tenant pool here? Any planned neighborhood developments (good or bad) we should know about?
- What's the average days-on-market for RENTAL listings here right now (not sales)? A rising rental-DOM trend means longer vacancies and softer asking-rent achievability than the comps imply.
- What's the recent tenant-quality profile in this submarket — average credit score on applications, eviction rate, late-payment / NSF rate, and stable-employment percentage? A property-management company in the area should have these aggregated.
- How much new apartment / multifamily construction is in the pipeline within 1–3 miles? Heavy new supply (>2% of stock underway) typically softens rents 12–24 months out; light construction supports rent growth.
Investment metrics
- 1% rule
- 1.00% ✓
- Cap rate
- 5.62%
- Cash-on-cash
- -2.39%
- DSCR
- 0.89
- GRM
- 8.3
CMA / ARV
- ARV (median comp)
- $230,586
- List price
- $250,000
- Delta
- 8.42%
- Verdict
- FAIR
- Comps
- 20 within 1.0 mi
Projected returns pro-forma
-3.0% appreciation · 6.47% rent growth · sell at horizon
- IRR
- -15.5%
- Equity multiple
- 0.43×
- Total profit
- $-40,064
- Equity at exit
- $37,276
- IRR
- -0.9%
- Equity multiple
- 0.92×
- Total profit
- $-5,332
- Equity at exit
- $21,615
Cash invested: $70,000 (down + closing). Projections, not guarantees.
Landlord ↔ Tenant lean methodology
- Overall (STATE)
- 90 Strongly Landlord-Friendly
- State Indiana
- 90 Strongly Landlord-Friendly · R+11
- County
- — inherits STATE
- City
- — inherits STATE
ZIP-level market 46032
- Rents YoY
- 6.5%
- Active inventory
- 340
- Price-to-rent
- 8.3×
Monthly cashflow live
- Estimated rent
- $2,503 high interval (Pro) →
- Mortgage (P&I)
- −$1,311
- Tax from tax record
- −$363 /mo · $4,352/yr
- Insurance
- −$104
- HOA
- −$339
- Vacancy / Maint / Mgmt
- −$526
- Net cashflow
- $-139
Break-even live
UW: 25.0% down · 7.5% · 30yr · 1.5% tax · 5.0% vac · 8.0% maint · 8.0% mgmt
Financing live
Cash to close
- Down payment
- $62,500
- Closing costs
- $7,500
- Reserves months
- —
- Total cash needed
- —
Loan-product check · same deal, 3 products live
Conventional
25% down · 7.5% · 30yr
- Down + closing
- —
- Monthly P&I
- —
- Monthly cashflow
- —
- DSCR
- —
- Eligible?
- —
Personal DTI + credit; lowest rate.
DSCR
20% down · 8.5% · 30yr
- Down + closing
- —
- Monthly P&I
- —
- Monthly cashflow
- —
- DSCR
- —
- Eligible?
- —
No personal income docs; deal must DSCR.
Hard money
10% down · 12.0% · 12mo
- Down + closing
- —
- Monthly P&I
- —
- Monthly cashflow
- —
- DSCR
- —
- Eligible?
- —
Short-term bridge; refi at stabilization.
Rent comps 6 comps
| Address | Beds | Baths | Sqft | Rent | $/sqft | DOM | Units | Dist |
|---|---|---|---|---|---|---|---|---|
| 12484 Breaklines St Carmel, IN | 1.0–3.0 | 1.0–2.0 | 1045 | $2,044 | $1.96 | 1d | 19 | 1.17mi |
| 1059 Timber Creek Dr Carmel, IN | 3.0 | 2.0 | 1379 | $1,850 | $1.34 | 43d | 1 | 1.21mi |
| 20 Wilson Dr Carmel, IN | 3.0 | 2.5 | 1728 | $3,000 | $1.74 | 10d | 1 | 1.22mi |
| 11405 Central Dr W Carmel, IN | 4.0 | 2.0 | 1408 | $2,600 | $1.85 | 1d | 1 | 1.26mi |
| 12656 Crescent Dr Carmel, IN | 3.0 | 2.5 | 1711 | $2,290 | $1.34 | 43d | 1 | 1.37mi |
| 11325 Spring Mill Rd Carmel, IN | 1.0–3.0 | 1.0–2.0 | 1043 | $2,903 | $2.78 | 1d | 23 | 1.43mi |
HOA detail condo
- Monthly dues
- $339 · $4,068/yr
- Likely covers
- gas
- Assessments
- None detected in remarks — confirm with the listing agent.
Listing history 21 events
-
2026-06-18days on market $250,000 Active 41 DOM
-
2026-06-17days on market $250,000 Active 40 DOM
-
2026-06-16days on market $250,000 Active 39 DOM
-
2026-06-15days on market $250,000 Active 38 DOM
-
2026-06-13days on market $250,000 Active 36 DOM
-
2026-06-13days on market $250,000 Active 35 DOM
-
2026-06-09days on market $250,000 Active 32 DOM
-
2026-06-08days on market $250,000 Active 31 DOM
-
2026-06-07days on market $250,000 Active 30 DOM
-
2026-06-05days on market $250,000 Active 27 DOM
-
2026-06-03days on market $250,000 Active 26 DOM
-
2026-06-02days on market $250,000 Active 25 DOM
-
2026-06-01days on market $250,000 Active 24 DOM
-
2026-05-31days on market $250,000 Active 23 DOM
-
2026-05-08$250,000 Active 847-char remark
-
2007-06-07soldstatus $122,000 316-char remark
Show marketing remark (316 chars)
Exceptionally nice home! You will fall in love with this home from the moment you walk in! One of the largest units in complex! Cathedral Ceilings. Updates include: Cabinetry, Center Island, Breakfast bar, carpeting & h ardwoods...Nice! Gas fireplace. Attached garage (#39). All (Top of the line)appliances stay.
-
2007-02-01$128,500 316-char remark
Show marketing remark (316 chars)
Exceptionally nice home! You will fall in love with this home from the moment you walk in! One of the largest units in complex! Cathedral Ceilings. Updates include: Cabinetry, Center Island, Breakfast bar, carpeting & h ardwoods...Nice! Gas fireplace. Attached garage (#39). All (Top of the line)appliances stay.
-
2006-06-30soldstatus $117,500
Show marketing remark (471 chars)
Simply the best! End condo is one of a kind w/added sq footage* Pleasently neutral color decor, cath ceilings add an open spacious feel* Beautifully built w/upgrades galore: cabinetry, center isle, brkfst bar, carpet & padding, hardwood flooring, ceiling fans in every rm. Top of the line appls, gas log frplc* 1 car attached garage. Also incl in the fee is water/sewer/trash. You'll never have to shovel snow again-A wonderful life style w/many amenities*Garage # 39
-
2006-05-15$117,500
Show marketing remark (471 chars)
Simply the best! End condo is one of a kind w/added sq footage* Pleasently neutral color decor, cath ceilings add an open spacious feel* Beautifully built w/upgrades galore: cabinetry, center isle, brkfst bar, carpet & padding, hardwood flooring, ceiling fans in every rm. Top of the line appls, gas log frplc* 1 car attached garage. Also incl in the fee is water/sewer/trash. You'll never have to shovel snow again-A wonderful life style w/many amenities*Garage # 39
-
2002-06-24soldstatus $125,020
-
2002-02-02$124,900
ⓘ Source: listings_history table (triggers on properties + properties_extension) + one-shot
backfill from property_details.listing_events for pre-trigger history.
Tax reassessment forecast IN · Partial reset (capped growth)
- Current annual tax
- $4,352 · $363/mo
- Projected year-2 tax
- $4,352 · $363/mo
- Expected delta
- $0/yr ($0/mo · 0.0%)
ⓘ Screening estimate from a state-policy table — verify with the county assessor before closing.
Climate risk First Street
- Flood 1/10 Low FEMA zone X (unshaded) · 0% chance over 30 yrs
- Wildfire 1/10 Low
- Heat 3/10 Moderate 6 d/yr ≥101°F today · 16 d/yr by 30 yrs out
- Wind 2/10 Low 0% chance of damaging wind over 30 yrs
- Air quality 4/10 Moderate 3 unhealthy d/yr today · 6 by 30 yrs out
Nearby sold comps map
Loading sold comps map…
Walkable amenities ~0.75 mi
Loading nearby amenities…
Taxation est. · year 1
- Rental income
- $30,038
- − Mortgage interest
- −$14,004
- − Property taxes
- −$4,352
- − Insurance
- −$1,250
- − Repairs & maintenance
- −$2,403
- − Management
- −$2,403
- − HOA
- −$4,068
- − Depreciation
- −$7,273
- Taxable loss
- −$5,714
- Est. tax savings @ 24.0%
- +$1,371
- After-tax cash flow
- $-301/yr
For passive investors: Depreciation is non-cash, so a rental often shows a tax loss while cash-flowing — sheltering income. Rental losses are passive: they offset passive income freely, and up to $25,000/yr can offset ordinary (W-2) income if you actively participate and your MAGI is under $100k (phasing out to $0 by $150k); unused losses carry forward. On sale, claimed depreciation is recaptured at up to 25%, and gains may owe capital-gains tax (a 1031 exchange can defer both). Figures are a year-1 estimate at your 24.0% rate — not tax advice; consult a CPA.
Schools (NCES district)
- District
- Carmel Clay Schools
- NCES district ID
- 1801200
- Math proficiency
- 68% ▼ -7.00%
- Reading proficiency
- 70% ▼ -7.00%
- Median HH income
- $102,347
- Composite
- 63.54/100
- National rank
- #608
- State rank
- #1 of 301 in IN
Livability — Carmel
- Score
- 84/100
- State rank
- #7
- US rank
- #726
Category grades
Schools grade is shown separately in the Schools card above.
Census & demographics
- Census place
- Carmel, IN
- County
- Hamilton County · 337,479 people
- City population
- 99,910
- Metro
- Indianapolis-Carmel-Anderson, IN
- Population (ZIP)
- 51,515
- Household income
- $132,085
- Rent vs Own
- Severe rent burden
- 1216.0
Population outlook (Hamilton County) Hauer SSP2
- Today (2025)
- 381,938 people
- By 2030
- 417,496 · +9.3%
- By 2040
- 486,684 · +27.4%
- By 2050
- 549,805 · +44.0%
- By 2075
- 687,078 · +79.9%
- By 2100
- 754,495 · +97.5%
Race, ethnicity, and origin ACS 2023
- Neighborhood character
- Predominantly White (77%)
- Race & ethnicity
- White 77% Asian 10% Two or more races 6% Hispanic / Latino 5% Black 4%
- Hispanic origin (detail)
- Mexican 2%
- Common ancestry
- Romanian 4% Lithuanian 3% Slovak 2%
- Foreign-born
- 13% · Canada, China, South Korea
- Languages at home
- 85% English-only · Other Indo-European 4% Spanish 3% Chinese 2%
Political lean MEDSL · Hamilton
- 2024 margin
- Lean R (+6.1) · D 46.0% · R 52.1% · Other 1.9%
- 2008→2024 swing
- +16.2pp toward D · 2008: -22.2pp · 2024: -6.1pp
- All cycles
- 2024: R+6.1 2020: R+6.8 2016: R+19.6 2012: R+34.3 2008: R+22.2
Not yet ingested
- Civics
- —
Market trends
- HPI YoY
- ▼ -248.06%
- Current HPI
- 221.9087
- Rent YoY
- ▲ 6.47%
- Metro
- Indianapolis-Carmel-Anderson, IN
- State GDP YoY
- ▲ 2.90%
- F500 in state
- 18
Industry mix (Fortune 500 HQ in IN)
| Industry | F500 HQs | Revenue |
|---|---|---|
| Industrial Machinery | 2 | $37B |
|
||
| Healthcare | 1 | $177B |
|
||
| Pharmaceuticals | 1 | $45B |
|
||
| Metals / Steel | 1 | $18B |
|
||
| Agriculture | 1 | $17B |
|
||
| Packaging | 1 | $12B |
|
||
Price history
+100.2% since first listed7 events — show timeline
- 2026-05-08 Listed $250,000 MIBOR as Distributed by MLS Grid
- 2007-06-07 Sold (MLS) $122,000 MIBOR as Distributed by MLS Grid
- 2007-02-01 Listed $128,500 MIBOR as Distributed by MLS Grid
- 2006-06-30 Sold (MLS) $117,500 MIBOR as Distributed by MLS Grid
- 2006-05-15 Listed $117,500 MIBOR as Distributed by MLS Grid
- 2002-06-24 Sold (MLS) $125,020 MIBOR as Distributed by MLS Grid
- 2002-02-02 Listed $124,900 MIBOR as Distributed by MLS Grid
Property tax history
+7.3%/yrLatest (2025): $4,352 · +18.1% YoY. Source: county tax records.
Cash-flow waterfall
monthlySold comps — $/sqft
last 12 mo · ≤1 miLoading sold comps…