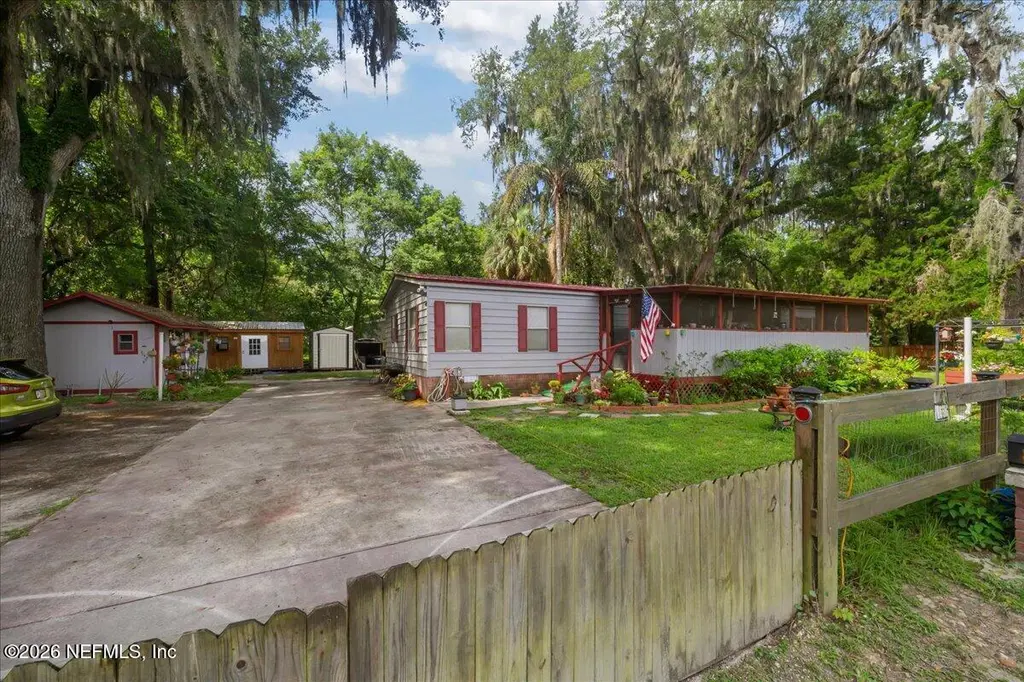
3429 Balsam St · Palatka, FL
Flood risk 1/10 · Minimal
- FEMA flood zone
- X (unshaded)
- Chance of flooding over 30 yrs
- 0.0%
- Est. flood insurance / yr
- $507 – $1,088
Fire risk 5/10 · Moderate
- Est. fire insurance / yr
- $947 – $1,759
Heat risk 8/10 · Major
- Hot days now (above 108°F)
- 6 days/yr
- Hot days in 30 yrs
- 17 days/yr
Wind risk 9/10 · Severe
- Chance of severe wind over 30 yrs
- 99.0%
Air-quality risk 2/10 · Minimal
- Unhealthy air days now
- 1 days/yr
- Unhealthy air days in 30 yrs
- 2 days/yr
Risk factors via First Street. Map © Google.
Why this score? — see what drove the C- grade
The composite is a weighted blend of 9 inputs, each scored 0–100. Each bar is that input's sub-score; the figure is the points it added to the 100-point composite (weight × sub-score).
- Cash flow +20.4/30.0
- ARV discount +9.9/15.0
- DSCR +6.5/10.0
- 1% rule +4.4/10.0
- Rent growth +3.1/5.0
- Schools +3.0/10.0
- Livability +2.9/5.0
- Condition / age +2.5/5.0
- Appreciation +0.0/10.0
$189,900
🖨 Deal sheet 📄 Offer letter ✓ Due diligence
Listing remarks MLS
Roomy 3BR/2BA DWMH just outside of the city limits. Large living room, separate dining room, family area off kitchen, new covered and screened front porch. Roomy exterior storage building. Great central location.
Key facts
- Durable metal roof
- Screened front porch
- New water heater
Tags
Property features AI
Finance
- HOA & community: Not a senior community
Exterior
- Parking: Off-street parking
- Utilities: Septic tank; Cable available; Electricity connected
- Home design: Manufactured home (double wide); North-facing
- Construction: Metal roof
- Exterior features: Front porch; Deck; Shed(s); Chain link, wire, and wood fencing; County road frontage; Paved road access
Interior
- Kitchen: Electric cooktop; Electric oven; Refrigerator
- Bedrooms: 3 bedrooms
- Bathrooms: 2 full bathrooms
- Heating & cooling: Central heating; Central air conditioning
- Interior features: In-unit laundry
- Laundry & utility: In-unit laundry
Neighborhood map
What this means for you Summary
Snapshot
- This is a 3-bed/2.0-bath manufactured listed at $190k.
Deal economics
- At list price, monthly cash flow is $247 ($3k/yr) — positive.
- The deal already cash-flows at list — no discount required.
- To meet the 1% rule (rent ≥ 1% of price), the offer needs to be $178k (6.2% below list).
- Recommended offer: $178k (6.2% below list) — sets the bar for 1% rule.
- Cap rate 7.9% vs local median 3.8% in Palatka — top-decile yield for the area; either an underpriced asset or a hidden risk that comps aren't pricing in. Stress-test before assuming the spread holds.
Location & tenants
- Location reads 58/100 on livability (#839 in FL) — a working-class tenant base; expect higher turnover. Strengths: cost of living A+, housing B+; Watch: schools C-, health & safety C-, crime D.
- Putnam (town): math 34% / reading 39% proficiency, ranked #66 of 73 in FL (top 90%) — families likely to look elsewhere, expect single-tenant / working-renter base with shorter leases; 71% free/reduced lunch — lower-income household profile, screen leases tightly.
- Market conditions: Rents rising (+2.2%/yr); 319 active listings in the ZIP; 7 comparable units currently listed for rent nearby; rentals at typical pace (median 24d on market — plan ~3-4 weeks tenant-placement turnaround); 113 units permitted in Putnam County in 2024 (0 in 5+ unit buildings).
- This rent runs 45% of the median local income ($48k/yr) — at the standard rent-burdened threshold; future hikes will face affordability resistance.
Forward outlook
- Local home prices are declining (-3.0%/yr); year-one equity from $1k of loan paydown is wiped out by about $6k of value loss. Plan a longer hold.
- Putnam County population projected at -31% by 2050 — secular population decline; favor cash flow + early exit over multi-decade hold.
Negotiation context
- Only 12 days on market — expect competitive offers; lowballing is unlikely to land.
- 7 sale attempts since 19y ago with the ask held roughly flat each time — persistent listings suggest the price (not the market) is what's stuck; bring a comps-based counter.
- Current owner paid $35k; list at $190k implies a 443% gain — meaningful room to come down on a strong offer.
Risks & watch-outs
- Climate carrying-cost: severe wind risk, 99% chance of damaging wind over 30y; moderate wildfire risk; extreme-heat days projected 6→17/yr by 2055 (HVAC capex compounding) — expect insurance premiums to compound above CPI over the hold.
Questions for the listing agent
- Built in 1978 — when were the roof, HVAC, electrical panel, plumbing, and water heater last replaced?
- Is there a deadline driving the sale (1031 exchange, divorce, estate, relocation)? That informs how much negotiation room exists.
- Crime grade is D in this area — have there been break-ins, vandalism, or insurance claims at this property in the last 3 years? What carrier currently insures it and at what premium?
- What's the average days-on-market for RENTAL listings here right now (not sales)? A rising rental-DOM trend means longer vacancies and softer asking-rent achievability than the comps imply.
- What's the recent tenant-quality profile in this submarket — average credit score on applications, eviction rate, late-payment / NSF rate, and stable-employment percentage? A property-management company in the area should have these aggregated.
- How much new for-sale + rental construction is in the pipeline within 1–3 miles? Heavy new supply typically softens prices + rents 12–24 months out; constrained supply supports both.
Investment metrics
- 1% rule
- 0.94% ✗
- Cap rate
- 7.86%
- Cash-on-cash
- 5.58%
- DSCR
- 1.25
- GRM
- 8.9
CMA / ARV
- ARV (on-the-fly)
- $200,784
- Comps found
- 2
Show comp detail 2 sales within ~0.75 mi
| Address | Dist | Beds/Ba | Sqft | Sold | Price | $/sf | Match |
|---|---|---|---|---|---|---|---|
| 328 Old Peniel Rd | 0.65mi | 3/2.0 | 1,350 (-5%) | 5mo | $190,000 | $141 | 56 |
| 3025 Bainbridge Rd | 0.33mi | 3/2.0 | 1,300 (-9%) | 16mo | $155,000 | $119 | 56 |
Match score weights: distance 35% · size 25% · config 20% · recency 20%. Top-matched comps best support the ARV.
Projected returns pro-forma
-3.0% appreciation · 2.23% rent growth · sell at horizon
- IRR
- -8.5%
- Equity multiple
- 0.69×
- Total profit
- $-16,453
- Equity at exit
- $28,315
- IRR
- 0.0%
- Equity multiple
- 1.00×
- Total profit
- $154
- Equity at exit
- $16,419
Cash invested: $53,172 (down + closing). Projections, not guarantees.
Landlord ↔ Tenant lean methodology
- Overall (STATE)
- 87 Strongly Landlord-Friendly
- State Florida
- 87 Strongly Landlord-Friendly · R+3
- County
- — inherits STATE
- City
- — inherits STATE
ZIP-level market 32177
- Home prices YoY
- -28.1%
- Rents YoY
- 2.2%
- Active inventory
- 319
- Price-to-rent
- 8.9×
Monthly cashflow live
- Estimated rent
- $1,782 high interval (Pro) →
- Mortgage (P&I)
- −$996
- Tax from tax record
- −$86 /mo · $1,026/yr
- Insurance
- −$79
- HOA
- −$0
- Vacancy / Maint / Mgmt
- −$374
- Net cashflow
- $247
Break-even live
UW: 25.0% down · 7.5% · 30yr · 1.5% tax · 5.0% vac · 8.0% maint · 8.0% mgmt
Financing live
Cash to close
- Down payment
- $47,475
- Closing costs
- $5,697
- Reserves months
- —
- Total cash needed
- —
Loan-product check · same deal, 3 products live
Conventional
25% down · 7.5% · 30yr
- Down + closing
- —
- Monthly P&I
- —
- Monthly cashflow
- —
- DSCR
- —
- Eligible?
- —
Personal DTI + credit; lowest rate.
DSCR
20% down · 8.5% · 30yr
- Down + closing
- —
- Monthly P&I
- —
- Monthly cashflow
- —
- DSCR
- —
- Eligible?
- —
No personal income docs; deal must DSCR.
Hard money
10% down · 12.0% · 12mo
- Down + closing
- —
- Monthly P&I
- —
- Monthly cashflow
- —
- DSCR
- —
- Eligible?
- —
Short-term bridge; refi at stabilization.
Rent comps 7 comps
| Address | Beds | Baths | Sqft | Rent | $/sqft | DOM | Units | Dist |
|---|---|---|---|---|---|---|---|---|
| 3523 Whitehall St Palatka, FL | 3.0 | 2.0 | 1078 | $2,000 | $1.86 | 23d | 1 | 0.20mi |
| 2406 Husson Ave Palatka, FL | 3.0 | 2.0 | 1559 | $1,900 | $1.22 | 20d | 1 | 0.68mi |
| 1906 Roselle Ave Palatka, FL | 4.0 | 2.0 | 1100 | $2,100 | $1.91 | 17d | 1 | 0.76mi |
| 127 Crestwood Ave Palatka, FL | 4.0 | 2.0 | 1674 | $1,650 | $0.99 | 17d | 1 | 0.92mi |
| 1511 S Palm Ave Unit 4 Palatka, FL | 3.0 | 1.0 | 1224 | $1,250 | $1.02 | 23d | 1 | 0.94mi |
| 1510 Cleveland Ave Palatka, FL | 2.0 | 1.0 | 916 | $1,350 | $1.47 | 23d | 1 | 1.09mi |
| 2113 Silver Lake Dr Palatka, FL | 2.0 | 1.0 | 988 | $1,500 | $1.52 | 23d | 1 | 1.25mi |
Listing history 9 events
-
2026-06-18days on market $189,900 Active 12 DOM
-
2026-06-17days on market $189,900 Active 11 DOM
-
2026-06-16days on market $189,900 Active 10 DOM
-
2026-06-15days on market $189,900 Active 9 DOM
-
2026-06-13days on market $189,900 Active 7 DOM
-
2026-06-09days on market $189,900 Active 3 DOM
-
2026-06-08days on market $189,900 Active 2 DOM
-
2026-06-07remarks 699-char remark
-
2026-06-07$189,900 Active 1 DOM
ⓘ Source: listings_history table (triggers on properties + properties_extension) + one-shot
backfill from property_details.listing_events for pre-trigger history.
Tax reassessment forecast FL · Resets to sale price
- Current annual tax
- $1,026 · $86/mo
- Projected year-2 tax
- $1,576 · $131/mo
- Expected delta
- +$550/yr (+$46/mo · 53.6%)
ⓘ Screening estimate from a state-policy table — verify with the county assessor before closing.
Climate risk First Street
- Flood 1/10 Low FEMA zone X (unshaded) · 0% chance over 30 yrs
- Wildfire 5/10 Major
- Heat 8/10 Severe 6 d/yr ≥108°F today · 17 d/yr by 30 yrs out
- Wind 9/10 Extreme 99% chance of damaging wind over 30 yrs
- Air quality 2/10 Low 1 unhealthy d/yr today · 2 by 30 yrs out
Nearby sold comps map
Loading sold comps map…
Walkable amenities ~0.75 mi
Loading nearby amenities…
Taxation est. · year 1
- Rental income
- $21,386
- − Mortgage interest
- −$10,637
- − Property taxes
- −$1,026
- − Insurance
- −$950
- − Repairs & maintenance
- −$1,711
- − Management
- −$1,711
- − Depreciation
- −$5,524
- Taxable loss
- −$174
- Est. tax savings @ 24.0%
- +$42
- After-tax cash flow
- $3,010/yr
For passive investors: Depreciation is non-cash, so a rental often shows a tax loss while cash-flowing — sheltering income. Rental losses are passive: they offset passive income freely, and up to $25,000/yr can offset ordinary (W-2) income if you actively participate and your MAGI is under $100k (phasing out to $0 by $150k); unused losses carry forward. On sale, claimed depreciation is recaptured at up to 25%, and gains may owe capital-gains tax (a 1031 exchange can defer both). Figures are a year-1 estimate at your 24.0% rate — not tax advice; consult a CPA.
Schools (NCES district)
- District
- Putnam
- NCES district ID
- 1201620
- Math proficiency
- 34% ▼ -10.00%
- Reading proficiency
- 39% ▼ -4.00%
- Median HH income
- $33,350
- Composite
- 29.99/100
- National rank
- #6361
- State rank
- #66 of 73 in FL
Livability — Palatka
- Score
- 58/100
- State rank
- #839
- US rank
- #20793
Category grades
Schools grade is shown separately in the Schools card above.
Census & demographics
- County
- Putnam County · 25,645 people
- City population
- 25,645
- Metro
- Palatka, FL
- Population (ZIP)
- 25,645
- Household income
- $47,796
- Rent vs Own
- Severe rent burden
- 806.0
Population outlook (Putnam County) Hauer SSP2
- Today (2025)
- 65,299 people
- By 2030
- 61,255 · -6.2%
- By 2040
- 52,930 · -18.9%
- By 2050
- 45,051 · -31.0%
- By 2075
- 28,720 · -56.0%
- By 2100
- 15,852 · -75.7%
Race, ethnicity, and origin ACS 2023
- Neighborhood character
- Majority White (62%)
- Race & ethnicity
- White 62% Black 28% Hispanic / Latino 7% Two or more races 5%
- Hispanic origin (detail)
- Mexican 2% Puerto Rican 3% Cuban 2%
- Common ancestry
- Lithuanian 2% Hispanic 1% Slovak 1%
- Foreign-born
- 3% · Canada
- Languages at home
- 94% English-only · Spanish 5% French/Haitian/Cajun 1%
Political lean MEDSL · Putnam
- 2024 margin
- Solid R (+47.8) · D 25.8% · R 73.6%
- 2008→2024 swing
- -28.5pp toward R · 2008: -19.3pp · 2024: -47.8pp
- All cycles
- 2024: R+47.8 2020: R+41.2 2016: R+36.6 2012: R+24.5 2008: R+19.3
Not yet ingested
- Civics
- —
Market trends
- HPI YoY
- ▼ -87.10%
- Current HPI
- 223.1966
- Rent YoY
- ▲ 2.23%
- Metro
- Palatka, FL
- State GDP YoY
- ▲ 3.28%
- F500 in state
- 36
Industry mix (Fortune 500 HQ in FL)
| Industry | F500 HQs | Revenue |
|---|---|---|
| Industrial Technology | 2 | $29B |
|
||
| Insurance | 2 | $17B |
|
||
| Retail | 1 | $60B |
|
||
| Technology Distribution | 1 | $58B |
|
||
| Homebuilding | 1 | $35B |
|
||
| Technology Manufacturing | 1 | $35B |
|
||
Price history
+153.5% since first listed18 events — show timeline
- 2026-06-06 Listed $189,900 realMLS
- 2017-03-28 Sold (Public Records) $35,000 Public Records
- 2017-03-23 Sold (MLS) $35,000 realMLS
- 2017-01-26 Pending — realMLS
- 2016-12-13 Listed $39,900 realMLS
- 2016-10-13 Listing Removed — realMLS
- 2016-08-08 Relisted — realMLS
- 2016-08-08 Price Changed $46,000 realMLS
- 2016-08-01 Pending — realMLS
- 2016-04-11 Listed $51,000 realMLS
- 2016-04-11 Price Changed $49,500 realMLS
- 2015-04-21 Sold (MLS) $30,000 realMLS
- 2015-04-07 Pending — realMLS
- 2015-03-18 Relisted — realMLS
- 2015-03-12 Pending — realMLS
- 2013-09-10 Listed $32,000 realMLS
- 2007-08-19 Listing Removed — realMLS
- 2007-02-19 Listed $74,900 realMLS
Property tax history
+0.6%/yrLatest (2025): $1,026 · -2.8% YoY. Source: county tax records.
Cash-flow waterfall
monthlySold comps — $/sqft
last 12 mo · ≤1 miLoading sold comps…