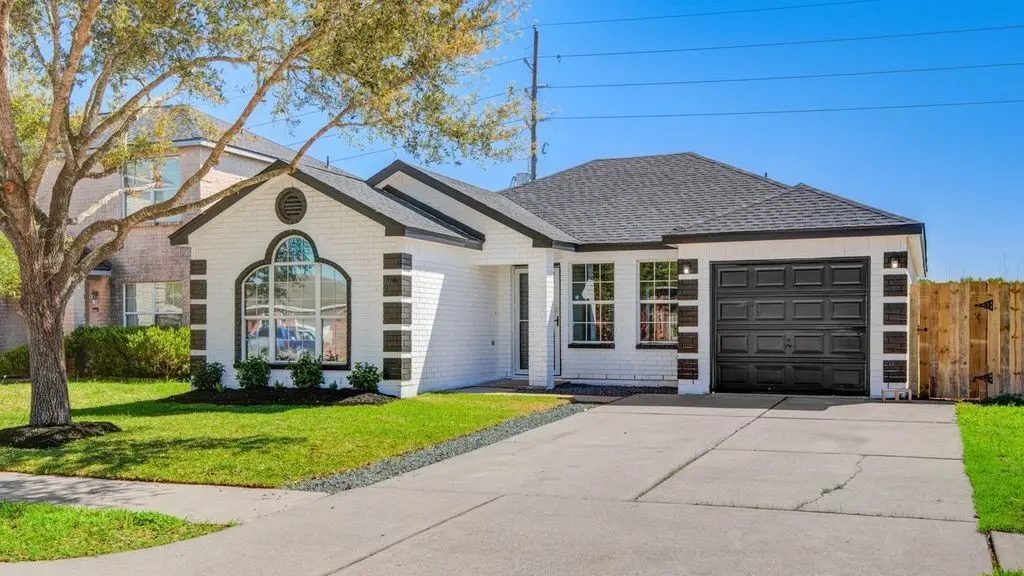
12610 Rio Bravo St · Pearland, TX
Flood risk 1/10 · Minimal
- FEMA flood zone
- X (unshaded)
- Chance of flooding over 30 yrs
- 0.0%
- Est. flood insurance / yr
- $507 – $1,088
Fire risk 4/10 · Minor
- Est. fire insurance / yr
- $1,222 – $2,270
Heat risk 9/10 · Severe
- Hot days now (above 110°F)
- 7 days/yr
- Hot days in 30 yrs
- 23 days/yr
Wind risk 9/10 · Severe
- Chance of severe wind over 30 yrs
- 99.0%
Air-quality risk 2/10 · Minimal
- Unhealthy air days now
- 1 days/yr
- Unhealthy air days in 30 yrs
- 2 days/yr
Risk factors via First Street. Map © Google.
Why this score? — see what drove the C+ grade
The composite is a weighted blend of 9 inputs, each scored 0–100. Each bar is that input's sub-score; the figure is the points it added to the 100-point composite (weight × sub-score).
- Cash flow +28.3/30.0
- DSCR +10.0/10.0
- 1% rule +7.3/10.0
- ARV discount +4.8/15.0
- Livability +4.0/5.0
- Schools +3.9/10.0
- Rent growth +2.6/5.0
- Condition / age +2.5/5.0
- Appreciation +0.0/10.0
$234,900
🖨 Deal sheet 📄 Offer letter ✓ Due diligence
Listing remarks MLS
The house isn't new but the roof, floors, paint, counter tops, fence & appliances are all NEW!! Even the foundation comes with a life time warranty! The most curb appeal on the street will belong to you once you move in. Stop renting and come buy this house before its too late.
Key facts
- Floors new
- Paint new
- Counter tops new
Tags
Neighborhood map
What this means for you Summary
Snapshot
- This is a 4-bed/2.0-bath single-family listed at $235k.
Deal economics
- At list price, monthly cash flow is $755 ($9k/yr) — positive.
- The deal already cash-flows at list — no discount required.
- Meets the 1% rule at list price ($3k rent vs $235k).
- Recommended offer: $214k (9.0% below list) — sets the bar for market timing.
- Cap rate 10.1% vs local median 3.0% in Pearland — top-decile yield for the area; either an underpriced asset or a hidden risk that comps aren't pricing in. Stress-test before assuming the spread holds.
Location & tenants
- Location reads 81/100 on livability (#32 in TX, #1,539 nationally) — a professional / high-income tenant draw. Strengths: schools A+, employment A+, housing A+; Watch: amenities D-, commute F.
- Alvin ISD (suburban): math 39% / reading 48% proficiency, ranked #255 of 826 in TX (top 31%) — families likely to look elsewhere, expect single-tenant / working-renter base with shorter leases.
- Market conditions: Rents flat; 1139 active listings in the ZIP; 2 comparable units currently listed for rent nearby; high-income renter base; 3,960 units permitted in Brazoria County in 2024 (593 in 5+ unit buildings).
Forward outlook
- Local home prices are declining (-3.0%/yr); year-one equity from $2k of loan paydown is wiped out by about $7k of value loss. Plan a longer hold.
- Brazoria County population projected at +44% by 2050 — long-run rental-demand tailwind backs the buy-and-hold thesis.
Negotiation context
- It's been on market 96 days — a 9% lower offer ($214k) is reasonable based on typical stale-listing flexibility.
- 2 sale attempts since 18y ago; this cycle's ask has dropped $24k (9%) from the opening price — seller is motivated, your offer sets the floor, not the list.
- Current owner paid $145k; list at $235k implies a 62% gain — meaningful room to come down on a strong offer.
Risks & watch-outs
- Climate carrying-cost: severe wind risk, 99% chance of damaging wind over 30y; extreme-heat days projected 7→23/yr by 2055 (HVAC capex compounding) — expect insurance premiums to compound above CPI over the hold.
Questions for the listing agent
- It's been on market 96 days. Have you received any prior offers? Is the seller open to a 9% concession, seller financing, or rate buy-down credit?
- What does the HOA fee cover, when was the last increase, and are there any pending special assessments or reserve-fund shortfalls?
- Why hasn't it sold? Are there any deal-killer items the seller is aware of (foundation, flood, title, zoning, code violations)?
- Is there a deadline driving the sale (1031 exchange, divorce, estate, relocation)? That informs how much negotiation room exists.
- Schools are A-rated — typically a magnet for longer-tenancy family renters. What's the average tenant stay here, and is there a school-zone premium baked into asking?
- What's the average days-on-market for RENTAL listings here right now (not sales)? A rising rental-DOM trend means longer vacancies and softer asking-rent achievability than the comps imply.
- What's the recent tenant-quality profile in this submarket — average credit score on applications, eviction rate, late-payment / NSF rate, and stable-employment percentage? A property-management company in the area should have these aggregated.
- How much new for-sale + rental construction is in the pipeline within 1–3 miles? Heavy new supply typically softens prices + rents 12–24 months out; constrained supply supports both.
Investment metrics
- 1% rule
- 1.23% ✓
- Cap rate
- 10.15%
- Cash-on-cash
- 13.77%
- DSCR
- 1.61
- GRM
- 6.8
CMA / ARV
- ARV (median comp)
- $221,617
- List price
- $234,900
- Delta
- 5.99%
- Verdict
- FAIR
- Comps
- 20 within 1.0 mi
Show comp detail 7 sales within ~0.75 mi
| Address | Dist | Beds/Ba | Sqft | Sold | Price | $/sf | Match |
|---|---|---|---|---|---|---|---|
| 5518 Rio Ramos St | 0.25mi | 4/2.0 | 1,365 (0%) | 8mo | $213,440 | $156 | 82 |
| 5503 Rio Alamo St | 0.22mi | 4/2.0 | 1,379 (+1%) | 15mo | $265,000 | $192 | 76 |
| 5411 Rio Alamo St | 0.26mi | 4/2.0 | 1,383 (+1%) | 22mo | $225,000 | $163 | 67 |
| 5509 Rio Ramos St | 0.24mi | 3/2.0 (-1) | 1,417 (+4%) | 13mo | $225,000 | $159 | 67 |
| 13210 Barton Meadow Ln | 0.59mi | 3/2.0 (-1) | 1,378 (+1%) | 2mo | $229,900 | $167 | 64 |
| 12602 Rio San Juan Ct | 0.05mi | 3/2.0 (-1) | 1,200 (-12%) | 20mo | $224,990 | $187 | 56 |
| 12806 Rio Bravo St | 0.19mi | 3/2.0 (-1) | 1,214 (-11%) | 16mo | $220,000 | $181 | 54 |
Match score weights: distance 35% · size 25% · config 20% · recency 20%. Top-matched comps best support the ARV.
Projected returns pro-forma
-3.0% appreciation · 0.44% rent growth · sell at horizon
- IRR
- 1.1%
- Equity multiple
- 1.04×
- Total profit
- $2,753
- Equity at exit
- $35,024
- IRR
- 8.1%
- Equity multiple
- 1.55×
- Total profit
- $36,003
- Equity at exit
- $20,310
Cash invested: $65,772 (down + closing). Projections, not guarantees.
Landlord ↔ Tenant lean methodology
- Overall (STATE)
- 87 Strongly Landlord-Friendly
- State Texas
- 87 Strongly Landlord-Friendly · R+5
- County
- — inherits STATE
- City
- — inherits STATE
ZIP-level market 77583
- Rents YoY
- 0.4%
- Active inventory
- 1139
- Price-to-rent
- 6.8×
Monthly cashflow live
- Estimated rent
- $2,883 medium interval (Pro) →
- Mortgage (P&I)
- −$1,232
- Tax from tax record
- −$168 /mo · $2,012/yr
- Insurance
- −$98
- HOA
- −$25
- Vacancy / Maint / Mgmt
- −$605
- Net cashflow
- $755
Break-even live
UW: 25.0% down · 7.5% · 30yr · 1.5% tax · 5.0% vac · 8.0% maint · 8.0% mgmt
Financing live
Cash to close
- Down payment
- $58,725
- Closing costs
- $7,047
- Reserves months
- —
- Total cash needed
- —
Loan-product check · same deal, 3 products live
Conventional
25% down · 7.5% · 30yr
- Down + closing
- —
- Monthly P&I
- —
- Monthly cashflow
- —
- DSCR
- —
- Eligible?
- —
Personal DTI + credit; lowest rate.
DSCR
20% down · 8.5% · 30yr
- Down + closing
- —
- Monthly P&I
- —
- Monthly cashflow
- —
- DSCR
- —
- Eligible?
- —
No personal income docs; deal must DSCR.
Hard money
10% down · 12.0% · 12mo
- Down + closing
- —
- Monthly P&I
- —
- Monthly cashflow
- —
- DSCR
- —
- Eligible?
- —
Short-term bridge; refi at stabilization.
Rent comps 2 comps
| Address | Beds | Baths | Sqft | Rent | $/sqft | DOM | Units | Dist |
|---|---|---|---|---|---|---|---|---|
| 57 Spring Ln Manvel, TX | 4.0 | 2.0 | 1875 | $2,450 | $1.31 | 44d | 1 | 0.54mi |
| 21 Wheeler Ridge Cir Manvel, TX | 3.0 | 2.0 | 1275 | $1,875 | $1.47 | 5d | 1 | 0.79mi |
HOA detail
- Monthly dues
- $25 · $300/yr
Listing history 21 events
-
2026-06-18days on market $234,900 Active 96 DOM
-
2026-06-17days on market $234,900 Active 95 DOM
-
2026-06-16days on market $234,900 Active 94 DOM
-
2026-06-15days on market $234,900 Active 93 DOM
-
2026-06-13days on market $234,900 Active 91 DOM
-
2026-06-13days on market $234,900 Active 90 DOM
-
2026-06-10price $234,900 Active 87 DOM
-
2026-06-09days on market $239,900 Active 87 DOM
-
2026-06-08days on market $239,900 Active 86 DOM
-
2026-06-07days on market $239,900 Active 85 DOM
-
2026-06-04days on market $239,900 Active 82 DOM
-
2026-06-03days on market $239,900 Active 81 DOM
-
2026-06-02days on market $239,900 Active 80 DOM
-
2026-06-01days on market $239,900 Active 79 DOM
-
2026-05-31days on market $239,900 Active 78 DOM
-
2026-04-25price $239,900 282-char remark
Show marketing remark (282 chars)
The house isn't new but the roof, floors, paint, counter tops, fence & appliances are all NEW!! Even the foundation comes with a life time warranty! The most curb appeal on the street will belong to you once you move in. Stop renting and come buy this house before its too late.
-
2026-04-13price $249,900 282-char remark
Show marketing remark (282 chars)
The house isn't new but the roof, floors, paint, counter tops, fence & appliances are all NEW!! Even the foundation comes with a life time warranty! The most curb appeal on the street will belong to you once you move in. Stop renting and come buy this house before its too late.
-
2026-03-15$259,000 Active 282-char remark
Show marketing remark (282 chars)
The house isn't new but the roof, floors, paint, counter tops, fence & appliances are all NEW!! Even the foundation comes with a life time warranty! The most curb appeal on the street will belong to you once you move in. Stop renting and come buy this house before its too late.
-
2026-01-29soldstatus $145,200
-
2009-04-13historical
-
2008-02-26$105,000
ⓘ Source: listings_history table (triggers on properties + properties_extension) + one-shot
backfill from property_details.listing_events for pre-trigger history.
Tax reassessment forecast TX · Resets to sale price
- Current annual tax
- $2,012 · $168/mo
- Projected year-2 tax
- $4,299 · $358/mo
- Expected delta
- +$2,286/yr (+$191/mo · 113.6%)
ⓘ Screening estimate from a state-policy table — verify with the county assessor before closing.
Climate risk First Street
- Flood 1/10 Low FEMA zone X (unshaded) · 0% chance over 30 yrs
- Wildfire 4/10 Moderate
- Heat 9/10 Extreme 7 d/yr ≥110°F today · 23 d/yr by 30 yrs out
- Wind 9/10 Extreme 99% chance of damaging wind over 30 yrs
- Air quality 2/10 Low 1 unhealthy d/yr today · 2 by 30 yrs out
Nearby sold comps map
Loading sold comps map…
Walkable amenities ~0.75 mi
Loading nearby amenities…
Taxation est. · year 1
- Rental income
- $34,591
- − Mortgage interest
- −$13,158
- − Property taxes
- −$2,012
- − Insurance
- −$1,174
- − Repairs & maintenance
- −$2,767
- − Management
- −$2,767
- − HOA
- −$300
- − Depreciation
- −$6,833
- Taxable income
- $5,578
- Est. tax owed @ 24.0%
- −$1,339
- After-tax cash flow
- $7,719/yr
For passive investors: Depreciation is non-cash, so a rental often shows a tax loss while cash-flowing — sheltering income. Rental losses are passive: they offset passive income freely, and up to $25,000/yr can offset ordinary (W-2) income if you actively participate and your MAGI is under $100k (phasing out to $0 by $150k); unused losses carry forward. On sale, claimed depreciation is recaptured at up to 25%, and gains may owe capital-gains tax (a 1031 exchange can defer both). Figures are a year-1 estimate at your 24.0% rate — not tax advice; consult a CPA.
Schools (NCES district)
- District
- Alvin ISD
- NCES district ID
- 4808090
- Math proficiency
- 39% ▼ -11.00%
- Reading proficiency
- 48% ▬ 0.00%
- Median HH income
- $66,740
- Composite
- 38.96/100
- National rank
- #4080
- State rank
- #255 of 826 in TX
Livability — Pearland
- Score
- 81/100
- State rank
- #32
- US rank
- #1539
Category grades
Schools grade is shown separately in the Schools card above.
Census & demographics
- County
- Brazoria County · 374,982 people
- City population
- 142,397
- Metro
- Houston-The Woodlands-Sugar Land, TX
- Population (ZIP)
- 52,747
- Household income
- $119,287
- Rent vs Own
- Severe rent burden
- 251.0
Population outlook (Brazoria County) Hauer SSP2
- Today (2025)
- 420,414 people
- By 2030
- 457,585 · +8.8%
- By 2040
- 532,232 · +26.6%
- By 2050
- 605,399 · +44.0%
- By 2075
- 779,358 · +85.4%
- By 2100
- 883,759 · +110.2%
Race, ethnicity, and origin ACS 2023
- Neighborhood character
- Highly diverse neighborhood (Simpson 0.70)
- Race & ethnicity
- Hispanic / Latino 38% Black 34% White 20% Two or more races 18% Asian 5%
- Hispanic origin (detail)
- Mexican 31% Puerto Rican 2%
- Common ancestry
- Lithuanian 1% Slovak 1% Romanian 1%
- Foreign-born
- 16% · Canada, Vietnam, China
- Languages at home
- 64% English-only · Spanish 28% Other Asian/Pacific 2% Vietnamese 1%
Political lean MEDSL · Brazoria
- 2024 margin
- R (+19.7) · D 39.5% · R 59.2% · Other 1.3%
- 2008→2024 swing
- +9.9pp toward D · 2008: -29.6pp · 2024: -19.7pp
- All cycles
- 2024: R+19.7 2020: R+18.2 2016: R+24.6 2012: R+34.2 2008: R+29.6
Not yet ingested
- Civics
- —
Market trends
- HPI YoY
- ▼ -120.19%
- Current HPI
- 198.6559
- Rent YoY
- ▲ 0.44%
- Metro
- Houston-The Woodlands-Sugar Land, TX
- State GDP YoY
- ▲ 3.95%
- F500 in state
- 110
Industry mix (Fortune 500 HQ in TX)
| Industry | F500 HQs | Revenue |
|---|---|---|
| Energy | 16 | $1,198B |
|
||
| Technology | 5 | $198B |
|
||
| Engineering / Construction | 4 | $72B |
|
||
| Energy Services | 3 | $60B |
|
||
| Utilities | 3 | $41B |
|
||
| Healthcare | 2 | $330B |
|
||
Price history
+128.5% since first listed6 events — show timeline
- 2026-04-25 Price Changed $239,900 HARMLS
- 2026-04-13 Price Changed $249,900 HARMLS
- 2026-03-15 Listed $259,000 HARMLS
- 2026-01-29 Sold (Public Records) $145,200 Public Records
- 2009-04-13 Listing Removed — HARMLS
- 2008-02-26 Listed $105,000 HARMLS
Property tax history
+0.7%/yrLatest (2025): $2,012 · -52.0% YoY. Source: county tax records.
Cash-flow waterfall
monthlySold comps — $/sqft
last 12 mo · ≤1 miLoading sold comps…