8 Sinnickson Rd · Center Moriches, NY
Flood risk 7/10 · Major
- FEMA flood zone
- AE
- Chance of flooding over 30 yrs
- 0.96%
- Est. flood insurance / yr
- $2,026 – $9,024
Fire risk 3/10 · Minor
- Est. fire insurance / yr
- $691 – $1,283
Heat risk 4/10 · Minor
- Hot days now (above 91°F)
- 7 days/yr
- Hot days in 30 yrs
- 20 days/yr
Wind risk 8/10 · Major
- Chance of severe wind over 30 yrs
- 80.0%
Air-quality risk 4/10 · Minor
- Unhealthy air days now
- 3 days/yr
- Unhealthy air days in 30 yrs
- 5 days/yr
Risk factors via First Street. Map © Google.
Why this score? — see what drove the B- grade
The composite is a weighted blend of 9 inputs, each scored 0–100. Each bar is that input's sub-score; the figure is the points it added to the 100-point composite (weight × sub-score).
- Cash flow +30.0/30.0
- 1% rule +10.0/10.0
- DSCR +10.0/10.0
- Schools +5.5/10.0
- ARV discount +4.4/15.0
- Livability +3.3/5.0
- Rent growth +2.5/5.0
- Condition / age +2.5/5.0
- Appreciation +0.0/10.0
$899,000
🖨 Deal sheet 📄 Offer letter ✓ Due diligence
Listing remarks
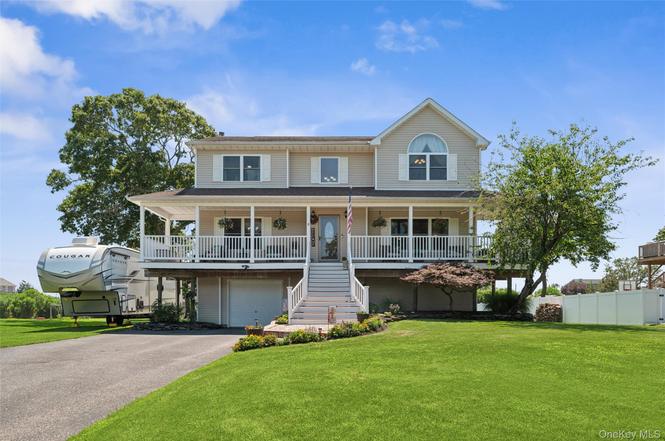
Thoughtfully updated and impeccably cared for, this beautiful 4-bedroom, 2.5-bath colonial home offers stunning water views and the ideal blend of modern comfort with timeless appeal. Spanning 3000 square feet on a generous 0.46-acre lot, the property has been newly refreshed throughout with fresh finishes, contemporary touches, and meticulous attention to detail, making it truly move-in ready. The well-appointed interior features spacious, light-filled living areas perfect for both relaxing and entertaining, with an open flow that maximizes the captivating water views. Enjoy the serenity of waterfront proximity while benefiting from an exceptional location just moments from Webby's beach,
Key facts
- 0.46 acre lot
- Garage
- Built 2001
Neighborhood map
What this means for you Summary
Snapshot
- This is a 4-bed/2.5-bath single-family listed at $899k.
Deal economics
- At list price, monthly cash flow is $9k ($103k/yr) — positive.
- The deal already cash-flows at list — no discount required.
- Meets the 1% rule at list price ($20k rent vs $899k).
- Recommended offer: $886k (1.5% below list) — sets the bar for market timing.
- Cap rate 18.4% vs local median 1.9% in Center Moriches — top-decile yield for the area; either an underpriced asset or a hidden risk that comps aren't pricing in. Stress-test before assuming the spread holds.
Location & tenants
- Location reads 66/100 on livability (#641 in NY) — a middle-class / working-renter tenant base. Strengths: employment A+, housing A+, crime A-; Watch: amenities F, commute F, cost of living F.
- Center Moriches Union Free School District (suburban): math 65% / reading 55% proficiency, ranked #188 of 590 in NY (top 32%) — acceptable for families but not a draw, mixed tenant base, ~2y average lease; only 18% free/reduced lunch — higher-income household profile.
- Zoned schools: Clayton Huey Elementary School (math 42% / reading 52%, grade D-, #1,195 of 2,108 statewide, top 60%, 598 students, 28% FRL); Center Moriches Middle School (math 57% / reading 52%, grade B-, #214 of 729 statewide, top 31%, 325 students, 29% FRL); Center Moriches High School (math 92% / reading 64%, grade A-, #568 of 1,100 statewide, top 52%, 556 students, 25% FRL).
- Market conditions: 64 active listings in the ZIP; 1 comparable units currently listed for rent nearby; 1,366 units permitted in Suffolk County in 2024 (216 in 5+ unit buildings).
Forward outlook
- Local home prices are declining (-3.0%/yr); year-one equity from $6k of loan paydown is wiped out by about $27k of value loss. Plan a longer hold.
- Suffolk County population projected to shrink 5% by 2050 — rents likely to lag national; underwrite the cash flow, not the appreciation.
- At projected returns (-3.0% appreciation + 3.0% rent growth), your $252k cash investment doubles in ~3 years — after that, you're playing with house money.
Negotiation context
- It's been on market 22 days — a 2% lower offer ($886k) is reasonable based on typical stale-listing flexibility.
- 2 sale attempts with the ask held roughly flat each time — persistent listings suggest the price (not the market) is what's stuck; bring a comps-based counter.
- Current owner paid $78k; list at $899k implies a 1060% gain — meaningful room to come down on a strong offer.
Risks & watch-outs
- Watch-outs: flood insurance adds $460/mo.
- Climate carrying-cost: in FEMA flood zone AE (mandatory federal flood insurance); severe wind risk, 80% chance of damaging wind over 30y — expect insurance premiums to compound above CPI over the hold.
Questions for the listing agent
- What's the actual annual flood-insurance premium (NFIP or private), and is the property in a SFHA with mandatory coverage?
- Is there a deadline driving the sale (1031 exchange, divorce, estate, relocation)? That informs how much negotiation room exists.
- Schools are A-rated — typically a magnet for longer-tenancy family renters. What's the average tenant stay here, and is there a school-zone premium baked into asking?
- What's the average days-on-market for RENTAL listings here right now (not sales)? A rising rental-DOM trend means longer vacancies and softer asking-rent achievability than the comps imply.
- What's the recent tenant-quality profile in this submarket — average credit score on applications, eviction rate, late-payment / NSF rate, and stable-employment percentage? A property-management company in the area should have these aggregated.
- How much new for-sale + rental construction is in the pipeline within 1–3 miles? Heavy new supply typically softens prices + rents 12–24 months out; constrained supply supports both.
Investment metrics
- 1% rule
- 2.22% ✓
- Cap rate
- 18.36%
- Cash-on-cash
- 43.11%
- DSCR
- 2.92
- GRM
- 3.7
CMA / ARV
- ARV (on-the-fly)
- $841,320
- Comps found
- 5
Show comp detail 5 sales within ~0.75 mi
| Address | Dist | Beds/Ba | Sqft | Sold | Price | $/sf | Match |
|---|---|---|---|---|---|---|---|
| 8 Sinnickson Rd | 0.00mi | 4/2.5 | 2,952 (0%) | 1mo | $880,000 | $298 | 100 |
| 12 Lloyd St | 0.06mi | 4/3.5 | 2,808 (-5%) | 13mo | $720,000 | $256 | 74 |
| 23 Sedgemere Rd | 0.59mi | 4/2.0 | 3,000 (+2%) | 10mo | $975,000 | $325 | 60 |
| 51 Orchard Neck Rd | 0.41mi | 3/3.0 (-1) | 2,700 (-8%) | 11mo | $769,999 | $285 | 51 |
| 34 Sedgemere Rd | 0.65mi | 4/2.0 | 2,592 (-12%) | 6mo | $730,000 | $282 | 42 |
Match score weights: distance 35% · size 25% · config 20% · recency 20%. Top-matched comps best support the ARV.
Projected returns pro-forma
-3.0% appreciation · 3.0% rent growth · sell at horizon
- IRR
- 37.5%
- Equity multiple
- 2.60×
- Total profit
- $401,893
- Equity at exit
- $134,044
- IRR
- 44.1%
- Equity multiple
- 5.20×
- Total profit
- $1,057,595
- Equity at exit
- $77,729
Cash invested: $251,720 (down + closing). Projections, not guarantees.
Landlord ↔ Tenant lean methodology
- Overall (STATE)
- 15 Strongly Tenant-Friendly
- State New York
- 15 Strongly Tenant-Friendly · D+10
- County
- — inherits STATE
- City
- — inherits STATE
ZIP-level market 11934
- Home prices YoY
- -21.5%
- Active inventory
- 64
- Price-to-rent
- 3.7×
Monthly cashflow live
- Estimated rent
- $20,000 medium interval (Pro) →
- Mortgage (P&I)
- −$4,714
- Tax from tax record
- −$1,668 /mo · $20,012/yr
- Insurance
- −$375
- Flood insurance flood zone
- −$460 /mo · $5,525/yr
- HOA
- −$0
- Vacancy / Maint / Mgmt
- −$4,200
- Net cashflow
- $8,583
Break-even live
UW: 25.0% down · 7.5% · 30yr · 1.5% tax · 5.0% vac · 8.0% maint · 8.0% mgmt
Financing live
Cash to close
- Down payment
- $224,750
- Closing costs
- $26,970
- Reserves months
- —
- Total cash needed
- —
Loan-product check · same deal, 3 products live
Conventional
25% down · 7.5% · 30yr
- Down + closing
- —
- Monthly P&I
- —
- Monthly cashflow
- —
- DSCR
- —
- Eligible?
- —
Personal DTI + credit; lowest rate.
DSCR
20% down · 8.5% · 30yr
- Down + closing
- —
- Monthly P&I
- —
- Monthly cashflow
- —
- DSCR
- —
- Eligible?
- —
No personal income docs; deal must DSCR.
Hard money
10% down · 12.0% · 12mo
- Down + closing
- —
- Monthly P&I
- —
- Monthly cashflow
- —
- DSCR
- —
- Eligible?
- —
Short-term bridge; refi at stabilization.
Rent comps 1 comps
| Address | Beds | Baths | Sqft | Rent | $/sqft | DOM | Units | Dist |
|---|---|---|---|---|---|---|---|---|
| 8 Tuthill Point Rd East Moriches, NY | 5.0 | 3.0 | 3000 | $20,000 | $6.67 | 44d | 1 | 1.19mi |
Listing history 8 events
-
2026-03-26status Pending
-
2026-03-04$899,000 Active
-
2026-02-25historical $899,000
-
2025-09-04price $899,000
-
2025-07-31$937,000 Active
-
2025-07-30historical
-
2001-07-24soldstatus $77,500
-
1985-02-13soldstatus $27,000
ⓘ Source: listings_history table (triggers on properties + properties_extension) + one-shot
backfill from property_details.listing_events for pre-trigger history.
Tax reassessment forecast NY · Partial reset (capped growth)
- Current annual tax
- $20,012 · $1,668/mo
- Projected year-2 tax
- $20,012 · $1,668/mo
- Expected delta
- $0/yr ($0/mo · 0.0%)
ⓘ Screening estimate from a state-policy table — verify with the county assessor before closing.
Climate risk First Street
- Flood 7/10 Severe FEMA zone AE · 96% chance over 30 yrs
- Wildfire 3/10 Moderate
- Heat 4/10 Moderate 7 d/yr ≥91°F today · 20 d/yr by 30 yrs out
- Wind 8/10 Severe 80% chance of damaging wind over 30 yrs
- Air quality 4/10 Moderate 3 unhealthy d/yr today · 5 by 30 yrs out
Nearby sold comps map
Loading sold comps map…
Walkable amenities ~0.75 mi
Loading nearby amenities…
Taxation est. · year 1
- Rental income
- $240,000
- − Mortgage interest
- −$50,358
- − Property taxes
- −$20,012
- − Insurance
- −$10,020
- − Repairs & maintenance
- −$19,200
- − Management
- −$19,200
- − Depreciation
- −$26,153
- Taxable income
- $95,058
- Est. tax owed @ 24.0%
- −$22,814
- After-tax cash flow
- $80,181/yr
For passive investors: Depreciation is non-cash, so a rental often shows a tax loss while cash-flowing — sheltering income. Rental losses are passive: they offset passive income freely, and up to $25,000/yr can offset ordinary (W-2) income if you actively participate and your MAGI is under $100k (phasing out to $0 by $150k); unused losses carry forward. On sale, claimed depreciation is recaptured at up to 25%, and gains may owe capital-gains tax (a 1031 exchange can defer both). Figures are a year-1 estimate at your 24.0% rate — not tax advice; consult a CPA.
Schools (NCES district)
- District
- Center Moriches Union Free School District
- NCES district ID
- 3606840
- Math proficiency
- 65% ▼ -9.00%
- Reading proficiency
- 55% ▼ -6.00%
- Median HH income
- $86,698
- Composite
- 54.64/100
- National rank
- #1332
- State rank
- #188 of 590 in NY
Livability — Center Moriches
- Score
- 66/100
- State rank
- #641
- US rank
- #11936
Category grades
Schools grade is shown separately in the Schools card above.
Census & demographics
- Census place
- Center Moriches, NY
- City population
- 8,222
- Population (ZIP)
- 8,222
Population outlook (Suffolk County) Hauer SSP2
- Today (2025)
- 1,505,262 people
- By 2030
- 1,498,318 · -0.5%
- By 2040
- 1,471,101 · -2.3%
- By 2050
- 1,424,848 · -5.3%
- By 2075
- 1,337,157 · -11.2%
- By 2100
- 1,217,720 · -19.1%
Race, ethnicity, and origin ACS 2023
- Neighborhood character
- Predominantly White (79%)
- Race & ethnicity
- White 79% Hispanic / Latino 14% Two or more races 3% Black 2% Asian 2%
- Hispanic origin (detail)
- Common ancestry
- Italian 6% Romanian 6% Scotch-Irish 3%
- Foreign-born
- 6% · Canada, China
- Languages at home
- 90% English-only · Spanish 5% Other Indo-European 2% Chinese 1%
Political lean MEDSL · Suffolk
- 2024 margin
- Lean R (+10.0) · D 45.0% · R 55.0%
- 2008→2024 swing
- -16.0pp toward R · 2008: 6.0pp · 2024: -10.0pp
- All cycles
- 2024: R+10.0 2020: R+0.0 2016: R+8.2 2012: D+2.9 2008: D+6.0
Not yet ingested
- Civics
- —
Market trends
- HPI YoY
- ▼ -95.89%
- Current HPI
- 350.6186
- Rent YoY
- —
- Metro
- —
- State GDP YoY
- ▲ 2.60%
- F500 in state
- 92
Industry mix (Fortune 500 HQ in NY)
| Industry | F500 HQs | Revenue |
|---|---|---|
| Financial Services | 10 | $950B |
|
||
| Consumer Goods | 9 | $162B |
|
||
| Insurance | 4 | $225B |
|
||
| Telecommunications | 2 | $144B |
|
||
| Pharmaceuticals | 2 | $112B |
|
||
| Media / Entertainment | 2 | $69B |
|
||
Price history
+3229.6% since first listed8 events — show timeline
- 2026-03-26 Pending — OneKey® MLS as Distributed by MLS Grid
- 2026-03-04 Listed $899,000 OneKey® MLS as Distributed by MLS Grid
- 2026-02-25 Coming Soon $899,000 OneKey® MLS as Distributed by MLS Grid
- 2025-09-04 Price Changed $899,000 OneKey® MLS as Distributed by MLS Grid
- 2025-07-31 Listed $937,000 OneKey® MLS as Distributed by MLS Grid
- 2025-07-30 Coming Soon — OneKey® MLS as Distributed by MLS Grid
- 2001-07-24 Sold (Public Records) $77,500 Public Records
- 1985-02-13 Sold (Public Records) $27,000 Public Records
Property tax history
+2.6%/yrLatest (2025): $20,012 · +0.0% YoY. Source: county tax records.
Cash-flow waterfall
monthlySold comps — $/sqft
last 12 mo · ≤1 miLoading sold comps…